| Param | Original file | Final file |
|---|---|---|
| Filename | modeM0/AS1T03_183T01_9000003606_24463cztM0_level2.evt | modeM0/AS1T03_183T01_9000003606_24463cztM0_level2_quad_clean.evt |
| Size (bytes) | 618,652,800 | 111,948,480 |
| Size | 590.0 MB | 106.8 MB |
| Events in quadrant A | 3,032,579 | 793,086 |
| Events in quadrant B | 4,778,725 | 745,213 |
| Events in quadrant C | 5,445,310 | 716,852 |
| Events in quadrant D | 5,056,301 | 698,705 |
| Mode M0 | |||
|---|---|---|---|
| Quadrant | BADHDUFLAG | Total packets | Discarded packets |
| A | 0 | 13026 | 2 |
| B | 0 | 18179 | 3 |
| C | 0 | 20245 | 2 |
| D | 0 | 19251 | 2 |
| Mode SS | |||
|---|---|---|---|
| Quadrant | BADHDUFLAG | Total packets | Discarded packets |
| A | 0 | 126 | 0 |
| B | 0 | 126 | 0 |
| C | 0 | 126 | 0 |
| D | 0 | 126 | 0 |
| Mode M9 | |||
|---|---|---|---|
| Quadrant | BADHDUFLAG | Total packets | Discarded packets |
| A | 0 | 14 | 0 |
| B | 0 | 15 | 0 |
| C | 0 | 15 | 0 |
| D | 0 | 15 | 0 |
| Quadrant | Total seconds | Saturated seconds | Saturation percentage |
|---|---|---|---|
| A | 6250 | 33 | 0.528000% |
| B | 6249 | 748 | 11.969915% |
| C | 6249 | 781 | 12.498000% |
| D | 6249 | 519 | 8.305329% |
Noise dominated data is calculated using 1-second bins in cleaned event files. If a bin has >2000 counts, and if more than 50% of those come from <1% of pixels, then it is considered to be noise-dominated and hence unusable.
| Quadrant | # 1 sec bins | Bins with >0 counts | Bins with >2000 counts | High rate bins dominated by noise | Noise dominated (total time) | Noise dominated (detector-on time) | Marked lightcurve |
|---|---|---|---|---|---|---|---|
| A | 7560 | 6251 | 0 | 0 | 0.00% | 0.00% | 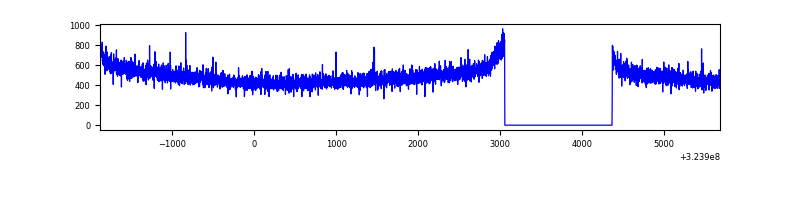 |
| B | 7559 | 6250 | 527 | 527 | 6.97% | 8.43% | 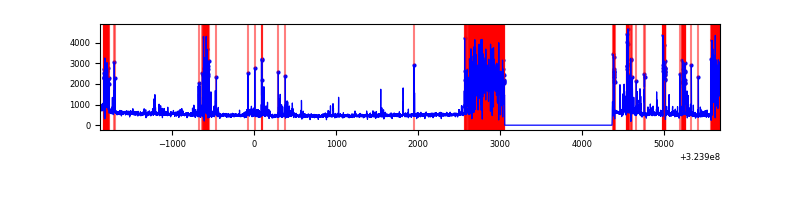 |
| C | 7559 | 6250 | 489 | 489 | 6.47% | 7.82% | 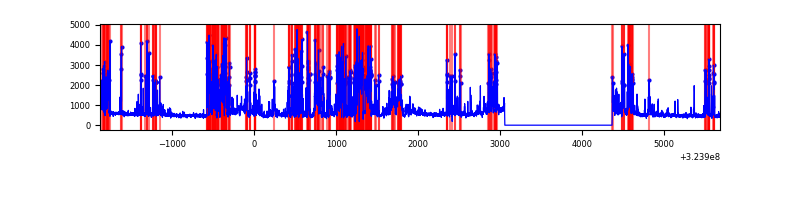 |
| D | 7559 | 6250 | 396 | 396 | 5.24% | 6.34% | 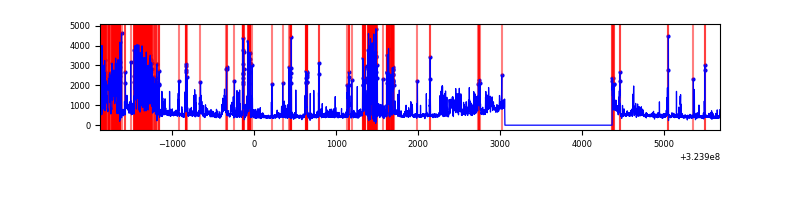 |
Top three noisy pixels from each quadrant. If the there are fewer than three noisy pixels in the level2.evt file, extra rows are filled as -1
| Pixel properties | Quadrant properties | ||||||
|---|---|---|---|---|---|---|---|
| Quadrant | DetID | PixID | Counts | Sigma | Mean | Median | Sigma |
| A | 13 | 254 | 9152 | 53.4 | 785 | 770 | 157.0 |
| A | 3 | 137 | 6813 | 38.5 | 785 | 770 | 157.0 |
| A | 0 | 226 | 6719 | 37.9 | 785 | 770 | 157.0 |
| B | 3 | 64 | 1796907 | 13219.93 | 731 | 715 | 135.9 |
| B | 5 | 172 | 63103 | 459.17 | 731 | 715 | 135.9 |
| B | 6 | 36 | 41267 | 298.46 | 731 | 715 | 135.9 |
| C | 2 | 16 | 2483718 | 14986.98 | 721 | 726 | 165.7 |
| C | 14 | 238 | 117067 | 702.22 | 721 | 726 | 165.7 |
| C | 10 | 9 | 27258 | 160.14 | 721 | 726 | 165.7 |
| D | 12 | 218 | 1343909 | 7716.03 | 724 | 703 | 174.1 |
| D | 1 | 52 | 844591 | 4847.7 | 724 | 703 | 174.1 |
| D | 9 | 1 | 31996 | 179.76 | 724 | 703 | 174.1 |
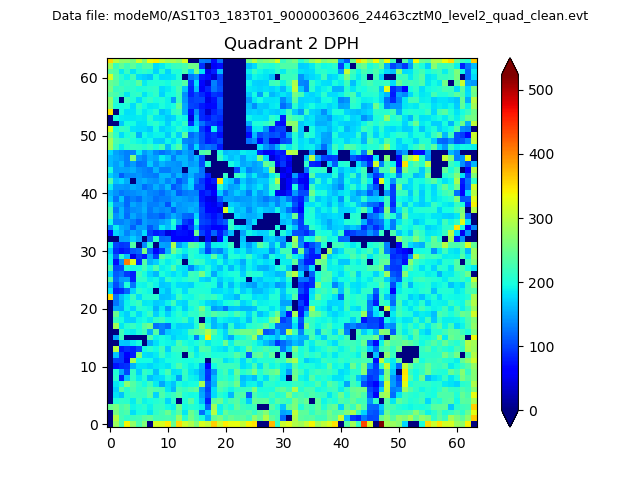
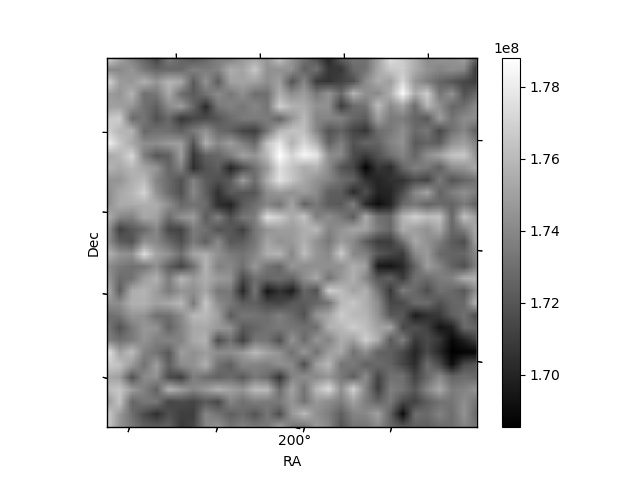
Histogram calculated using DETX and DETY for each event in the final _common_clean file
| Quadrant A | 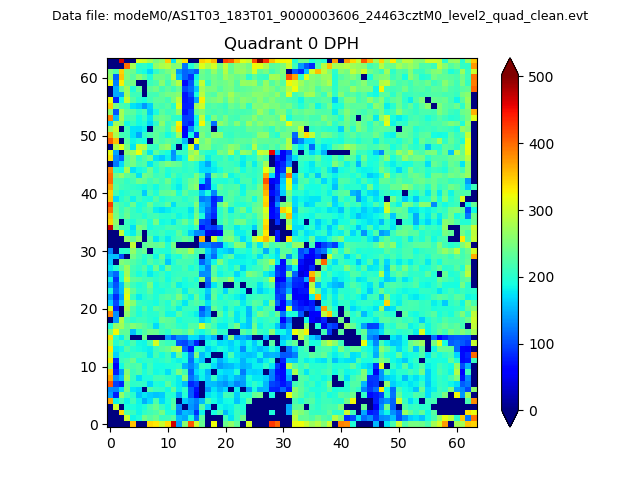 |
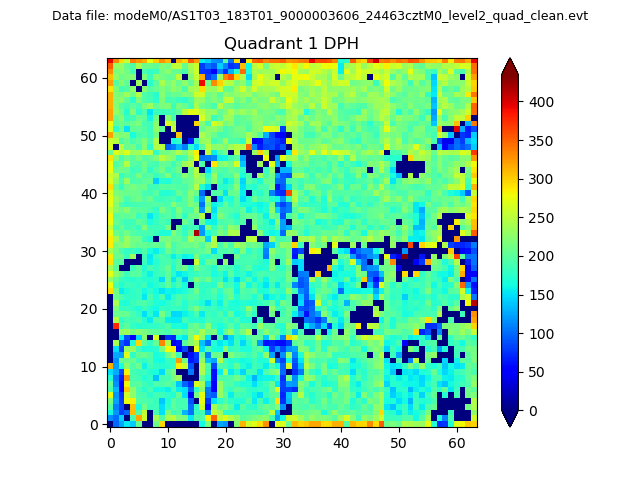 |
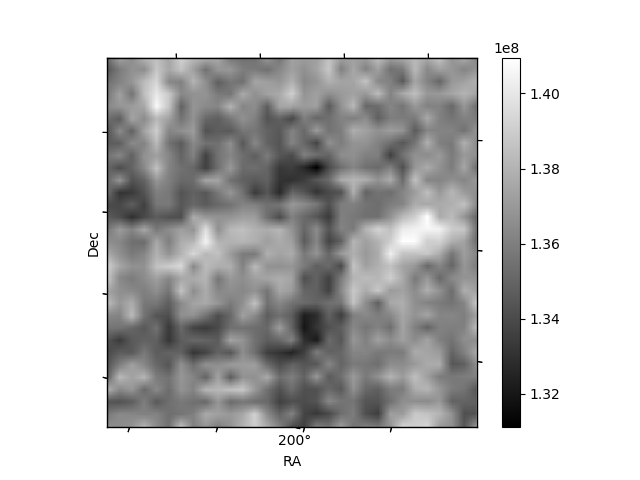
Quadrant B |
|---|---|---|---|
| Quadrant D | 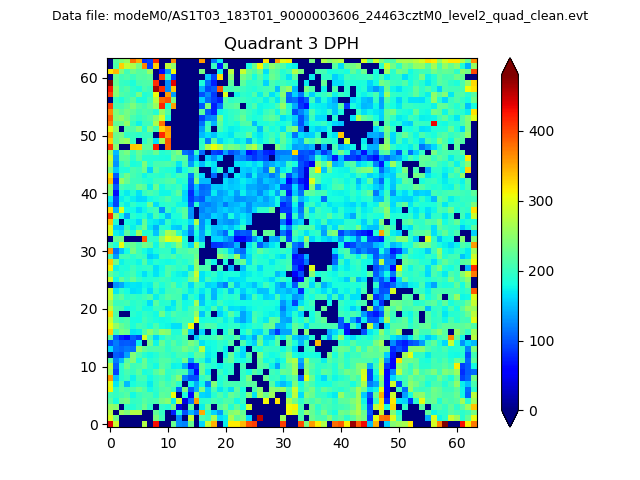 |
 |
Quadrant C |
| Plot type | Count rate plots | Images |
|---|---|---|
| Comparison with Poisson distribution Blue bars denote a histogram of data divided into 1 sec bins. Red curve is a Poisson curve with rate = median count rate of data. |
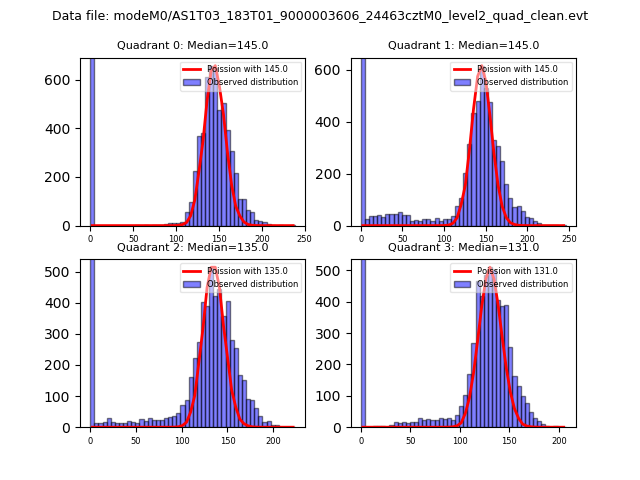 |
 |
| Quadrant-wise count rates Data is divided into 100 sec bins |
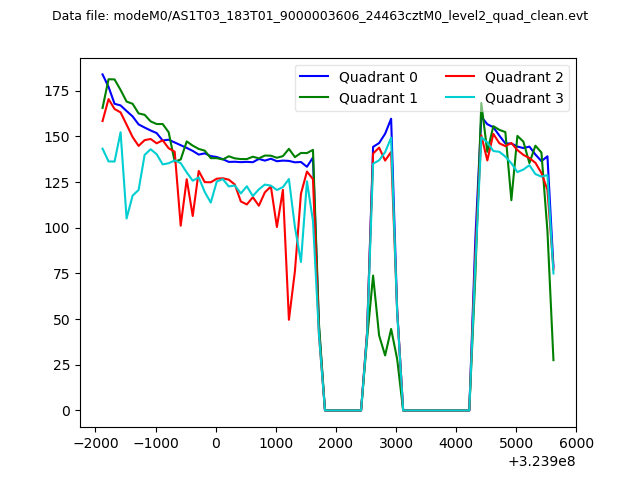 |
|
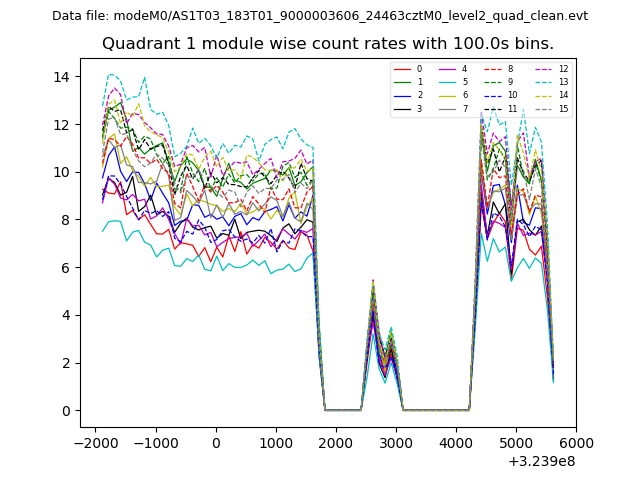
| Module-wise count rates for Quadrant A Data is divided into 100 sec bins |
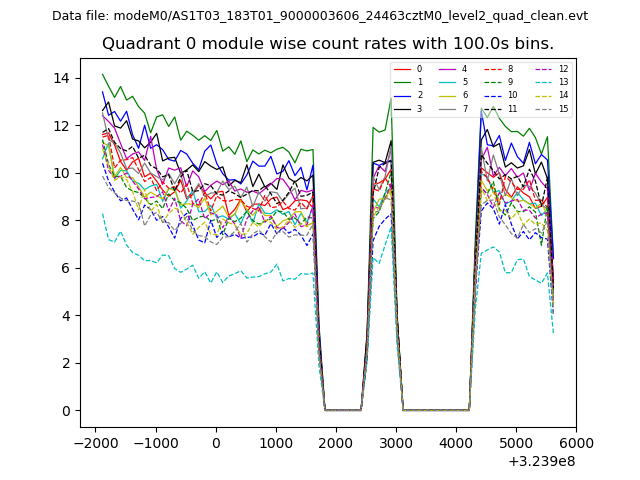 |
 |
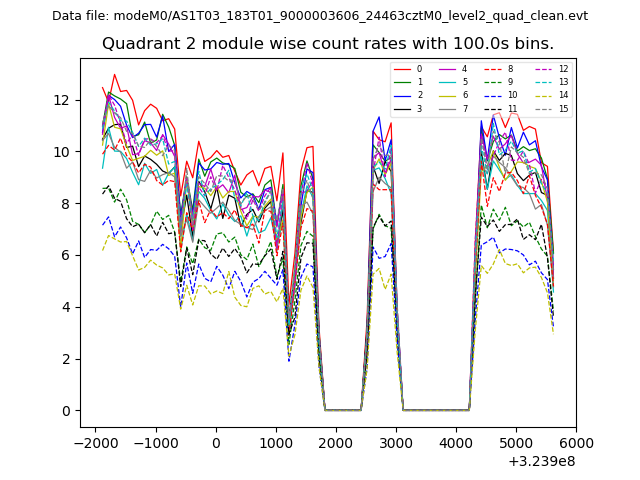
| Module-wise count rates for Quadrant B Data is divided into 100 sec bins |
 |
 |
| Module-wise count rates for Quadrant C Data is divided into 100 sec bins |
 |
 |
| Module-wise count rates for Quadrant D Data is divided into 100 sec bins |
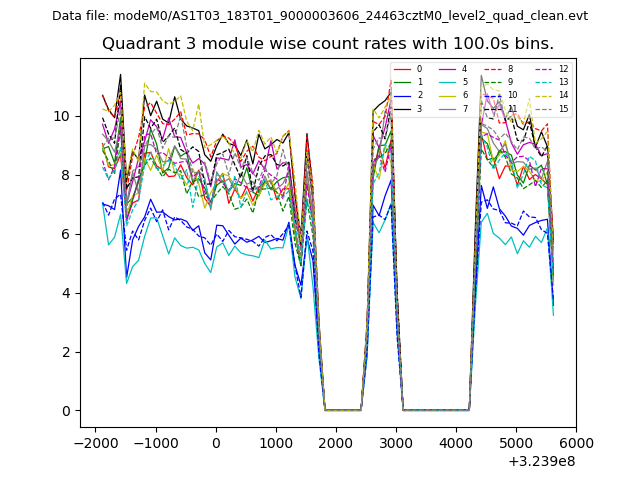 |
 |
| Parameter | Plot |
|---|---|
| CZT HV Monitor | 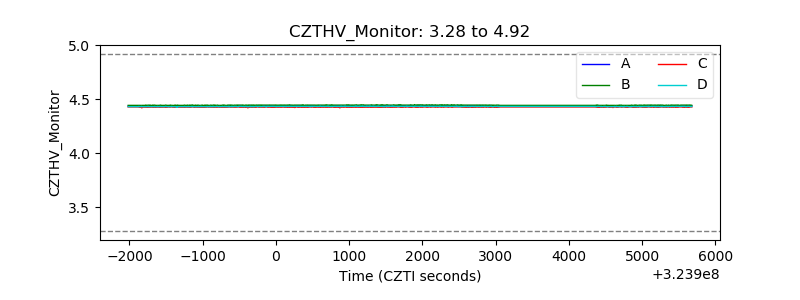 |
| D_VDD | 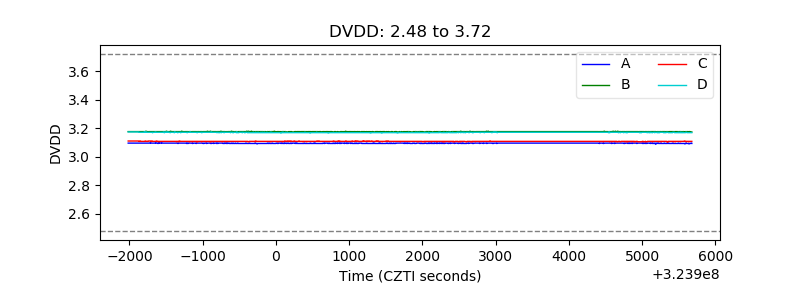 |
| Temperature 1 | 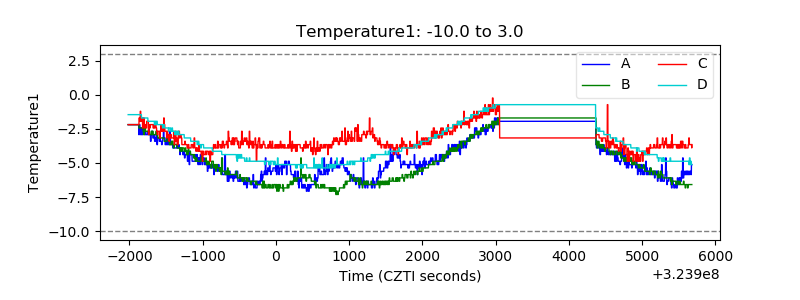 |
| Veto HV Monitor | 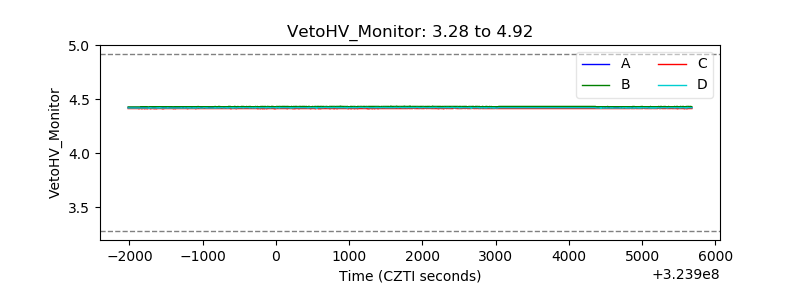 |
| Veto LLD | 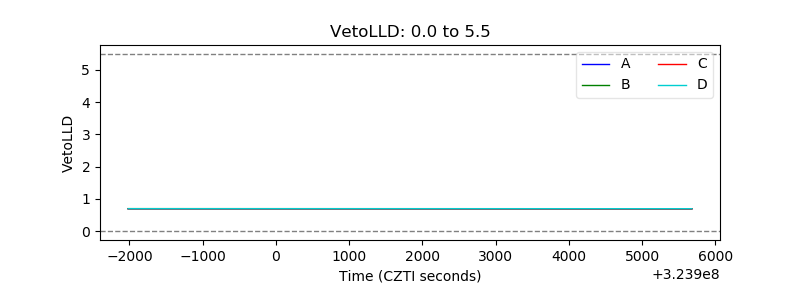 |
| Alpha Counter | 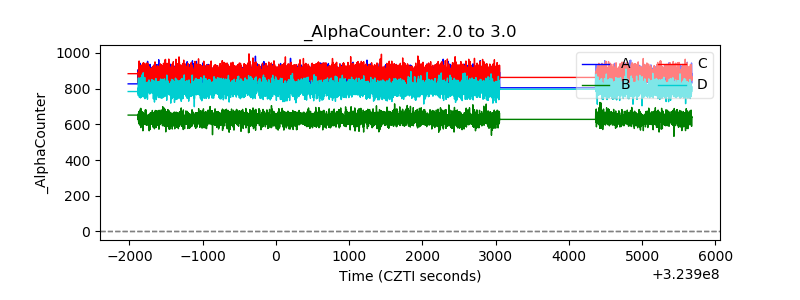 |
| _CPM_Rate | 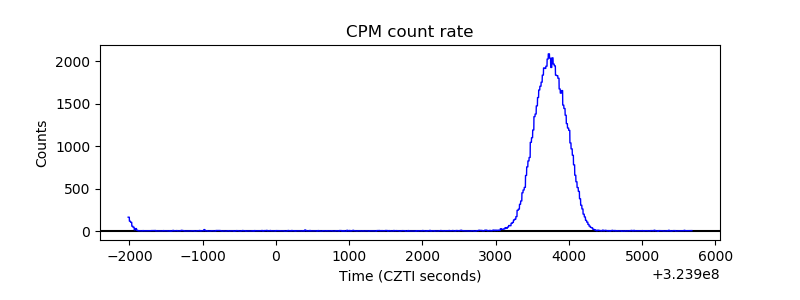 |
| CZT Counter | 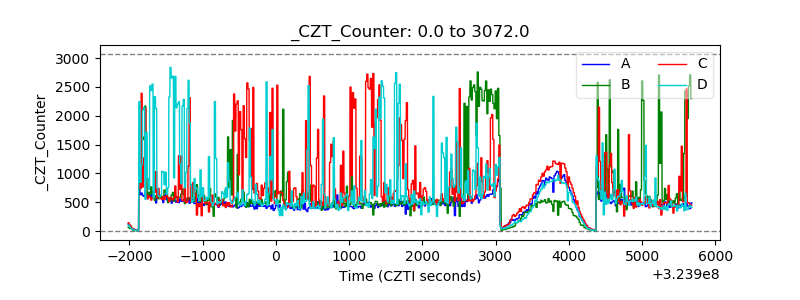 |
| +2.5 Volts monitor |  |
| +5 Volts monitor |  |
| _ROLL_ROT | 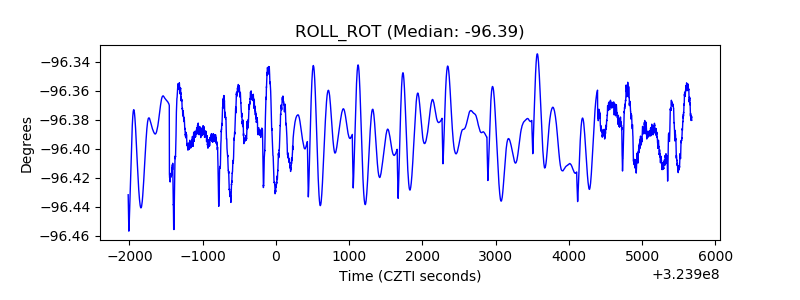 |
| _Roll_DEC | 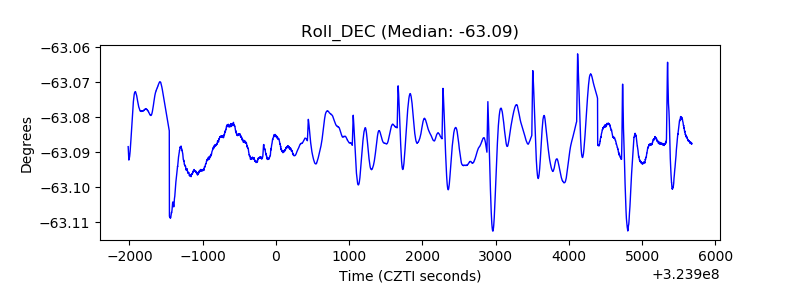 |
| _Roll_RA | 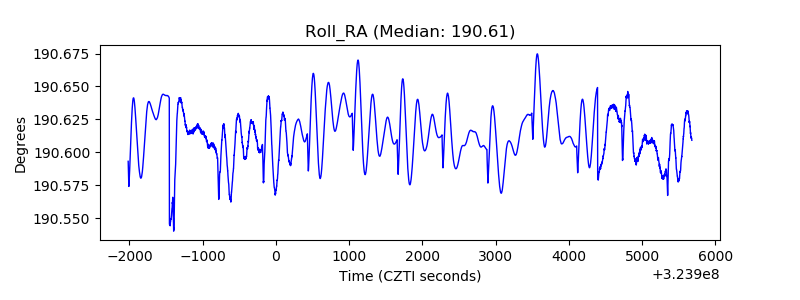 |
| Veto Counter | 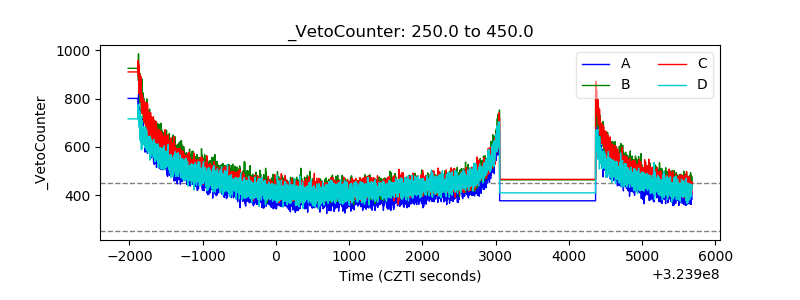 |