| Param | Original file | Final file |
|---|---|---|
| Filename | modeM0/AS1T03_183T01_9000003606_24464cztM0_level2.evt | modeM0/AS1T03_183T01_9000003606_24464cztM0_level2_quad_clean.evt |
| Size (bytes) | 631,955,520 | 116,893,440 |
| Size | 602.7 MB | 111.5 MB |
| Events in quadrant A | 3,108,596 | 807,837 |
| Events in quadrant B | 5,683,967 | 781,097 |
| Events in quadrant C | 4,618,834 | 759,964 |
| Events in quadrant D | 5,275,005 | 724,914 |
| Mode M0 | |||
|---|---|---|---|
| Quadrant | BADHDUFLAG | Total packets | Discarded packets |
| A | 0 | 13740 | 3 |
| B | 0 | 21323 | 3 |
| C | 0 | 18156 | 3 |
| D | 0 | 20280 | 3 |
| Mode SS | |||
|---|---|---|---|
| Quadrant | BADHDUFLAG | Total packets | Discarded packets |
| A | 0 | 136 | 0 |
| B | 0 | 136 | 0 |
| C | 0 | 136 | 0 |
| D | 0 | 136 | 0 |
| Mode M9 | |||
|---|---|---|---|
| Quadrant | BADHDUFLAG | Total packets | Discarded packets |
| A | 0 | 16 | 0 |
| B | 0 | 17 | 0 |
| C | 0 | 17 | 0 |
| D | 0 | 17 | 0 |
| Quadrant | Total seconds | Saturated seconds | Saturation percentage |
|---|---|---|---|
| A | 6682 | 21 | 0.314277% |
| B | 6682 | 739 | 11.059563% |
| C | 6682 | 429 | 6.420233% |
| D | 6682 | 481 | 7.198444% |
Noise dominated data is calculated using 1-second bins in cleaned event files. If a bin has >2000 counts, and if more than 50% of those come from <1% of pixels, then it is considered to be noise-dominated and hence unusable.
| Quadrant | # 1 sec bins | Bins with >0 counts | Bins with >2000 counts | High rate bins dominated by noise | Noise dominated (total time) | Noise dominated (detector-on time) | Marked lightcurve |
|---|---|---|---|---|---|---|---|
| A | 7812 | 6684 | 0 | 0 | 0.00% | 0.00% | 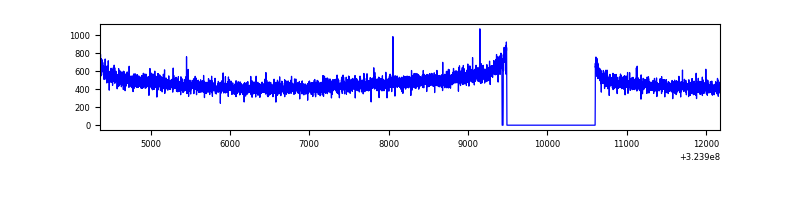 |
| B | 7812 | 6684 | 467 | 467 | 5.98% | 6.99% | 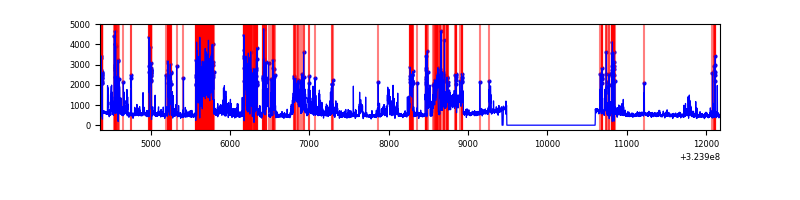 |
| C | 7812 | 6684 | 177 | 177 | 2.27% | 2.65% | 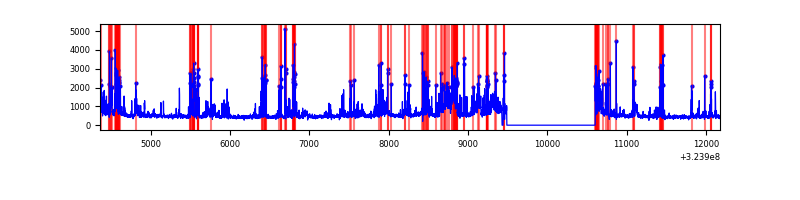 |
| D | 7812 | 6684 | 413 | 413 | 5.29% | 6.18% | 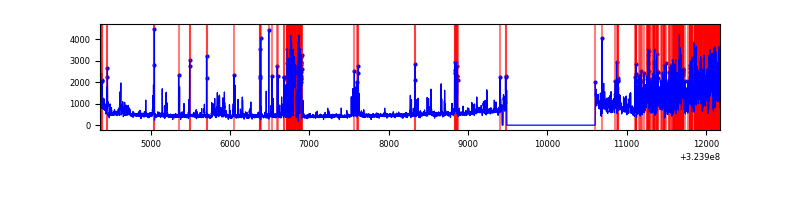 |
Top three noisy pixels from each quadrant. If the there are fewer than three noisy pixels in the level2.evt file, extra rows are filled as -1
| Pixel properties | Quadrant properties | ||||||
|---|---|---|---|---|---|---|---|
| Quadrant | DetID | PixID | Counts | Sigma | Mean | Median | Sigma |
| A | 13 | 254 | 9513 | 53.64 | 806 | 790 | 162.6 |
| A | 3 | 137 | 7039 | 38.42 | 806 | 790 | 162.6 |
| A | 0 | 226 | 6984 | 38.09 | 806 | 790 | 162.6 |
| B | 3 | 64 | 2081569 | 14246.52 | 782 | 763 | 146.1 |
| B | 6 | 36 | 283598 | 1936.47 | 782 | 763 | 146.1 |
| B | 5 | 172 | 185457 | 1264.53 | 782 | 763 | 146.1 |
| C | 2 | 16 | 1434705 | 8088.89 | 767 | 772 | 177.3 |
| C | 14 | 238 | 124384 | 697.3 | 767 | 772 | 177.3 |
| C | 10 | 9 | 28721 | 157.66 | 767 | 772 | 177.3 |
| D | 12 | 218 | 1098773 | 5964.63 | 758 | 734 | 184.1 |
| D | 1 | 52 | 589923 | 3200.52 | 758 | 734 | 184.1 |
| D | 7 | 238 | 406516 | 2204.24 | 758 | 734 | 184.1 |
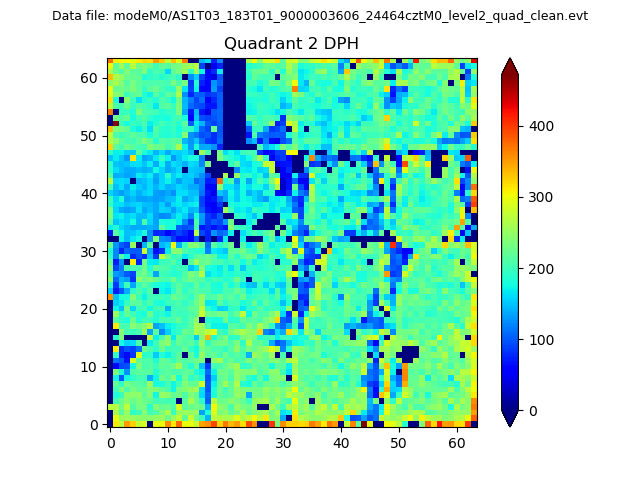
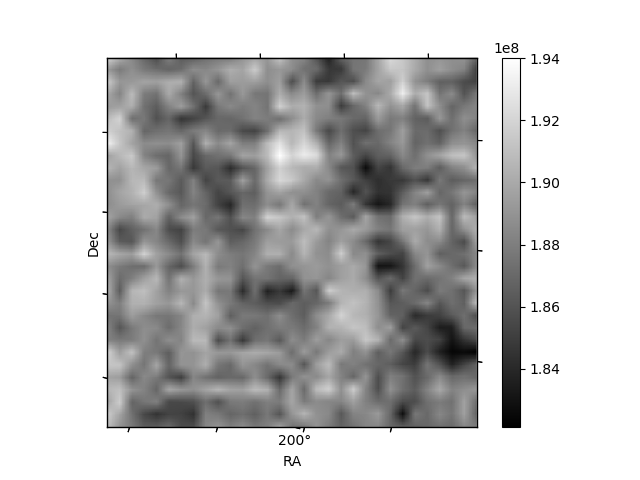
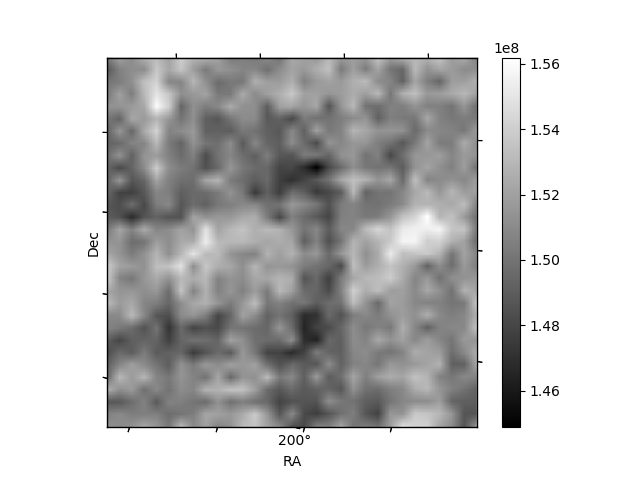
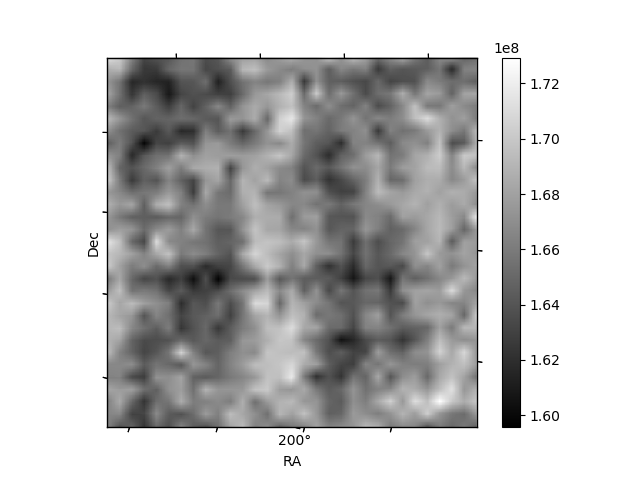
Histogram calculated using DETX and DETY for each event in the final _common_clean file
| Quadrant A | 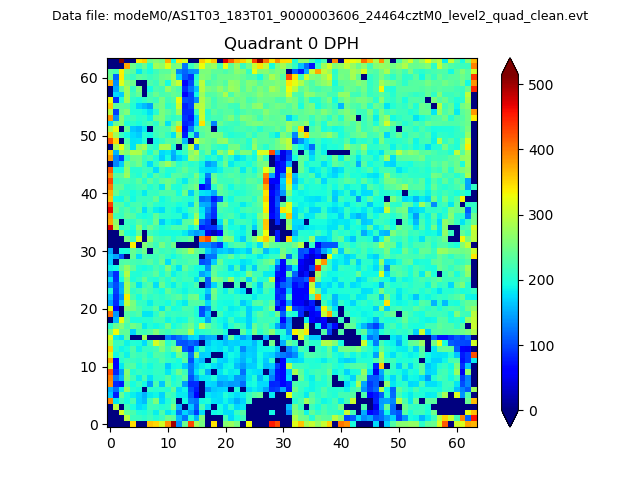 |
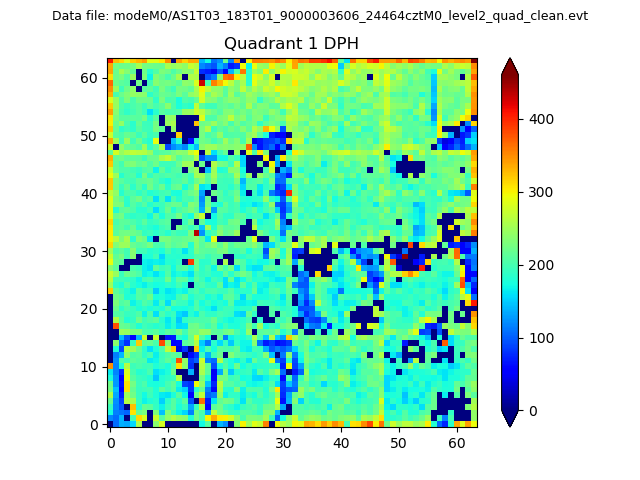 |
Quadrant B |
|---|---|---|---|
| Quadrant D | 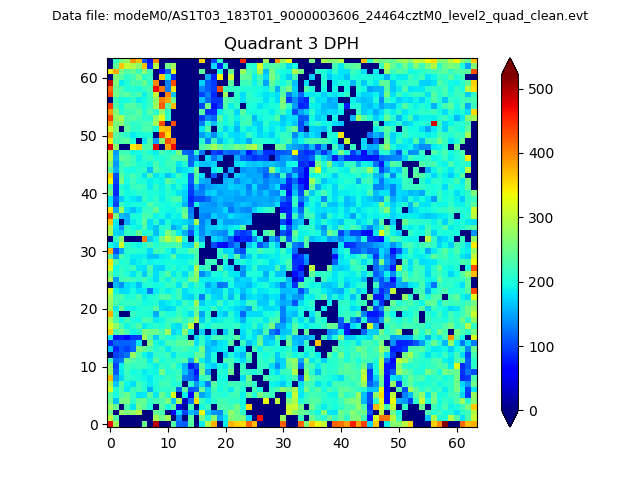 |
 |
Quadrant C |
| Plot type | Count rate plots | Images |
|---|---|---|
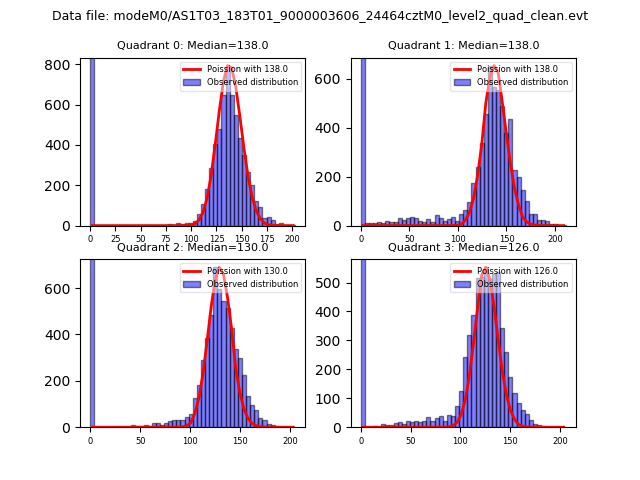
| Comparison with Poisson distribution Blue bars denote a histogram of data divided into 1 sec bins. Red curve is a Poisson curve with rate = median count rate of data. |
 |
 |
| Quadrant-wise count rates Data is divided into 100 sec bins |
 |
|
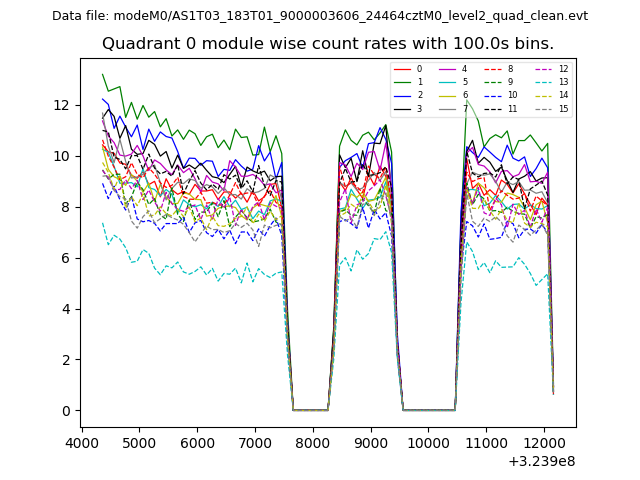
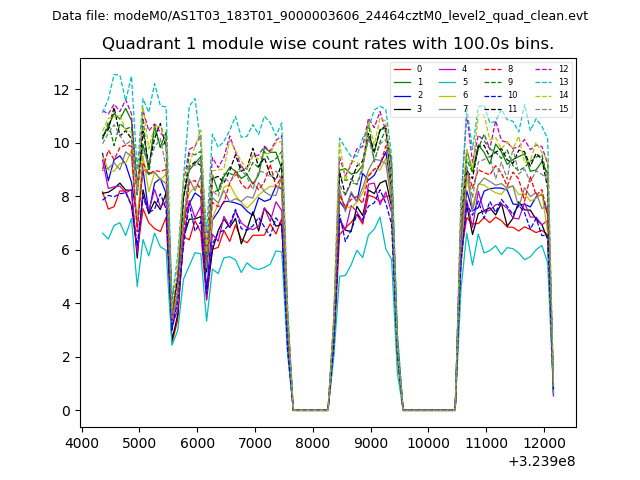
| Module-wise count rates for Quadrant A Data is divided into 100 sec bins |
 |
 |
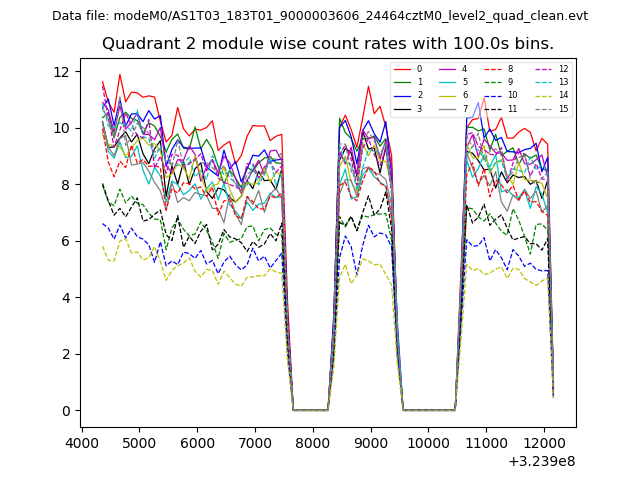
| Module-wise count rates for Quadrant B Data is divided into 100 sec bins |
 |
 |
| Module-wise count rates for Quadrant C Data is divided into 100 sec bins |
 |
 |
| Module-wise count rates for Quadrant D Data is divided into 100 sec bins |
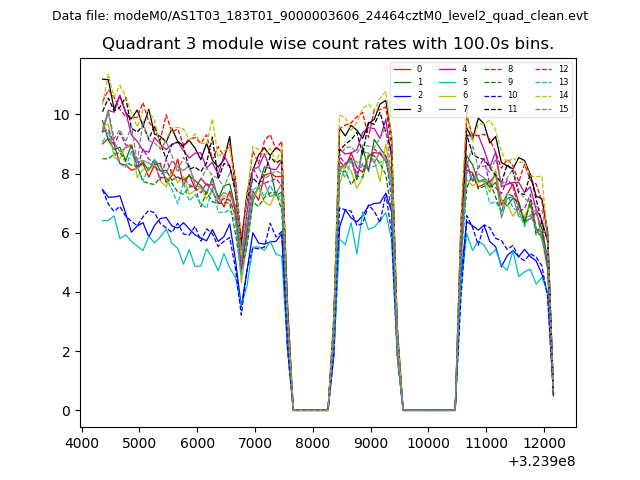 |
 |
| Parameter | Plot |
|---|---|
| CZT HV Monitor | 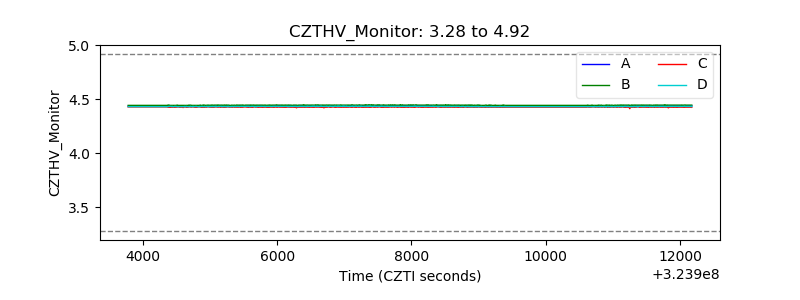 |
| D_VDD | 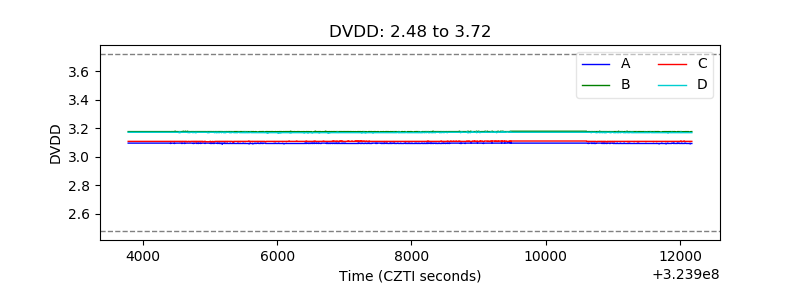 |
| Temperature 1 | 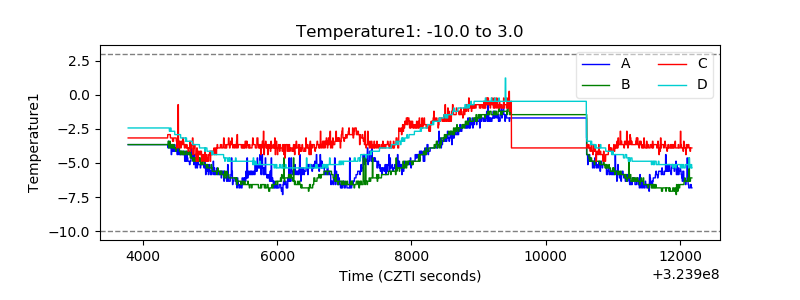 |
| Veto HV Monitor | 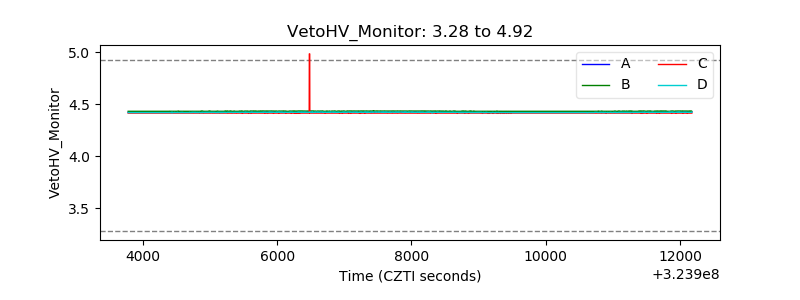 |
| Veto LLD | 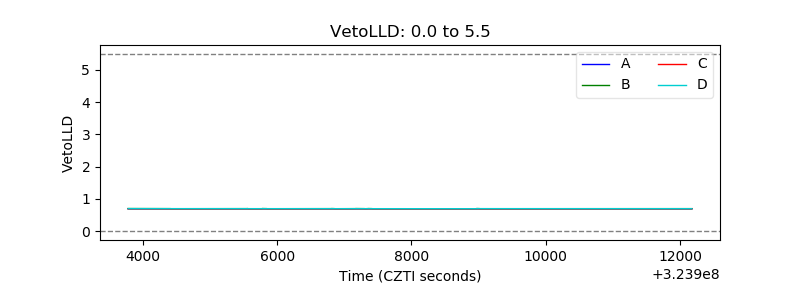 |
| Alpha Counter | 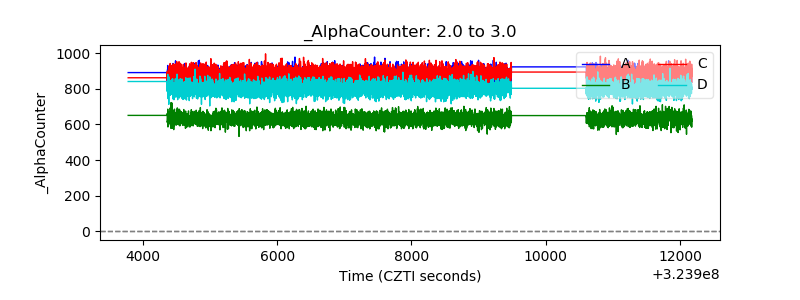 |
| _CPM_Rate |  |
| CZT Counter | 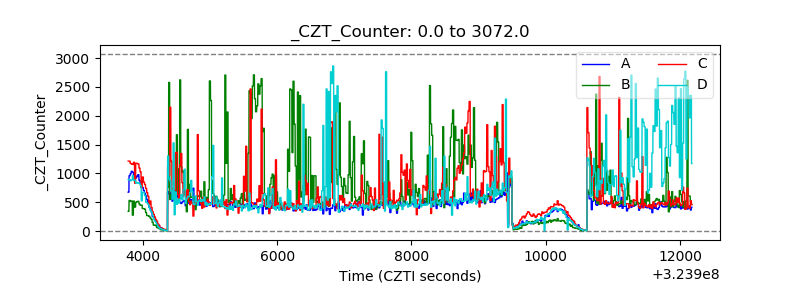 |
| +2.5 Volts monitor |  |
| +5 Volts monitor | 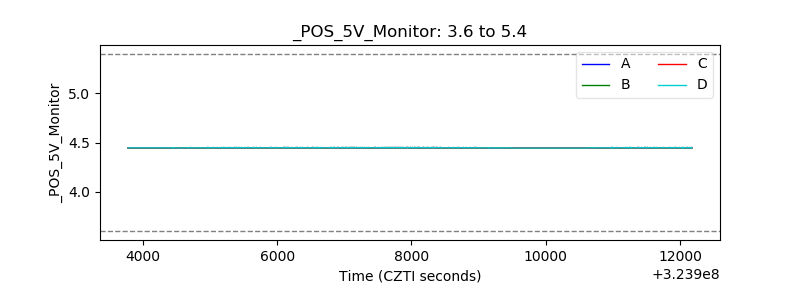 |
| _ROLL_ROT | 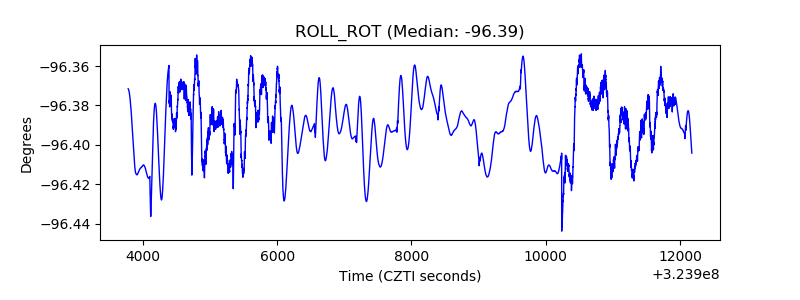 |
| _Roll_DEC | 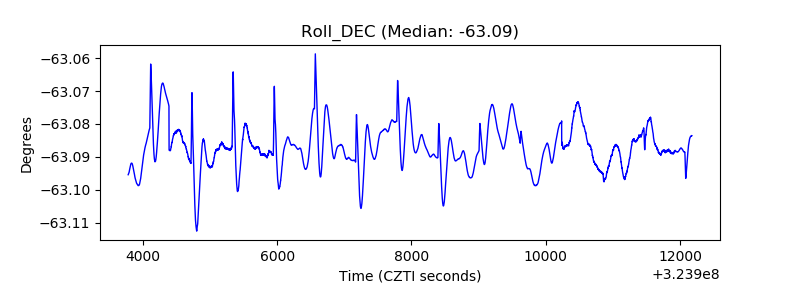 |
| _Roll_RA | 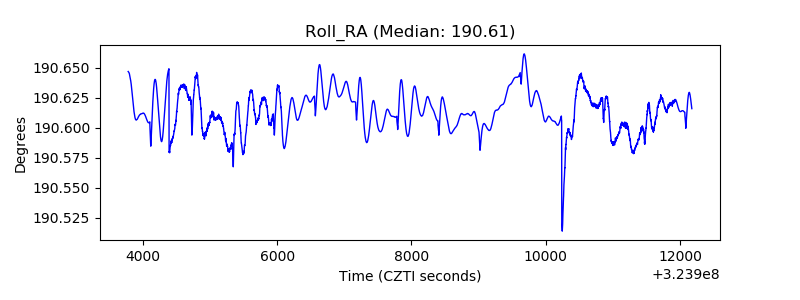 |
| Veto Counter | 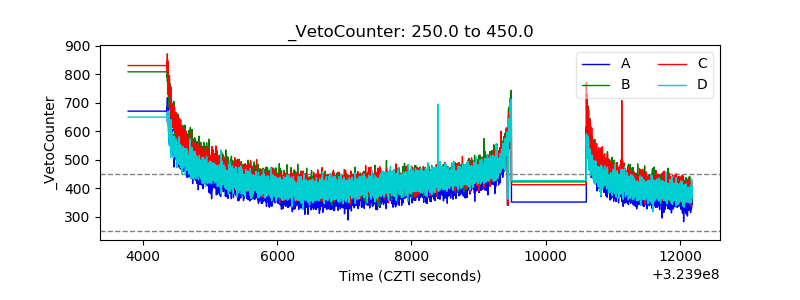 |