| Param | Original file | Final file |
|---|---|---|
| Filename | modeM0/AS1T03_183T01_9000003606_24465cztM0_level2.evt | modeM0/AS1T03_183T01_9000003606_24465cztM0_level2_quad_clean.evt |
| Size (bytes) | 726,217,920 | 119,312,640 |
| Size | 692.6 MB | 113.8 MB |
| Events in quadrant A | 3,208,576 | 821,500 |
| Events in quadrant B | 4,427,170 | 821,873 |
| Events in quadrant C | 6,283,652 | 751,750 |
| Events in quadrant D | 7,596,374 | 725,042 |
| Mode M0 | |||
|---|---|---|---|
| Quadrant | BADHDUFLAG | Total packets | Discarded packets |
| A | 0 | 14337 | 3 |
| B | 0 | 17765 | 2 |
| C | 0 | 23346 | 2 |
| D | 0 | 27537 | 2 |
| Mode SS | |||
|---|---|---|---|
| Quadrant | BADHDUFLAG | Total packets | Discarded packets |
| A | 0 | 142 | 0 |
| B | 0 | 142 | 0 |
| C | 0 | 142 | 0 |
| D | 0 | 142 | 0 |
| Mode M9 | |||
|---|---|---|---|
| Quadrant | BADHDUFLAG | Total packets | Discarded packets |
| A | 0 | 17 | 0 |
| B | 0 | 18 | 0 |
| C | 0 | 18 | 0 |
| D | 0 | 18 | 0 |
| Quadrant | Total seconds | Saturated seconds | Saturation percentage |
|---|---|---|---|
| A | 7079 | 9 | 0.127137% |
| B | 7079 | 339 | 4.788812% |
| C | 7079 | 854 | 12.063851% |
| D | 7079 | 822 | 11.611810% |
Noise dominated data is calculated using 1-second bins in cleaned event files. If a bin has >2000 counts, and if more than 50% of those come from <1% of pixels, then it is considered to be noise-dominated and hence unusable.
| Quadrant | # 1 sec bins | Bins with >0 counts | Bins with >2000 counts | High rate bins dominated by noise | Noise dominated (total time) | Noise dominated (detector-on time) | Marked lightcurve |
|---|---|---|---|---|---|---|---|
| A | 7874 | 7080 | 0 | 0 | 0.00% | 0.00% | 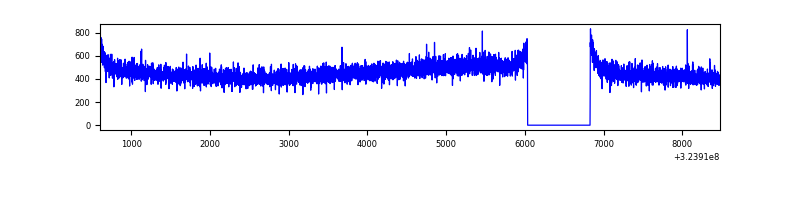 |
| B | 7874 | 7080 | 152 | 152 | 1.93% | 2.15% | 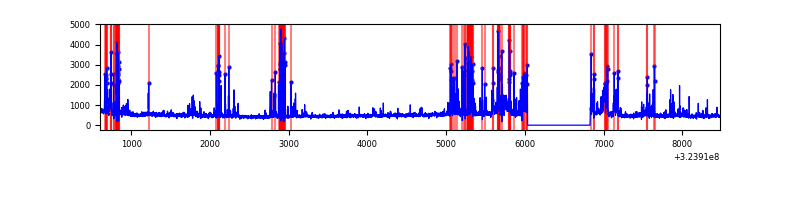 |
| C | 7874 | 7080 | 581 | 581 | 7.38% | 8.21% | 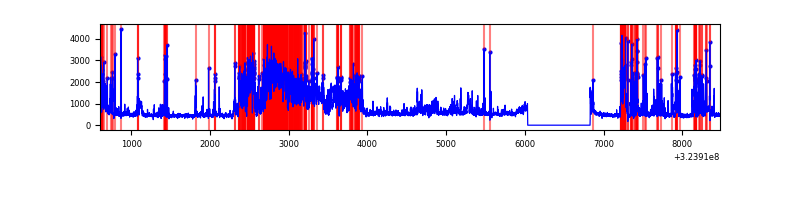 |
| D | 7874 | 7080 | 810 | 810 | 10.29% | 11.44% | 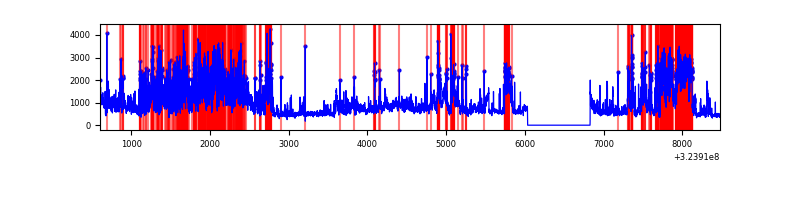 |
Top three noisy pixels from each quadrant. If the there are fewer than three noisy pixels in the level2.evt file, extra rows are filled as -1
| Pixel properties | Quadrant properties | ||||||
|---|---|---|---|---|---|---|---|
| Quadrant | DetID | PixID | Counts | Sigma | Mean | Median | Sigma |
| A | 13 | 254 | 11079 | 61.81 | 832 | 817 | 166.0 |
| A | 3 | 137 | 7308 | 39.1 | 832 | 817 | 166.0 |
| A | 0 | 226 | 7040 | 37.48 | 832 | 817 | 166.0 |
| B | 3 | 64 | 882035 | 5682.2 | 823 | 803 | 155.1 |
| B | 5 | 172 | 120760 | 773.48 | 823 | 803 | 155.1 |
| B | 7 | 202 | 91393 | 584.12 | 823 | 803 | 155.1 |
| C | 7 | 247 | 1962487 | 10843.57 | 777 | 779 | 180.9 |
| C | 2 | 16 | 1078934 | 5959.63 | 777 | 779 | 180.9 |
| C | 14 | 238 | 124480 | 683.77 | 777 | 779 | 180.9 |
| D | 12 | 218 | 2585448 | 13812.07 | 777 | 755 | 187.1 |
| D | 1 | 52 | 897822 | 4793.74 | 777 | 755 | 187.1 |
| D | 7 | 238 | 883776 | 4718.68 | 777 | 755 | 187.1 |
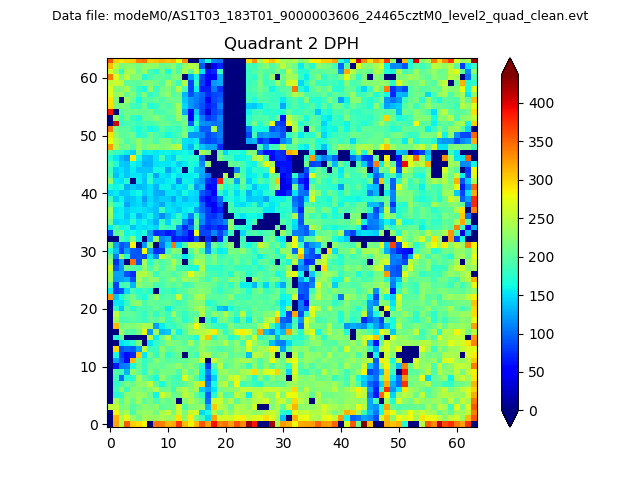
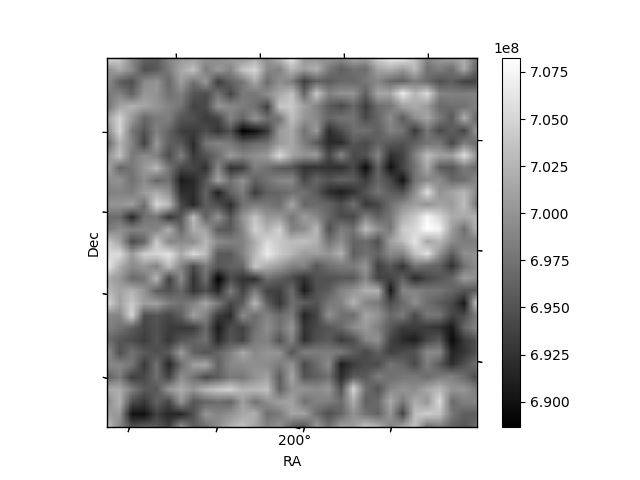
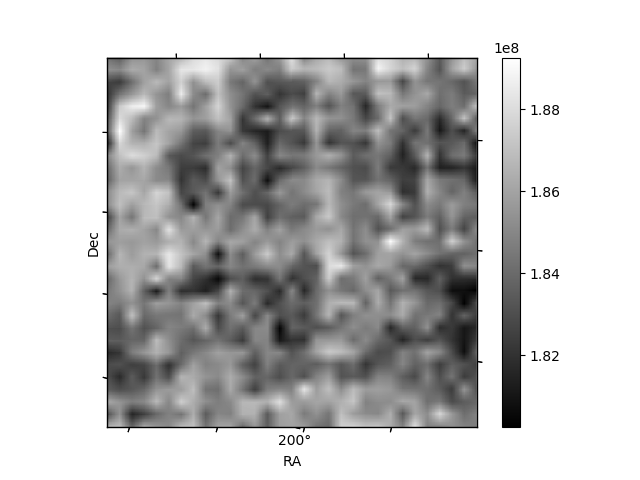
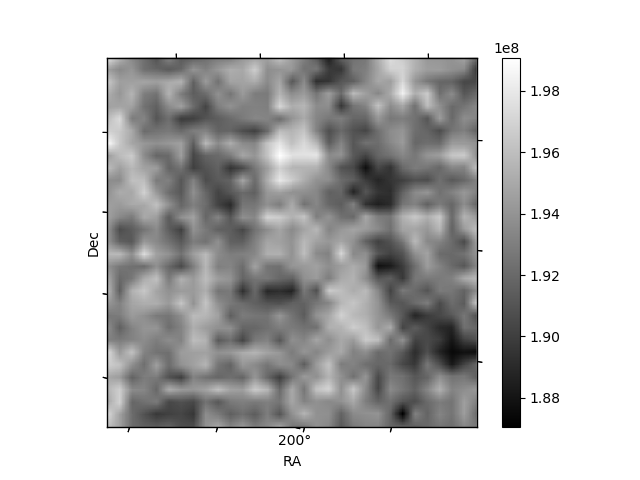
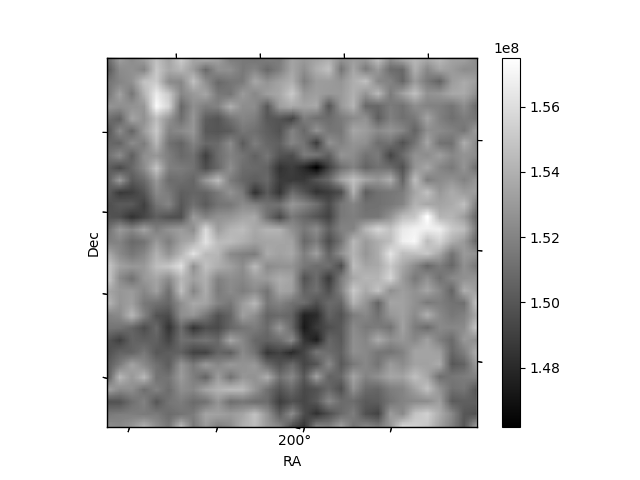
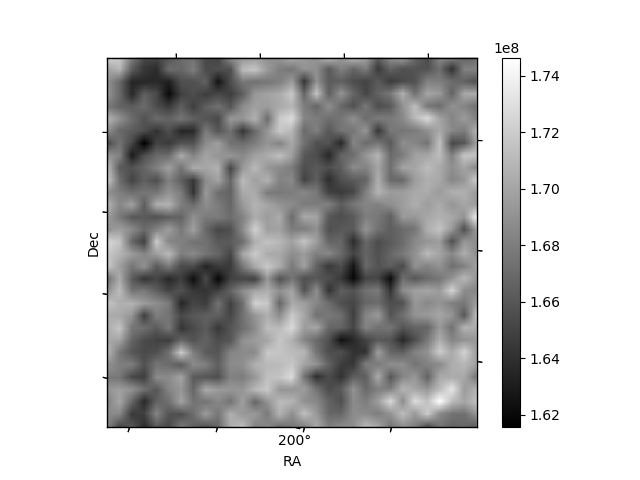
Histogram calculated using DETX and DETY for each event in the final _common_clean file
| Quadrant A | 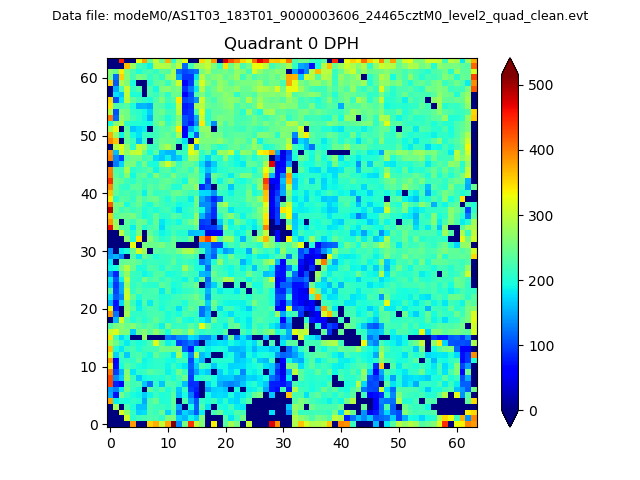 |
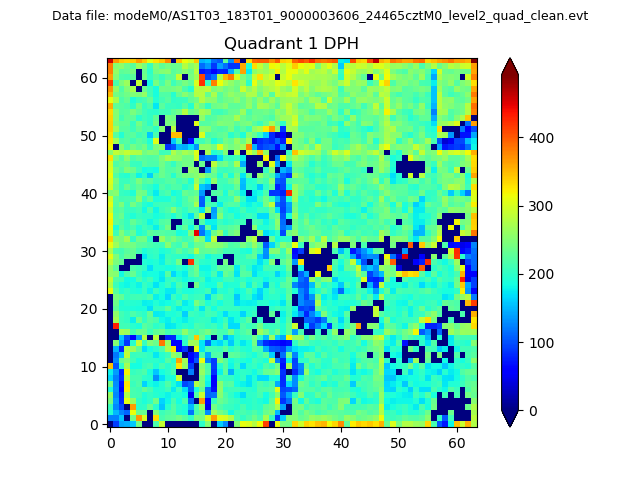 |
Quadrant B |
|---|---|---|---|
| Quadrant D | 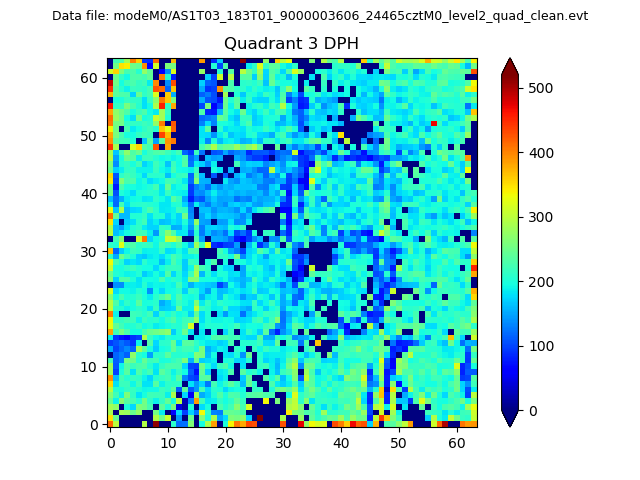 |
 |
Quadrant C |
| Plot type | Count rate plots | Images |
|---|---|---|
| Comparison with Poisson distribution Blue bars denote a histogram of data divided into 1 sec bins. Red curve is a Poisson curve with rate = median count rate of data. |
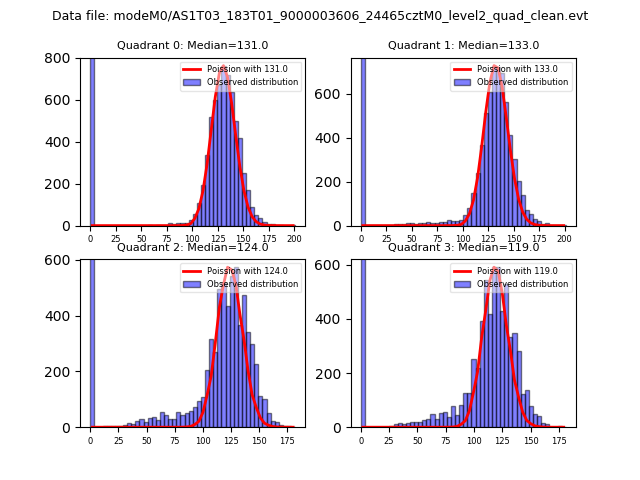 |
 |
| Quadrant-wise count rates Data is divided into 100 sec bins |
 |
|
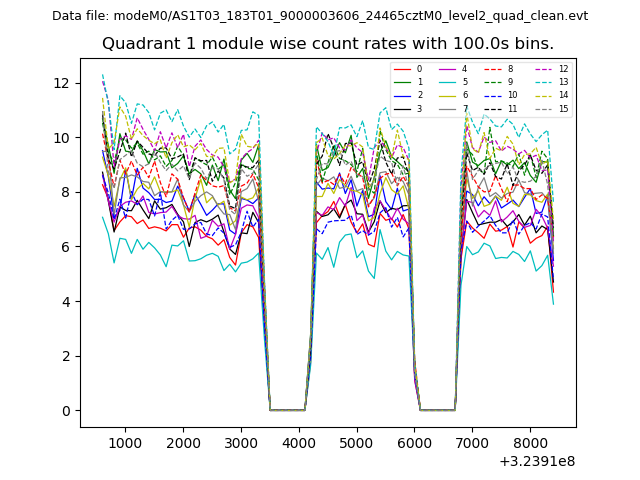
| Module-wise count rates for Quadrant A Data is divided into 100 sec bins |
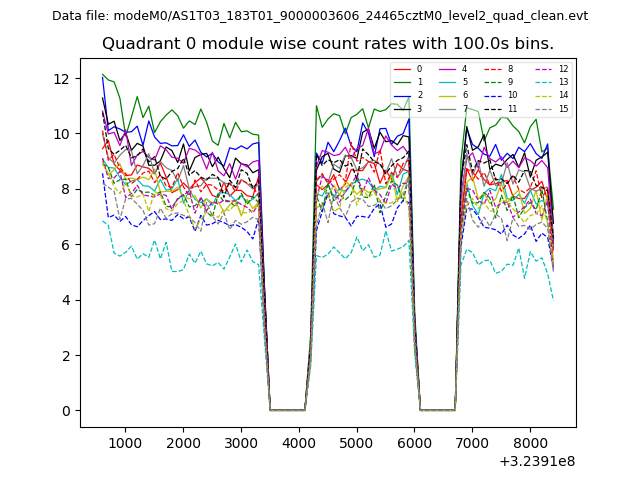 |
 |
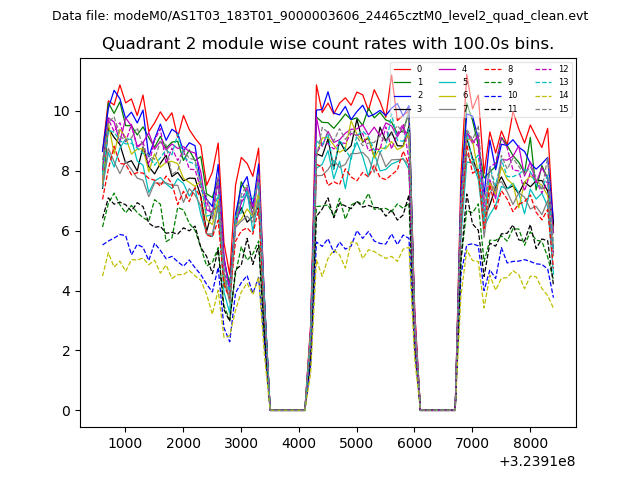
| Module-wise count rates for Quadrant B Data is divided into 100 sec bins |
 |
 |
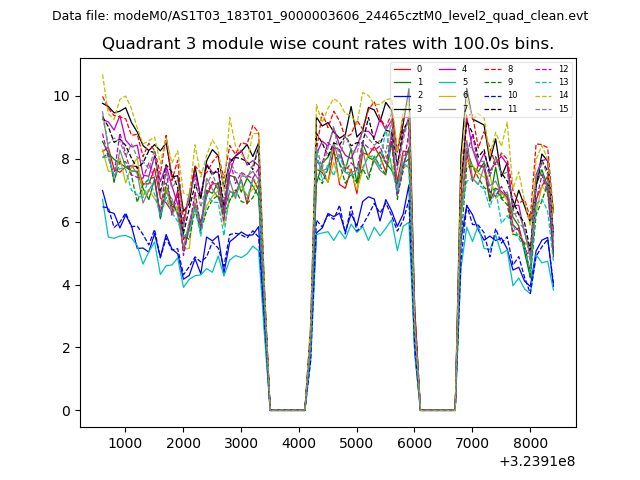
| Module-wise count rates for Quadrant C Data is divided into 100 sec bins |
 |
 |
| Module-wise count rates for Quadrant D Data is divided into 100 sec bins |
 |
 |
| Parameter | Plot |
|---|---|
| CZT HV Monitor | 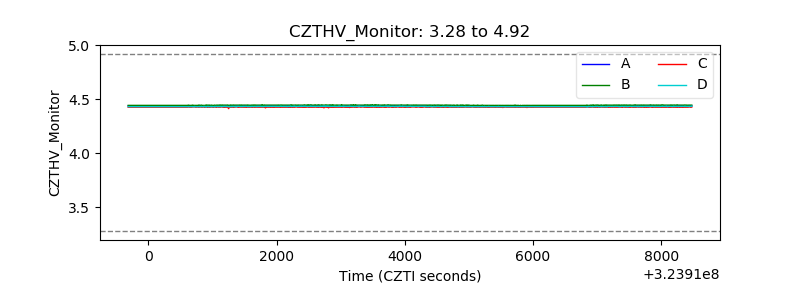 |
| D_VDD | 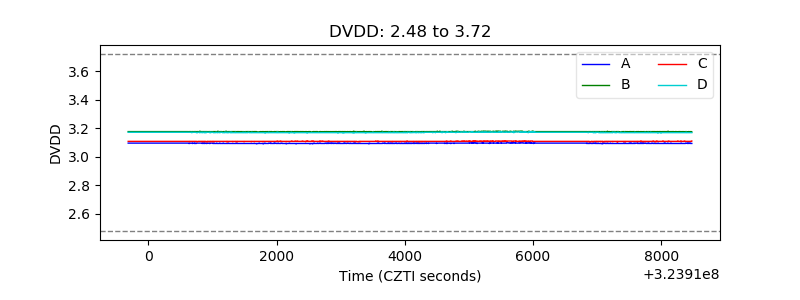 |
| Temperature 1 | 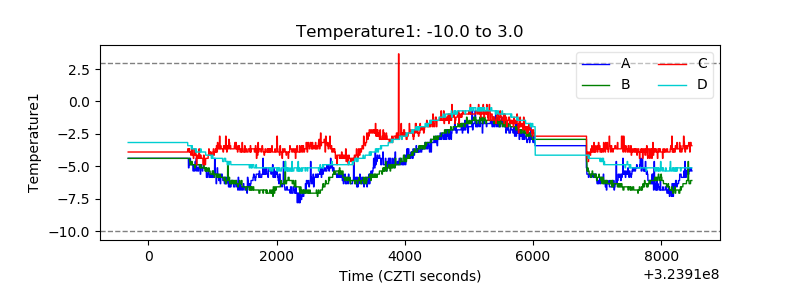 |
| Veto HV Monitor |  |
| Veto LLD | 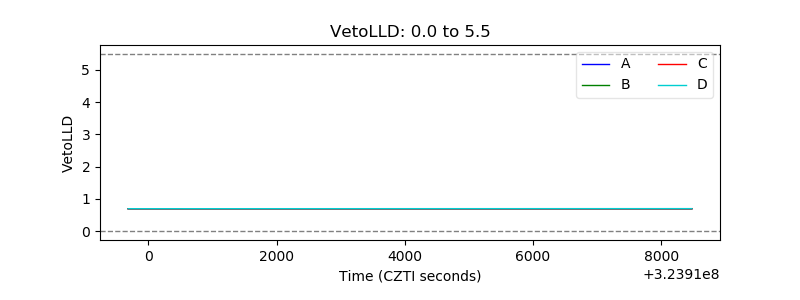 |
| Alpha Counter | 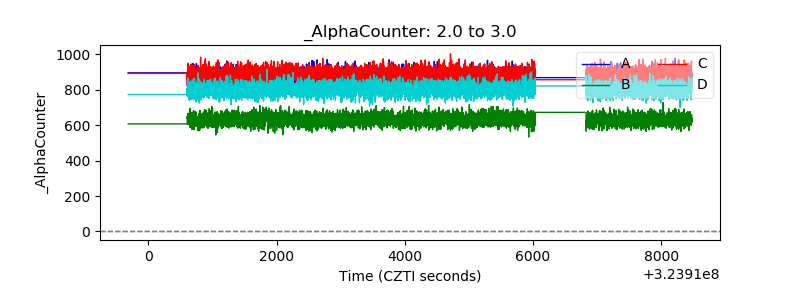 |
| _CPM_Rate |  |
| CZT Counter | 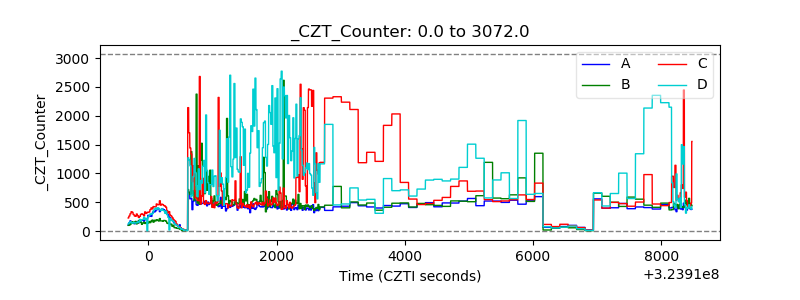 |
| +2.5 Volts monitor |  |
| +5 Volts monitor | 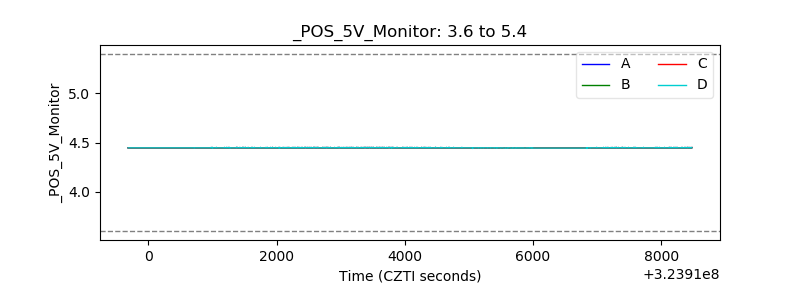 |
| _ROLL_ROT | 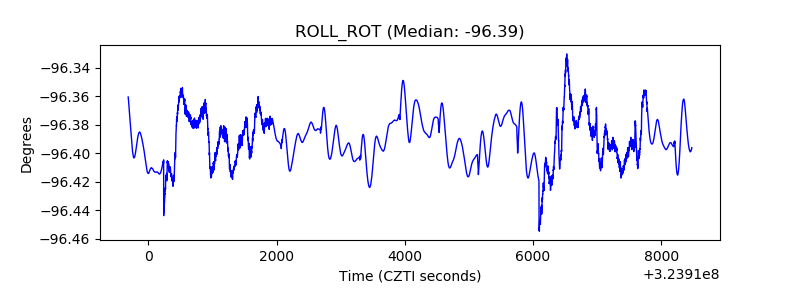 |
| _Roll_DEC | 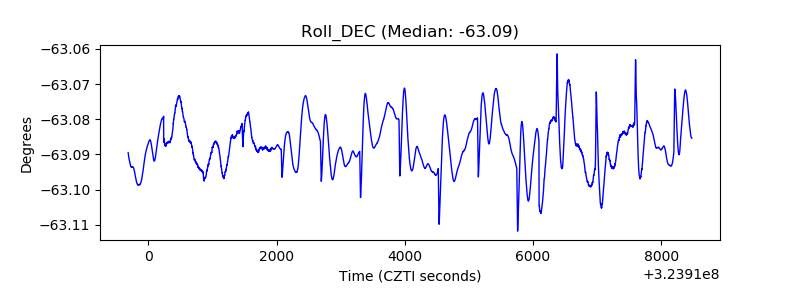 |
| _Roll_RA | 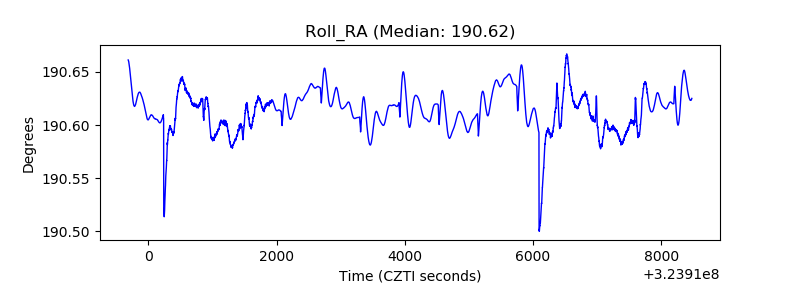 |
| Veto Counter | 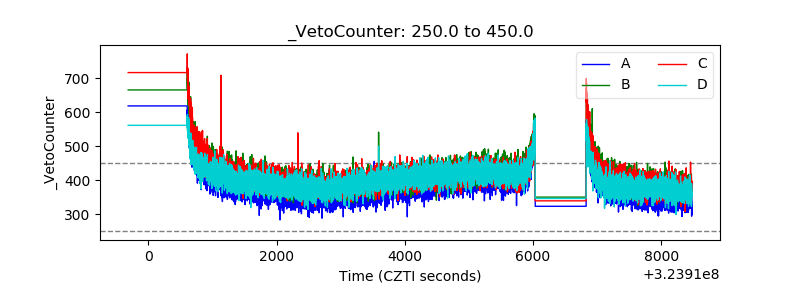 |