| Param | Original file | Final file |
|---|---|---|
| Filename | modeM0/AS1T03_183T01_9000003606_24466cztM0_level2.evt | modeM0/AS1T03_183T01_9000003606_24466cztM0_level2_quad_clean.evt |
| Size (bytes) | 608,999,040 | 119,266,560 |
| Size | 580.8 MB | 113.7 MB |
| Events in quadrant A | 3,212,805 | 808,572 |
| Events in quadrant B | 3,828,453 | 819,841 |
| Events in quadrant C | 5,262,575 | 754,892 |
| Events in quadrant D | 5,653,965 | 729,296 |
| Mode M0 | |||
|---|---|---|---|
| Quadrant | BADHDUFLAG | Total packets | Discarded packets |
| A | 0 | 14495 | 1 |
| B | 0 | 16009 | 1 |
| C | 0 | 20414 | 1 |
| D | 0 | 21743 | 1 |
| Mode SS | |||
|---|---|---|---|
| Quadrant | BADHDUFLAG | Total packets | Discarded packets |
| A | 0 | 146 | 0 |
| B | 0 | 146 | 0 |
| C | 0 | 146 | 0 |
| D | 0 | 146 | 0 |
| Mode M9 | |||
|---|---|---|---|
| Quadrant | BADHDUFLAG | Total packets | Discarded packets |
| A | 0 | 4 | 0 |
| B | 0 | 4 | 0 |
| C | 0 | 4 | 0 |
| D | 0 | 4 | 0 |
| Quadrant | Total seconds | Saturated seconds | Saturation percentage |
|---|---|---|---|
| A | 7165 | 25 | 0.348918% |
| B | 7165 | 141 | 1.967900% |
| C | 7165 | 503 | 7.020237% |
| D | 7166 | 556 | 7.758861% |
Noise dominated data is calculated using 1-second bins in cleaned event files. If a bin has >2000 counts, and if more than 50% of those come from <1% of pixels, then it is considered to be noise-dominated and hence unusable.
| Quadrant | # 1 sec bins | Bins with >0 counts | Bins with >2000 counts | High rate bins dominated by noise | Noise dominated (total time) | Noise dominated (detector-on time) | Marked lightcurve |
|---|---|---|---|---|---|---|---|
| A | 7575 | 7166 | 0 | 0 | 0.00% | 0.00% | 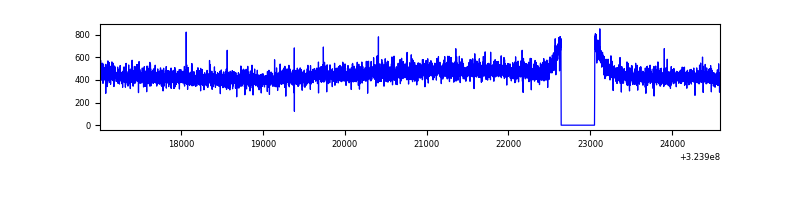 |
| B | 7575 | 7166 | 40 | 40 | 0.53% | 0.56% | 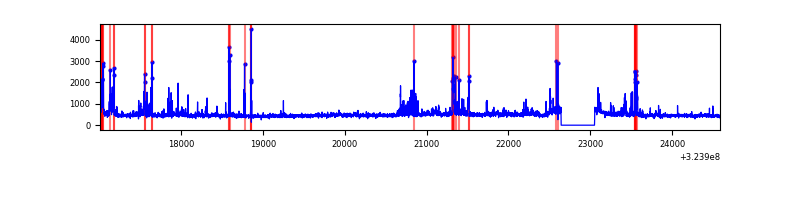 |
| C | 7575 | 7166 | 272 | 272 | 3.59% | 3.80% | 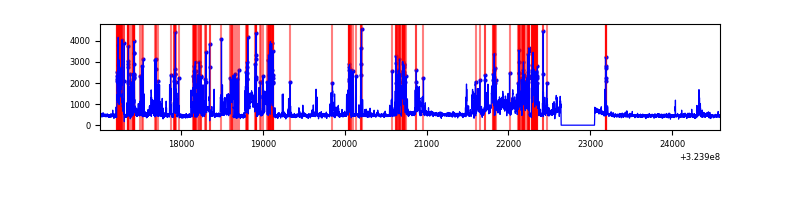 |
| D | 7576 | 7167 | 533 | 533 | 7.04% | 7.44% | 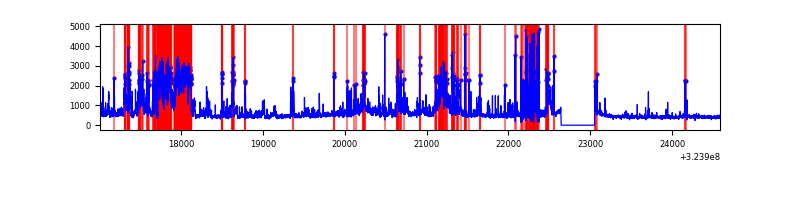 |
Top three noisy pixels from each quadrant. If the there are fewer than three noisy pixels in the level2.evt file, extra rows are filled as -1
| Pixel properties | Quadrant properties | ||||||
|---|---|---|---|---|---|---|---|
| Quadrant | DetID | PixID | Counts | Sigma | Mean | Median | Sigma |
| A | 13 | 254 | 11302 | 63.41 | 832 | 814 | 165.4 |
| A | 3 | 137 | 7551 | 40.73 | 832 | 814 | 165.4 |
| A | 0 | 226 | 7131 | 38.19 | 832 | 814 | 165.4 |
| B | 3 | 64 | 473809 | 2973.87 | 835 | 812 | 159.1 |
| B | 7 | 202 | 67036 | 416.37 | 835 | 812 | 159.1 |
| B | 12 | 111 | 19276 | 116.09 | 835 | 812 | 159.1 |
| C | 2 | 16 | 2023081 | 10991.33 | 789 | 792 | 184.0 |
| C | 14 | 238 | 126358 | 682.46 | 789 | 792 | 184.0 |
| C | 3 | 233 | 15453 | 79.68 | 789 | 792 | 184.0 |
| D | 12 | 218 | 2038126 | 10789.11 | 784 | 760 | 188.8 |
| D | 1 | 52 | 431796 | 2282.6 | 784 | 760 | 188.8 |
| D | 7 | 238 | 147137 | 775.16 | 784 | 760 | 188.8 |
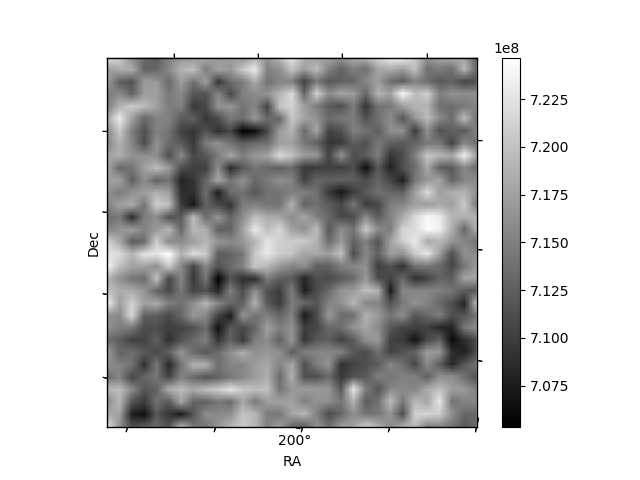
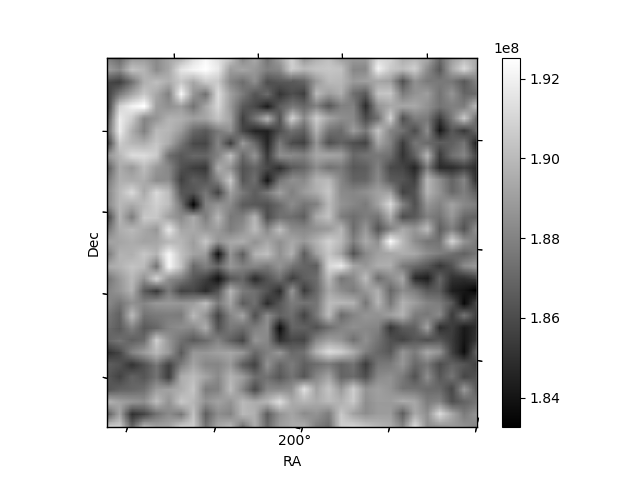
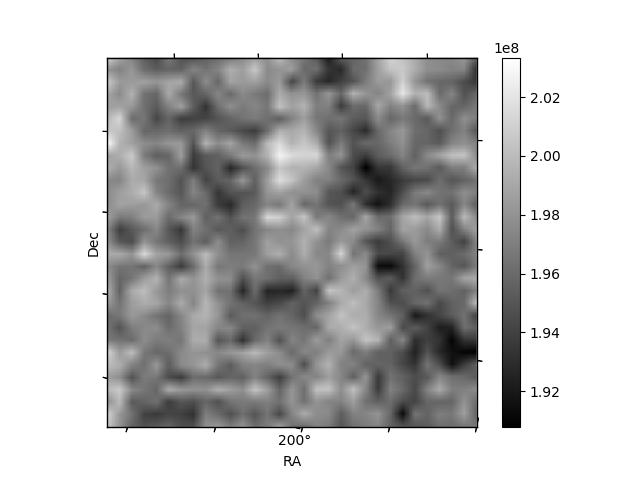
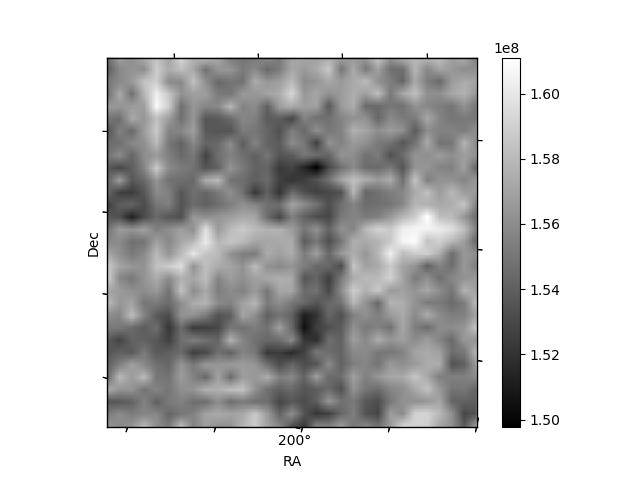
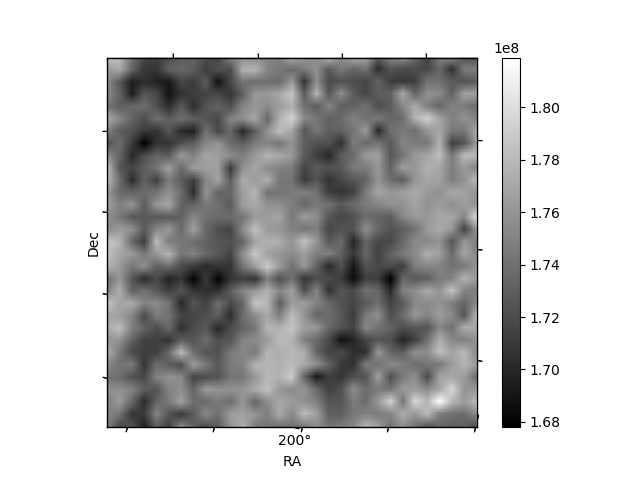
Histogram calculated using DETX and DETY for each event in the final _common_clean file
| Quadrant A | 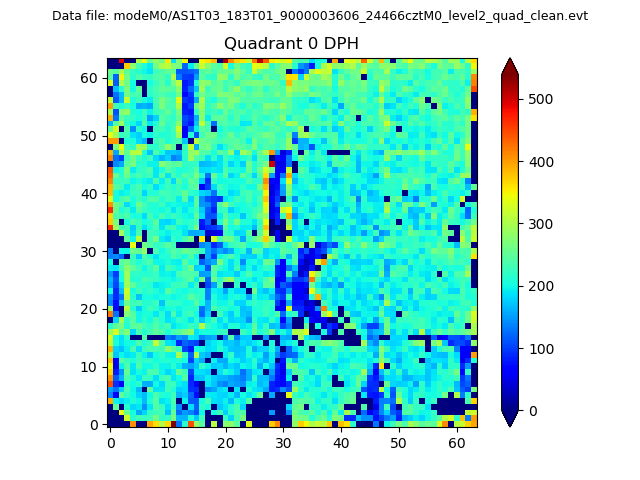 |
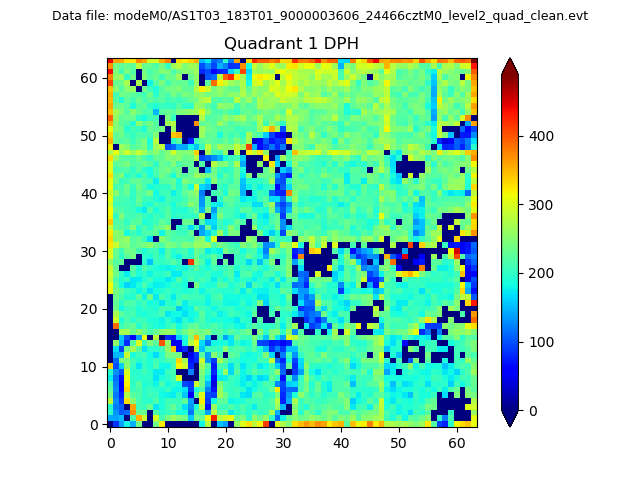 |
Quadrant B |
|---|---|---|---|
| Quadrant D | 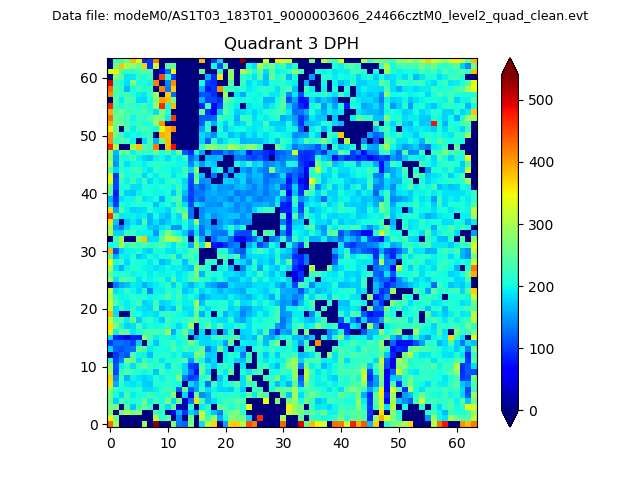 |
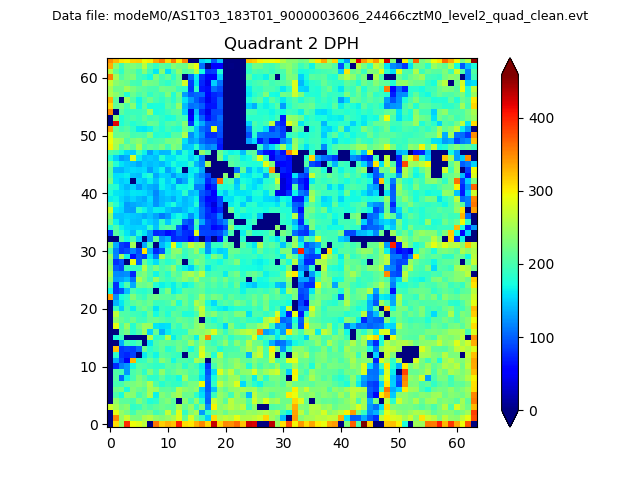 |
Quadrant C |
| Plot type | Count rate plots | Images |
|---|---|---|
| Comparison with Poisson distribution Blue bars denote a histogram of data divided into 1 sec bins. Red curve is a Poisson curve with rate = median count rate of data. |
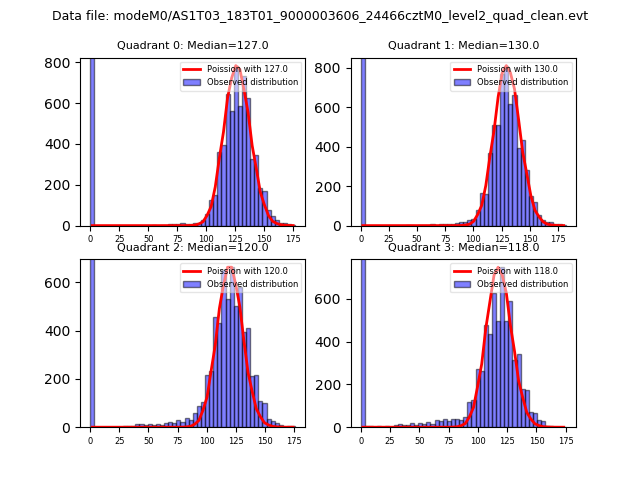 |
 |
| Quadrant-wise count rates Data is divided into 100 sec bins |
 |
|
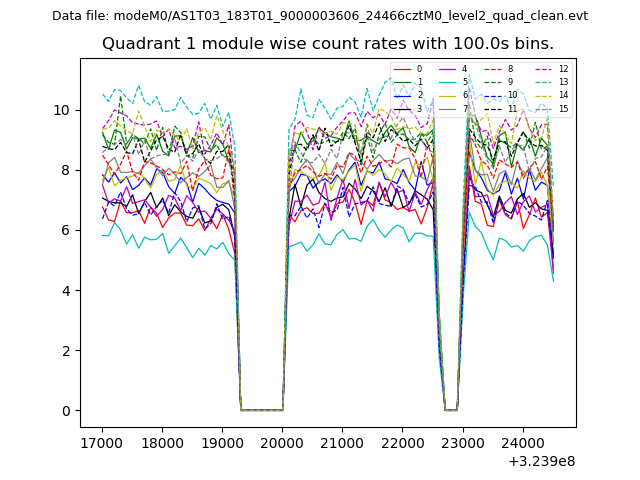
| Module-wise count rates for Quadrant A Data is divided into 100 sec bins |
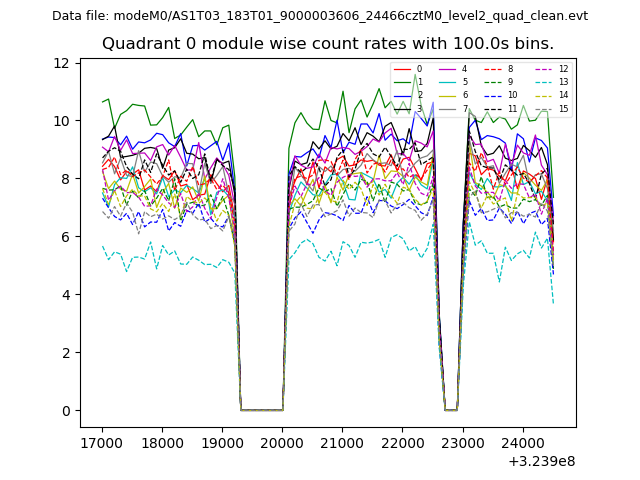 |
 |
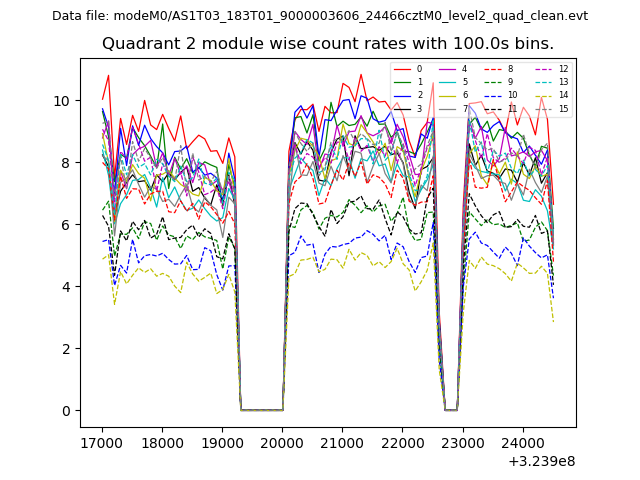
| Module-wise count rates for Quadrant B Data is divided into 100 sec bins |
 |
 |
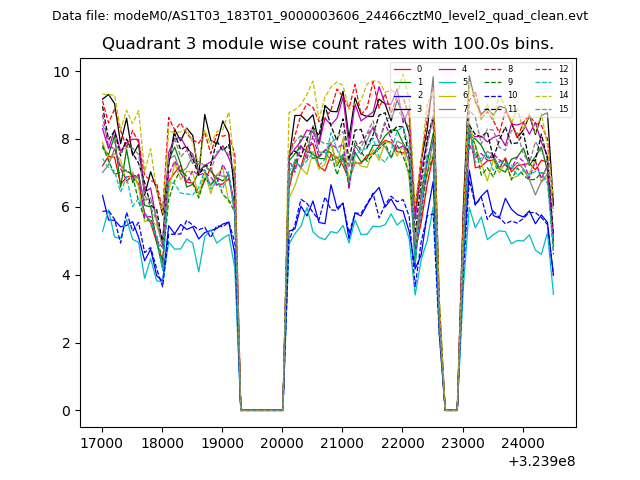
| Module-wise count rates for Quadrant C Data is divided into 100 sec bins |
 |
 |
| Module-wise count rates for Quadrant D Data is divided into 100 sec bins |
 |
 |
| Parameter | Plot |
|---|---|
| CZT HV Monitor | 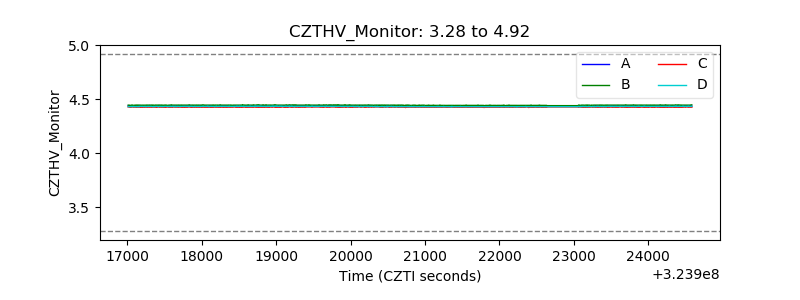 |
| D_VDD | 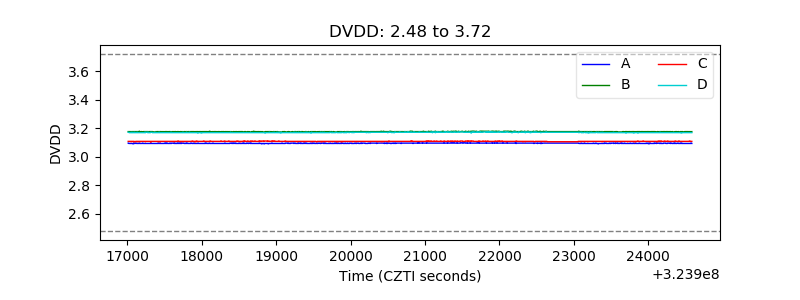 |
| Temperature 1 | 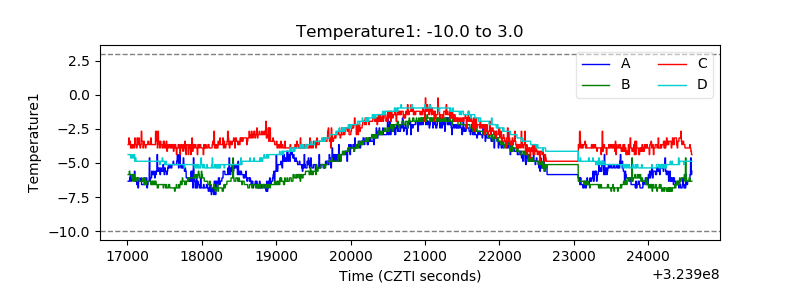 |
| Veto HV Monitor |  |
| Veto LLD |  |
| Alpha Counter |  |
| _CPM_Rate | 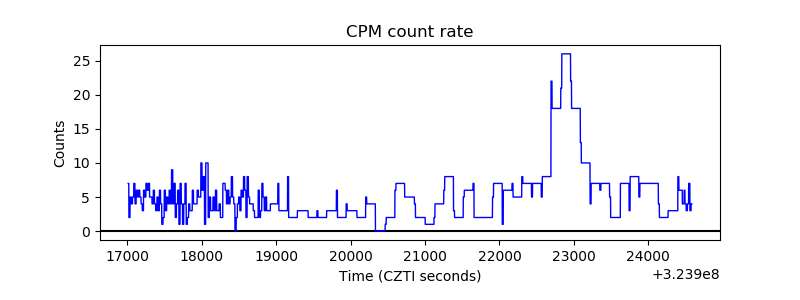 |
| CZT Counter | 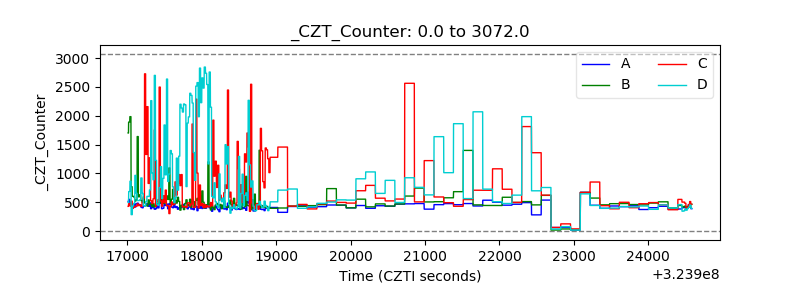 |
| +2.5 Volts monitor | 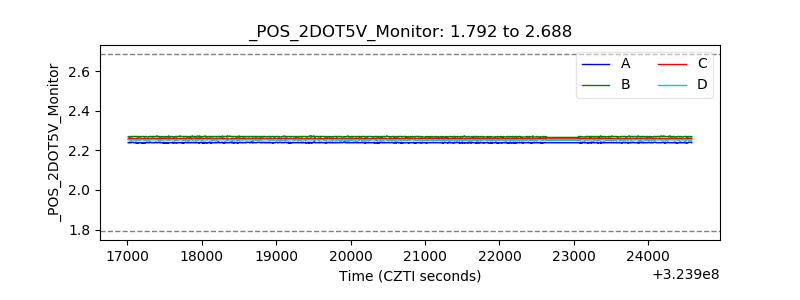 |
| +5 Volts monitor |  |
| _ROLL_ROT | 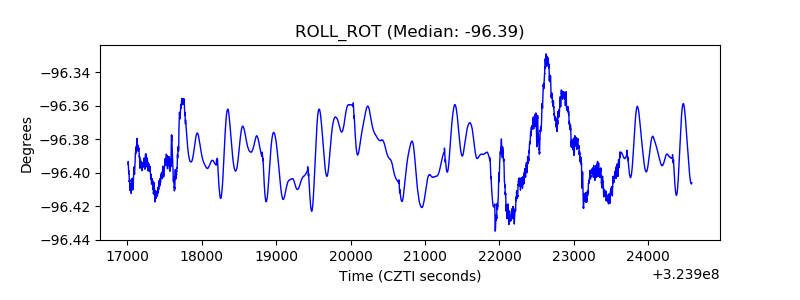 |
| _Roll_DEC | 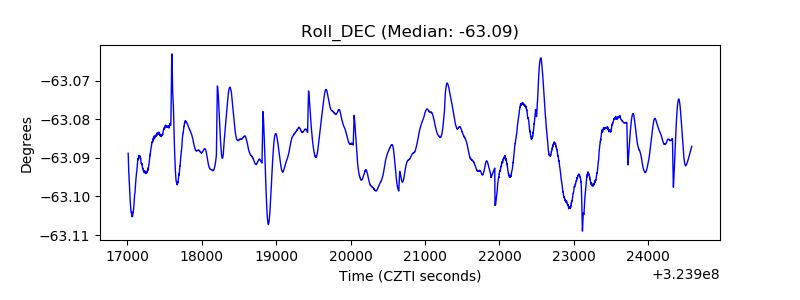 |
| _Roll_RA | 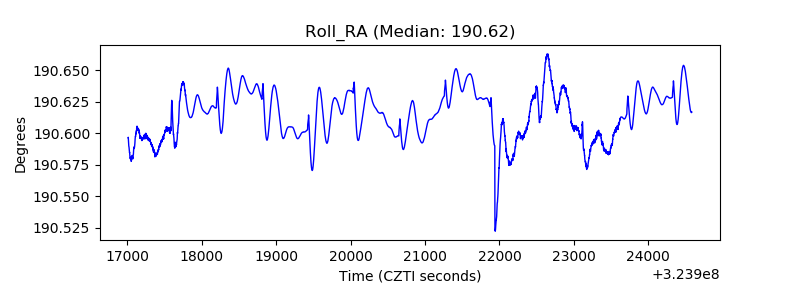 |
| Veto Counter | 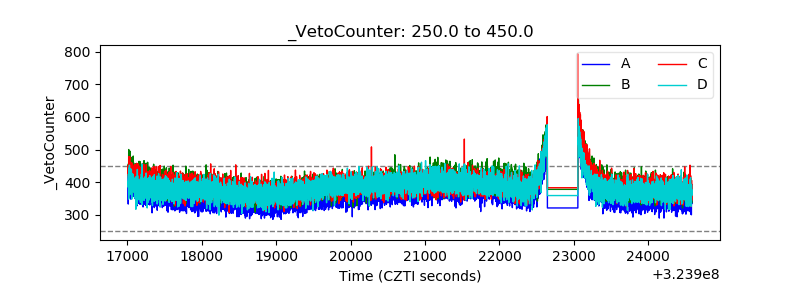 |