| Param | Original file | Final file |
|---|---|---|
| Filename | modeM0/AS1T03_183T01_9000003606_24467cztM0_level2.evt | modeM0/AS1T03_183T01_9000003606_24467cztM0_level2_quad_clean.evt |
| Size (bytes) | 530,000,640 | 131,607,360 |
| Size | 505.4 MB | 125.5 MB |
| Events in quadrant A | 3,577,575 | 883,032 |
| Events in quadrant B | 4,102,039 | 891,325 |
| Events in quadrant C | 4,049,597 | 844,052 |
| Events in quadrant D | 3,794,968 | 828,083 |
| Mode M0 | |||
|---|---|---|---|
| Quadrant | BADHDUFLAG | Total packets | Discarded packets |
| A | 0 | 15981 | 2 |
| B | 0 | 17188 | 2 |
| C | 0 | 17103 | 2 |
| D | 0 | 16670 | 2 |
| Mode SS | |||
|---|---|---|---|
| Quadrant | BADHDUFLAG | Total packets | Discarded packets |
| A | 0 | 160 | 0 |
| B | 0 | 160 | 0 |
| C | 0 | 160 | 0 |
| D | 0 | 160 | 0 |
| Mode M9 | |||
|---|---|---|---|
| Quadrant | BADHDUFLAG | Total packets | Discarded packets |
| A | 0 | 5 | 0 |
| B | 0 | 5 | 0 |
| C | 0 | 5 | 0 |
| D | 0 | 5 | 0 |
| Quadrant | Total seconds | Saturated seconds | Saturation percentage |
|---|---|---|---|
| A | 7749 | 171 | 2.206736% |
| B | 7749 | 328 | 4.232804% |
| C | 7749 | 341 | 4.400568% |
| D | 7749 | 214 | 2.761647% |
Noise dominated data is calculated using 1-second bins in cleaned event files. If a bin has >2000 counts, and if more than 50% of those come from <1% of pixels, then it is considered to be noise-dominated and hence unusable.
| Quadrant | # 1 sec bins | Bins with >0 counts | Bins with >2000 counts | High rate bins dominated by noise | Noise dominated (total time) | Noise dominated (detector-on time) | Marked lightcurve |
|---|---|---|---|---|---|---|---|
| A | 8324 | 7752 | 0 | 0 | 0.00% | 0.00% | 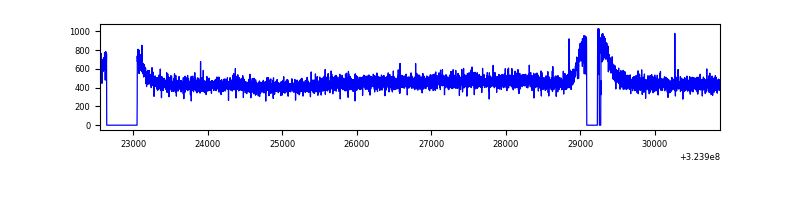 |
| B | 8324 | 7752 | 55 | 55 | 0.66% | 0.71% | 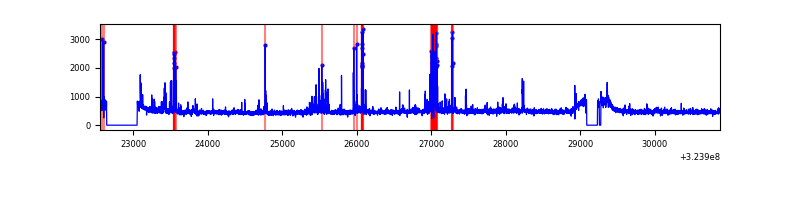 |
| C | 8324 | 7752 | 32 | 32 | 0.38% | 0.41% | 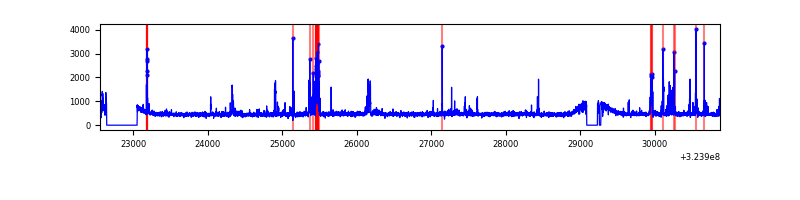 |
| D | 8324 | 7752 | 45 | 45 | 0.54% | 0.58% | 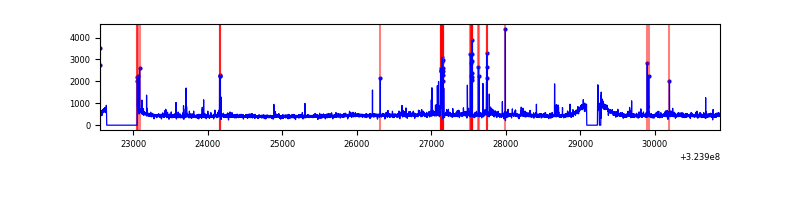 |
Top three noisy pixels from each quadrant. If the there are fewer than three noisy pixels in the level2.evt file, extra rows are filled as -1
| Pixel properties | Quadrant properties | ||||||
|---|---|---|---|---|---|---|---|
| Quadrant | DetID | PixID | Counts | Sigma | Mean | Median | Sigma |
| A | 13 | 254 | 12303 | 61.1 | 927 | 905 | 186.5 |
| A | 3 | 137 | 8671 | 41.63 | 927 | 905 | 186.5 |
| A | 0 | 226 | 8064 | 38.38 | 927 | 905 | 186.5 |
| B | 3 | 64 | 412102 | 2330.46 | 924 | 896 | 176.4 |
| B | 7 | 202 | 39298 | 217.64 | 924 | 896 | 176.4 |
| B | 12 | 111 | 22130 | 120.34 | 924 | 896 | 176.4 |
| C | 2 | 16 | 414582 | 1992.93 | 890 | 895 | 207.6 |
| C | 14 | 238 | 141150 | 675.67 | 890 | 895 | 207.6 |
| C | 7 | 247 | 16347 | 74.44 | 890 | 895 | 207.6 |
| D | 12 | 218 | 152899 | 702.49 | 898 | 869 | 216.4 |
| D | 8 | 195 | 88906 | 406.8 | 898 | 869 | 216.4 |
| D | 10 | 199 | 73684 | 336.46 | 898 | 869 | 216.4 |
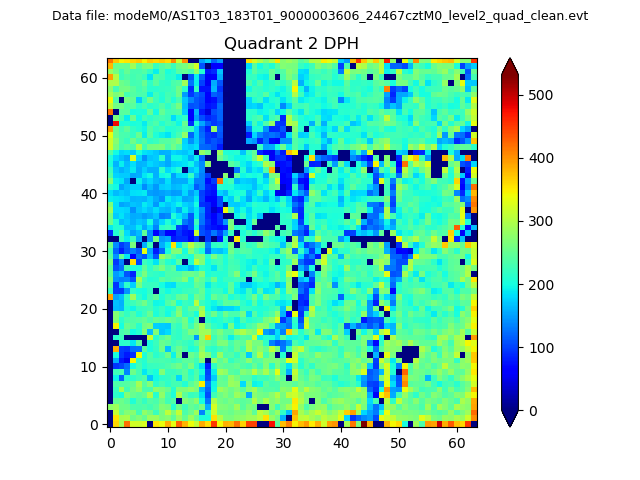
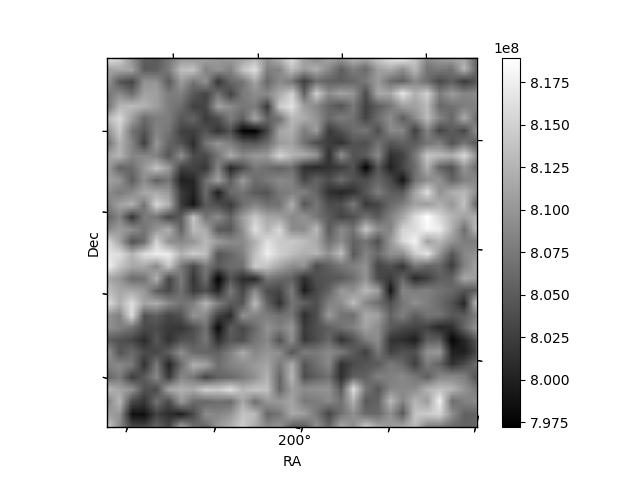
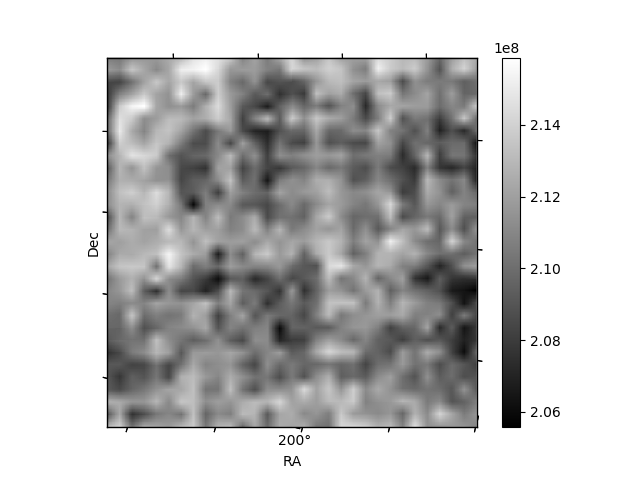
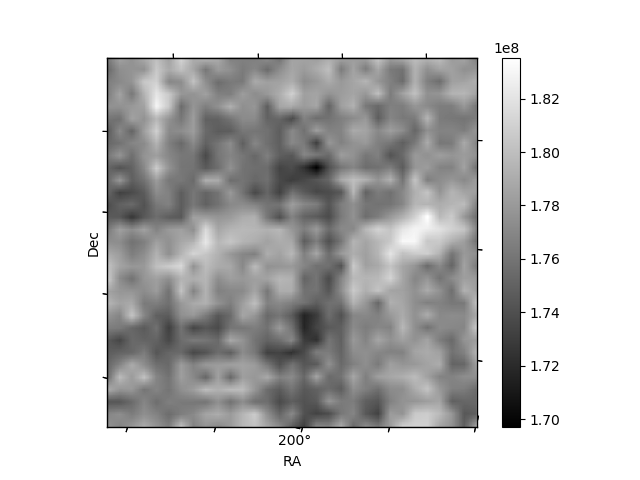
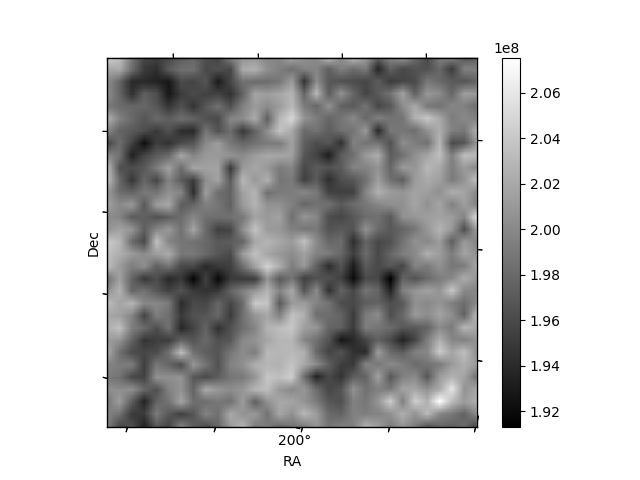
Histogram calculated using DETX and DETY for each event in the final _common_clean file
| Quadrant A | 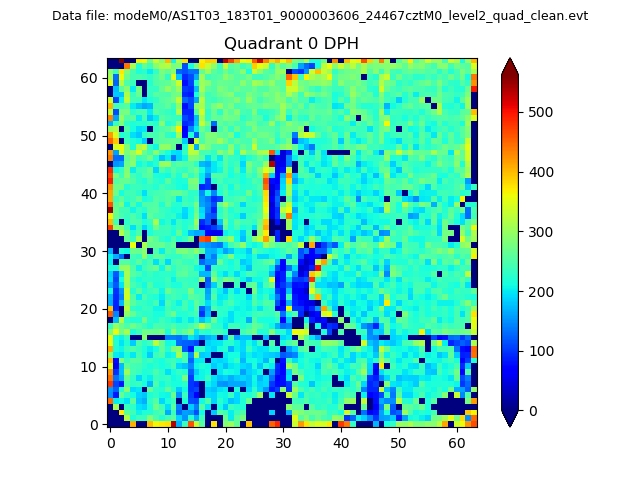 |
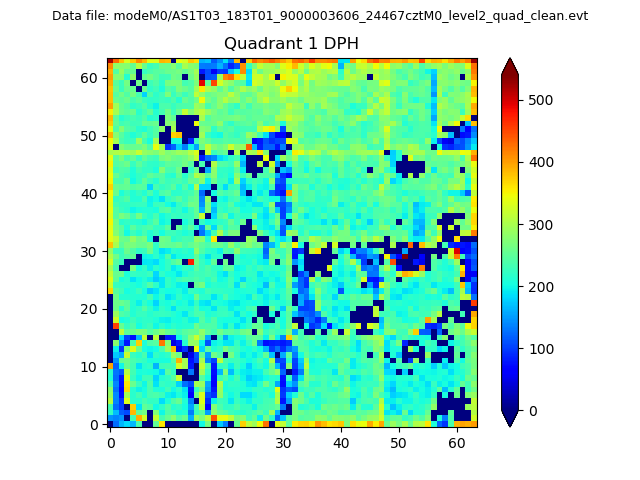 |
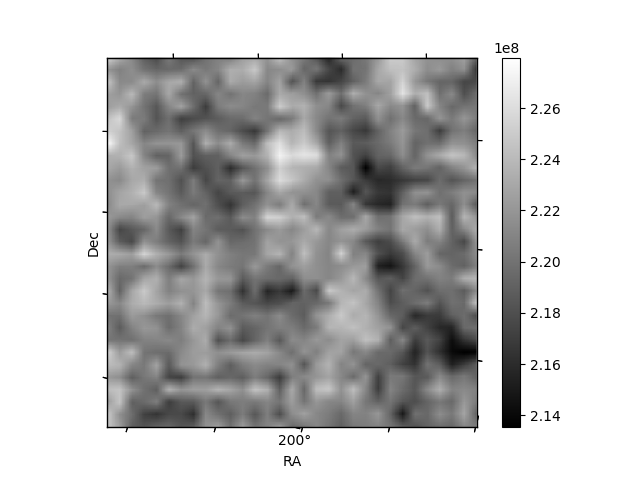
Quadrant B |
|---|---|---|---|
| Quadrant D | 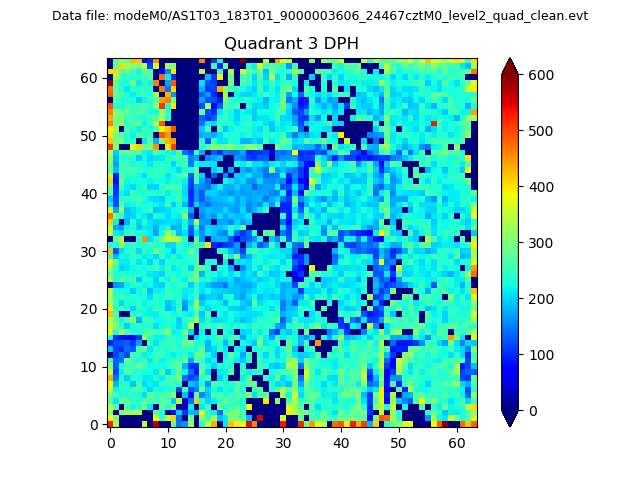 |
 |
Quadrant C |
| Plot type | Count rate plots | Images |
|---|---|---|
| Comparison with Poisson distribution Blue bars denote a histogram of data divided into 1 sec bins. Red curve is a Poisson curve with rate = median count rate of data. |
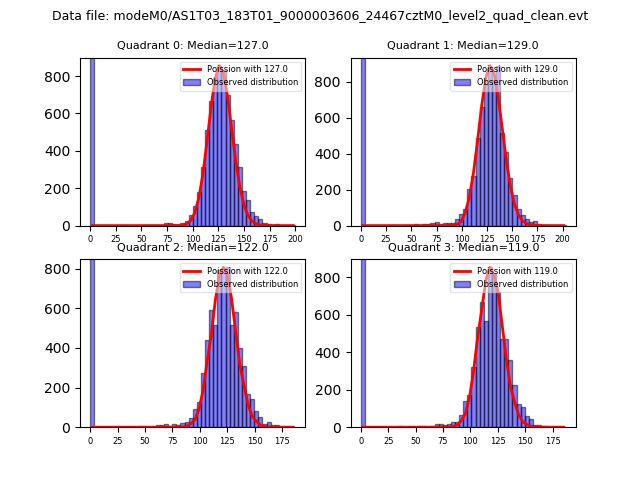 |
 |
| Quadrant-wise count rates Data is divided into 100 sec bins |
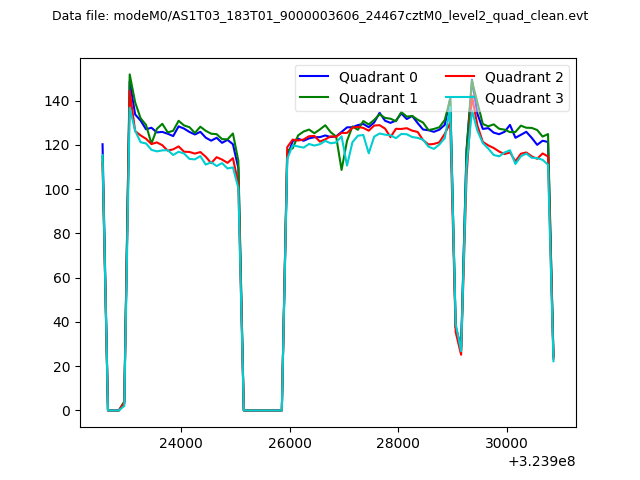 |
|
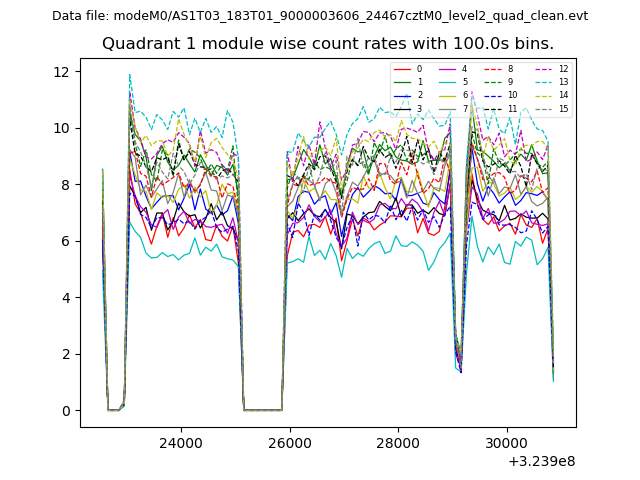
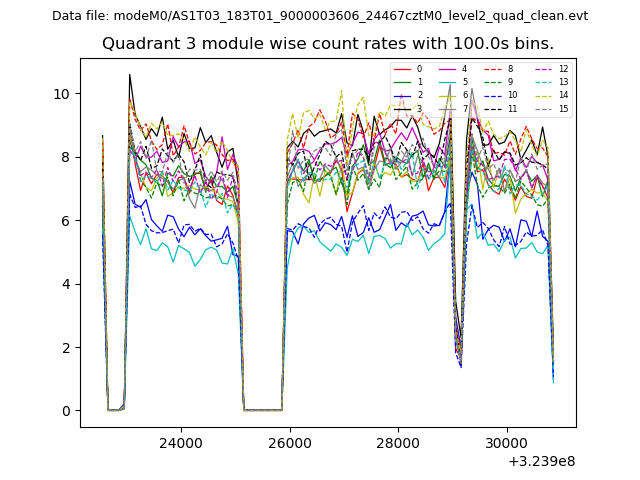
| Module-wise count rates for Quadrant A Data is divided into 100 sec bins |
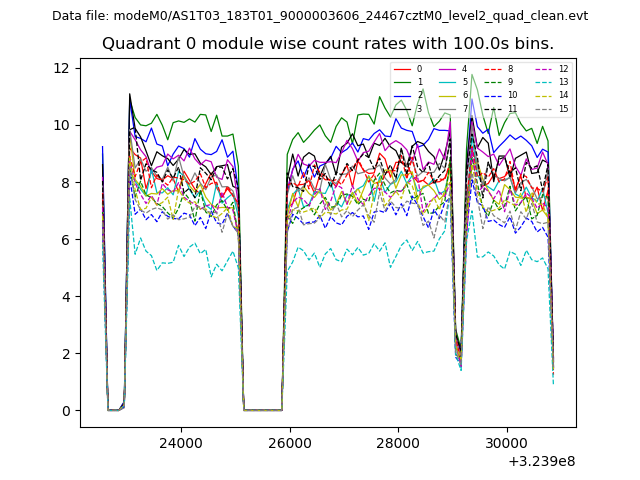 |
 |
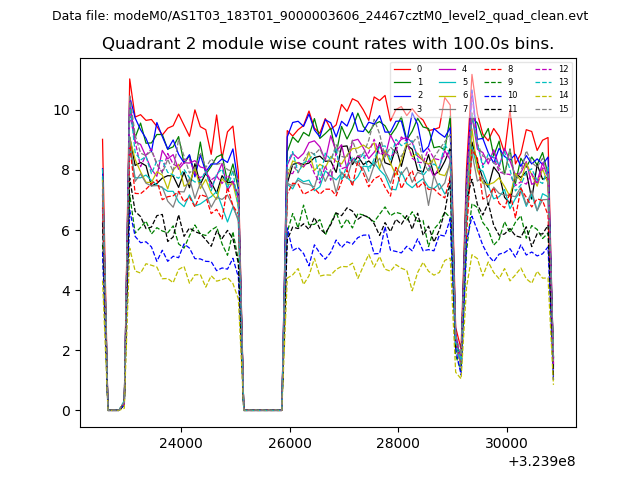
| Module-wise count rates for Quadrant B Data is divided into 100 sec bins |
 |
 |
| Module-wise count rates for Quadrant C Data is divided into 100 sec bins |
 |
 |
| Module-wise count rates for Quadrant D Data is divided into 100 sec bins |
 |
 |
| Parameter | Plot |
|---|---|
| CZT HV Monitor | 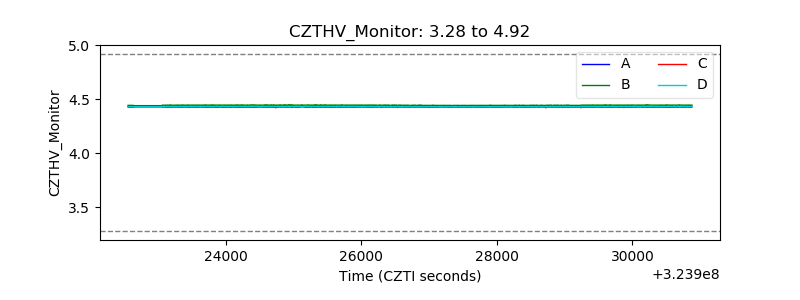 |
| D_VDD | 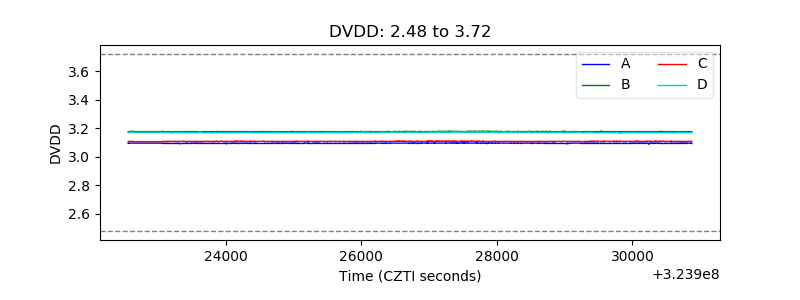 |
| Temperature 1 | 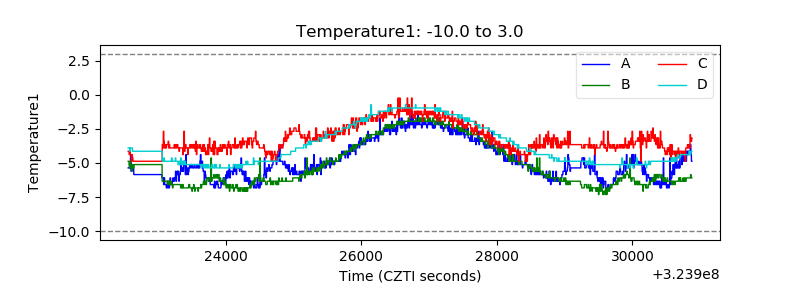 |
| Veto HV Monitor | 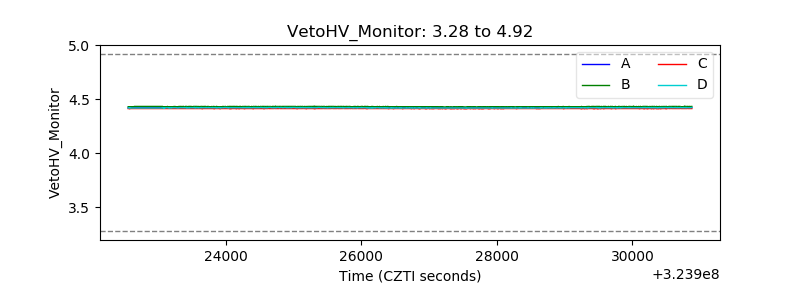 |
| Veto LLD | 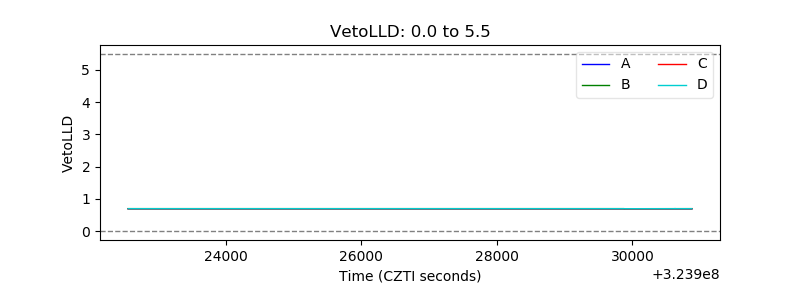 |
| Alpha Counter | 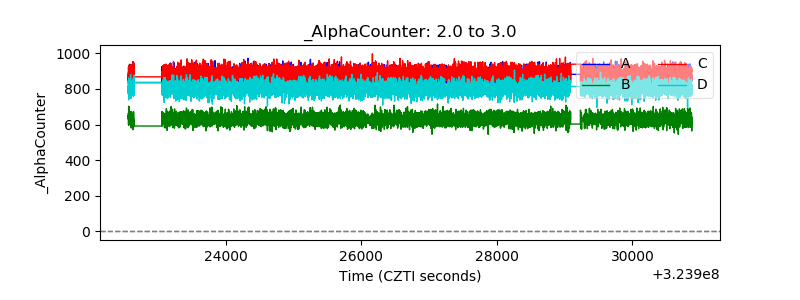 |
| _CPM_Rate | 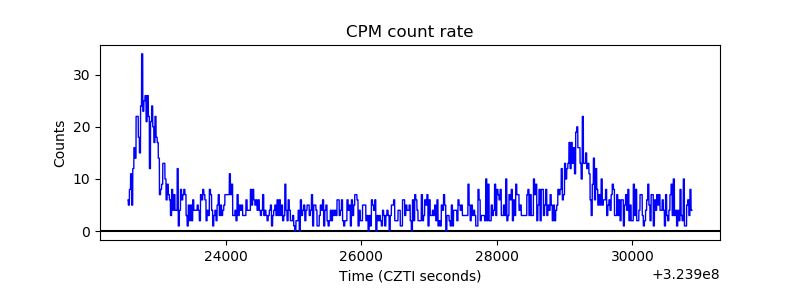 |
| CZT Counter | 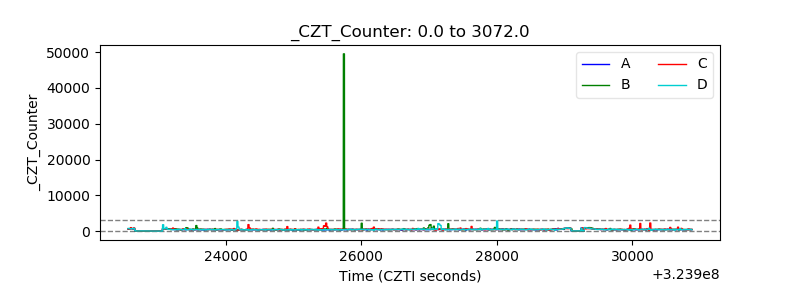 |
| +2.5 Volts monitor |  |
| +5 Volts monitor |  |
| _ROLL_ROT | 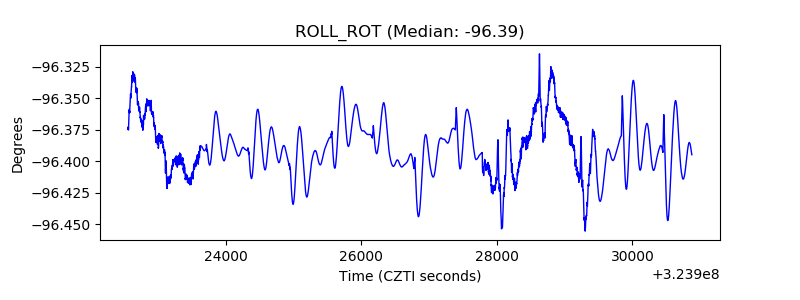 |
| _Roll_DEC | 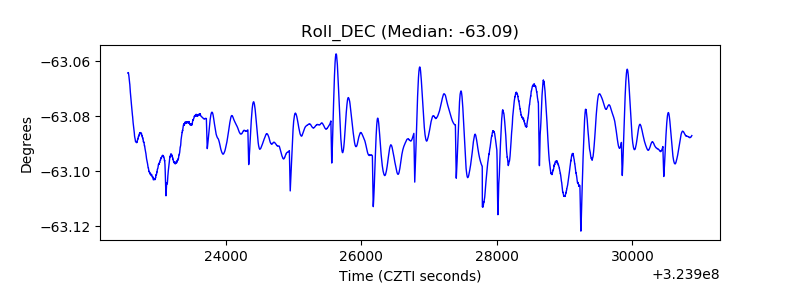 |
| _Roll_RA | 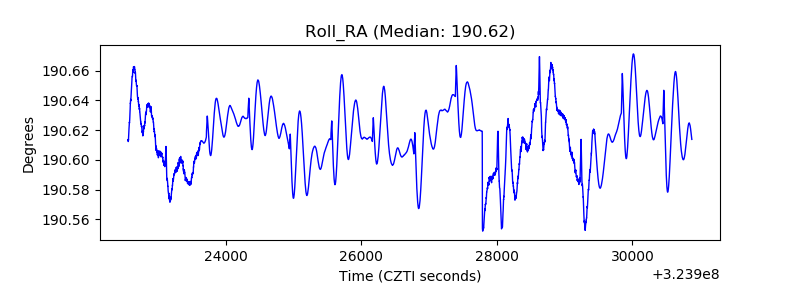 |
| Veto Counter | 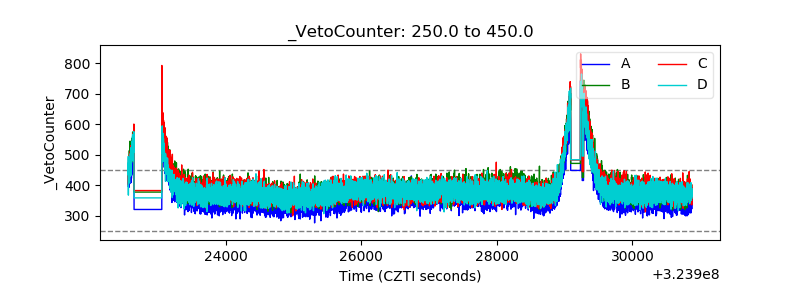 |