| Param | Original file | Final file |
|---|---|---|
| Filename | modeM0/AS1T03_183T01_9000003606_24468cztM0_level2.fits | modeM0/AS1T03_183T01_9000003606_24468cztM0_level2_quad_clean.evt |
| Size (bytes) | 456,462,720 | 132,963,840 |
| Size | 435.3 MB | 126.8 MB |
| Events in quadrant A | 3,701,151 | 897,975 |
| Events in quadrant B | 3,864,754 | 920,834 |
| Events in quadrant C | 4,292,980 | 854,279 |
| Events in quadrant D | 4,423,549 | 803,469 |
| Mode M0 | |||
|---|---|---|---|
| Quadrant | BADHDUFLAG | Total packets | Discarded packets |
| A | 0 | 16379 | 2 |
| B | 0 | 16520 | 2 |
| C | 0 | 17816 | 2 |
| D | 0 | 18472 | 2 |
| Mode SS | |||
|---|---|---|---|
| Quadrant | BADHDUFLAG | Total packets | Discarded packets |
| A | 0 | 164 | 0 |
| B | 0 | 164 | 0 |
| C | 0 | 164 | 0 |
| D | 0 | 164 | 0 |
| Mode M9 | |||
|---|---|---|---|
| Quadrant | BADHDUFLAG | Total packets | Discarded packets |
| A | 0 | 5 | 0 |
| B | 0 | 5 | 0 |
| C | 0 | 5 | 0 |
| D | 0 | 5 | 0 |
| Quadrant | Total seconds | Saturated seconds | Saturation percentage |
|---|---|---|---|
| A | 7893 | 241 | 3.053338% |
| B | 7894 | 295 | 3.737015% |
| C | 7894 | 443 | 5.611857% |
| D | 7894 | 247 | 3.128959% |
Noise dominated data is calculated using 1-second bins in cleaned event files. If a bin has >2000 counts, and if more than 50% of those come from <1% of pixels, then it is considered to be noise-dominated and hence unusable.
| Quadrant | # 1 sec bins | Bins with >0 counts | Bins with >2000 counts | High rate bins dominated by noise | Noise dominated (total time) | Noise dominated (detector-on time) | Marked lightcurve |
|---|---|---|---|---|---|---|---|
| A | 8423 | 7896 | 0 | 0 | 0.00% | 0.00% | 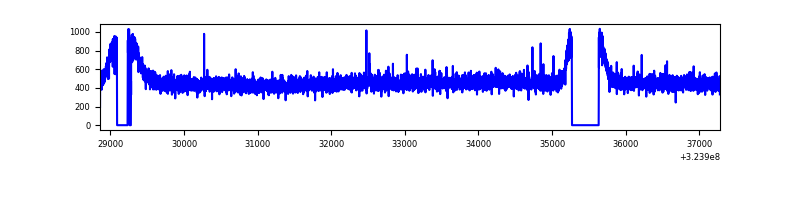 |
| B | 8424 | 7897 | 1 | 1 | 0.01% | 0.01% | 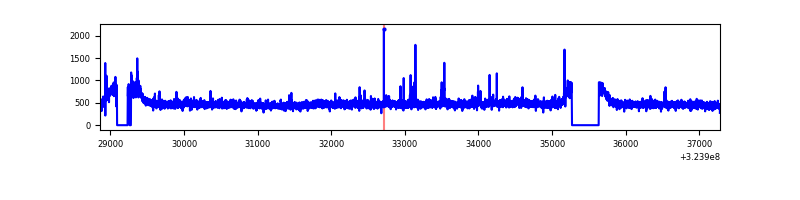 |
| C | 8424 | 7897 | 80 | 80 | 0.95% | 1.01% | 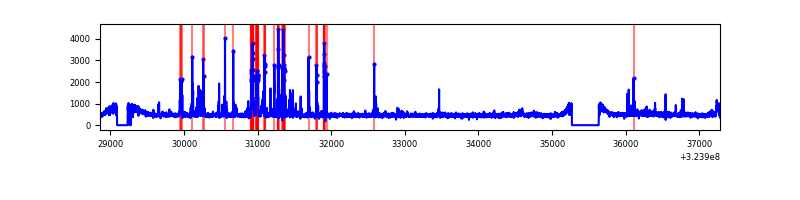 |
| D | 8424 | 7897 | 17 | 17 | 0.20% | 0.22% | 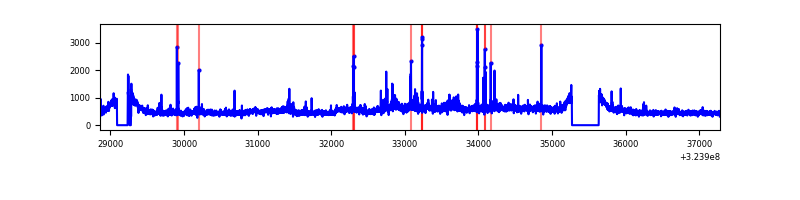 |
Top three noisy pixels from each quadrant. If the there are fewer than three noisy pixels in the level2.evt file, extra rows are filled as -1
| Pixel properties | Quadrant properties | ||||||
|---|---|---|---|---|---|---|---|
| Quadrant | DetID | PixID | Counts | Sigma | Mean | Median | Sigma |
| A | 13 | 254 | 12788 | 61.08 | 958 | 936 | 194.0 |
| A | 3 | 137 | 9006 | 41.59 | 958 | 936 | 194.0 |
| A | 0 | 226 | 8180 | 37.33 | 958 | 936 | 194.0 |
| B | 3 | 64 | 49482 | 263.99 | 955 | 928 | 183.9 |
| B | 7 | 202 | 44796 | 238.51 | 955 | 928 | 183.9 |
| B | 12 | 111 | 22796 | 118.9 | 955 | 928 | 183.9 |
| C | 2 | 16 | 538798 | 2496.33 | 919 | 922 | 215.5 |
| C | 14 | 238 | 144400 | 665.89 | 919 | 922 | 215.5 |
| C | 3 | 233 | 24885 | 111.21 | 919 | 922 | 215.5 |
| D | 9 | 35 | 507399 | 2237.0 | 933 | 902 | 226.4 |
| D | 8 | 195 | 174149 | 765.16 | 933 | 902 | 226.4 |
| D | 12 | 218 | 125233 | 549.12 | 933 | 902 | 226.4 |
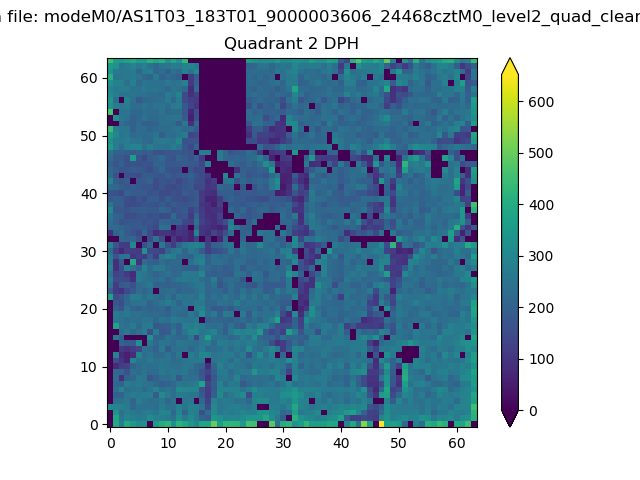
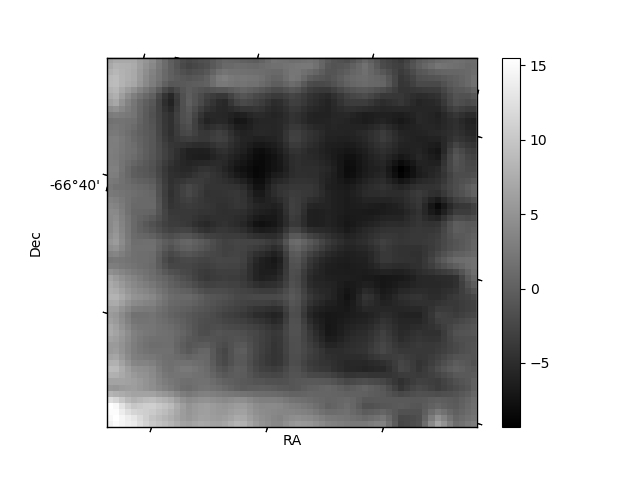
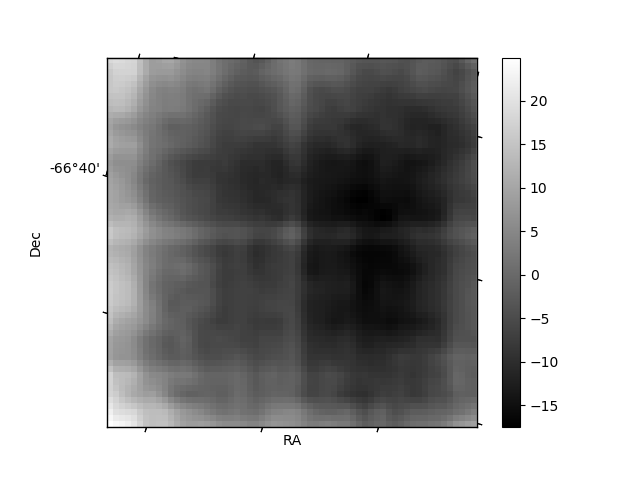
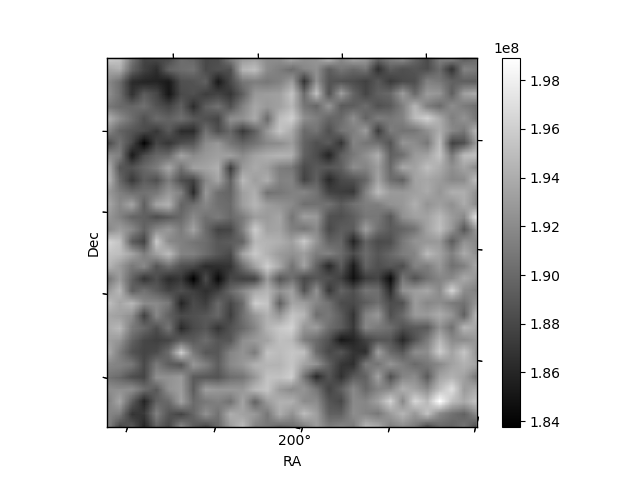
Histogram calculated using DETX and DETY for each event in the final _common_clean file
| Quadrant A | 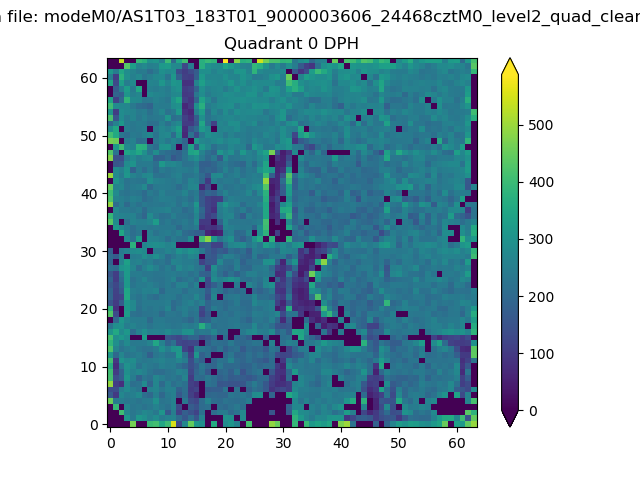 |
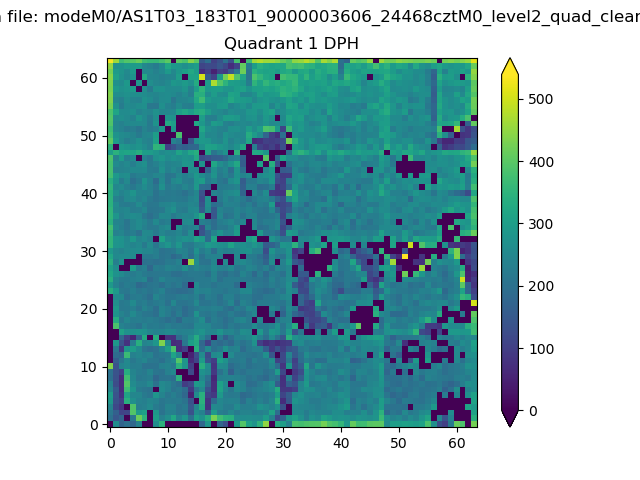 |
Quadrant B |
|---|---|---|---|
| Quadrant D | 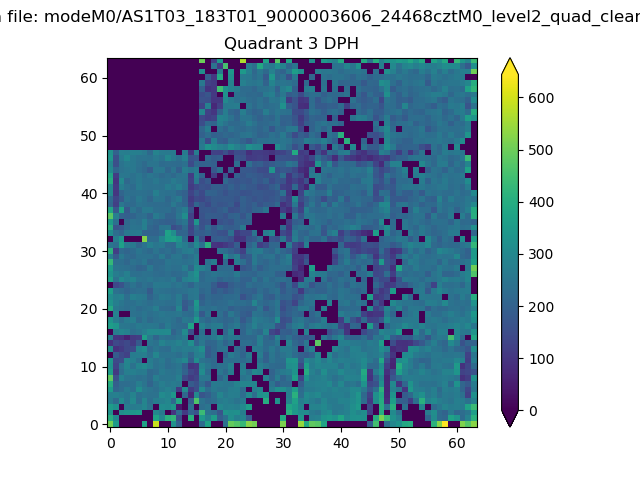 |
 |
Quadrant C |
| Plot type | Count rate plots | Images |
|---|---|---|
| Comparison with Poisson distribution Blue bars denote a histogram of data divided into 1 sec bins. Red curve is a Poisson curve with rate = median count rate of data. |
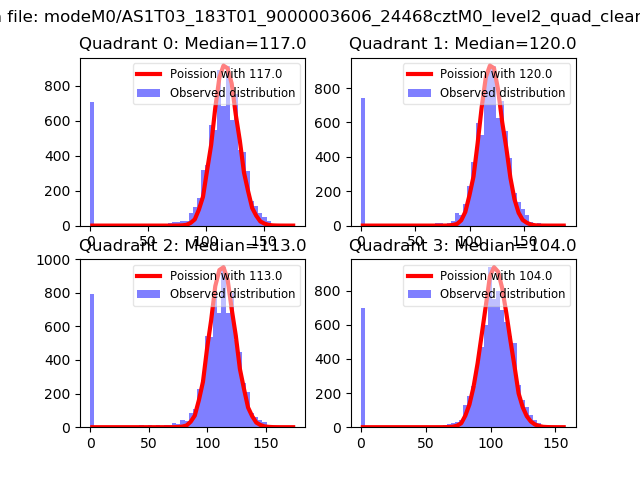 |
 |
| Quadrant-wise count rates Data is divided into 100 sec bins |
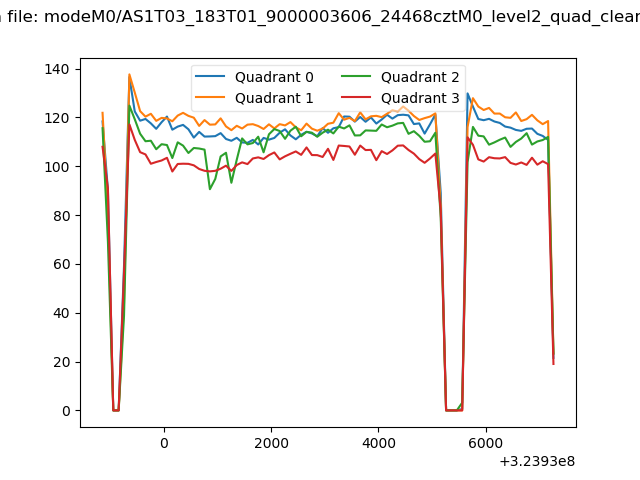 |
|
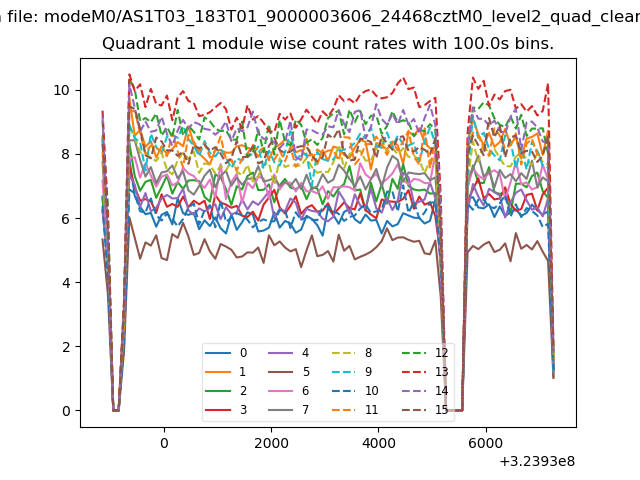
| Module-wise count rates for Quadrant A Data is divided into 100 sec bins |
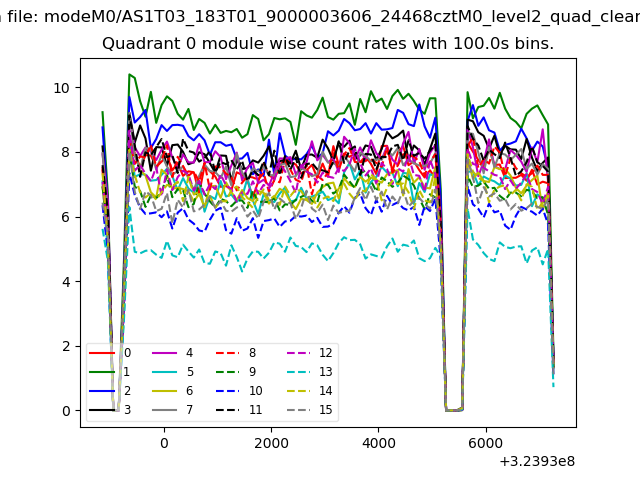 |
 |
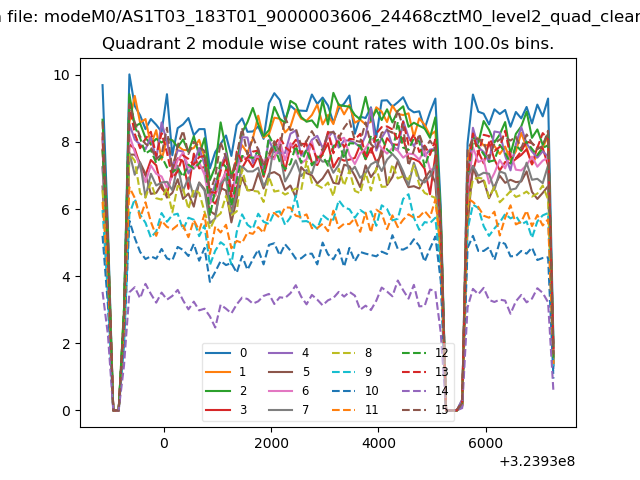
| Module-wise count rates for Quadrant B Data is divided into 100 sec bins |
 |
 |
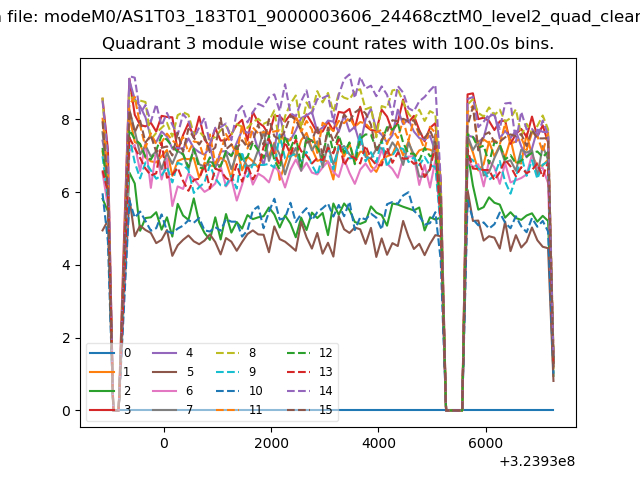
| Module-wise count rates for Quadrant C Data is divided into 100 sec bins |
 |
 |
| Module-wise count rates for Quadrant D Data is divided into 100 sec bins |
 |
 |
| Parameter | Plot |
|---|---|
| CZT HV Monitor | 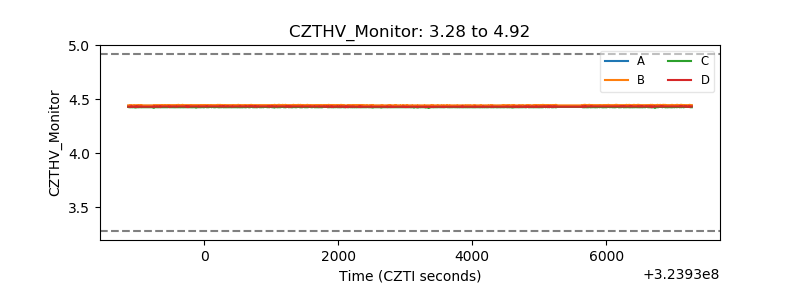 |
| D_VDD | 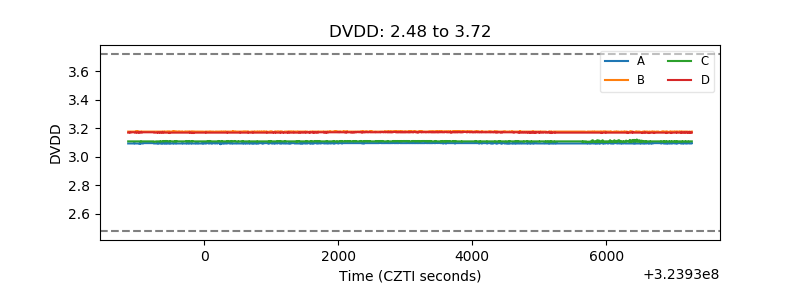 |
| Temperature 1 | 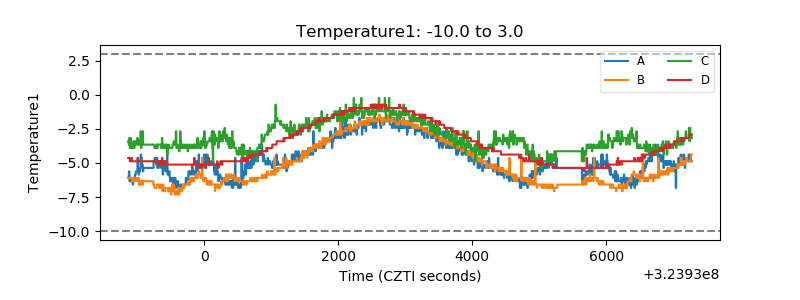 |
| Veto HV Monitor |  |
| Veto LLD | 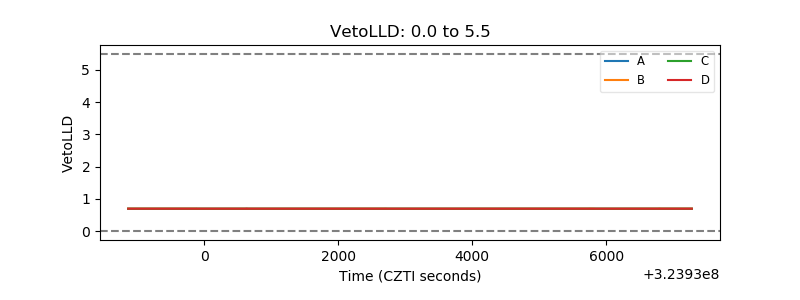 |
| Alpha Counter | 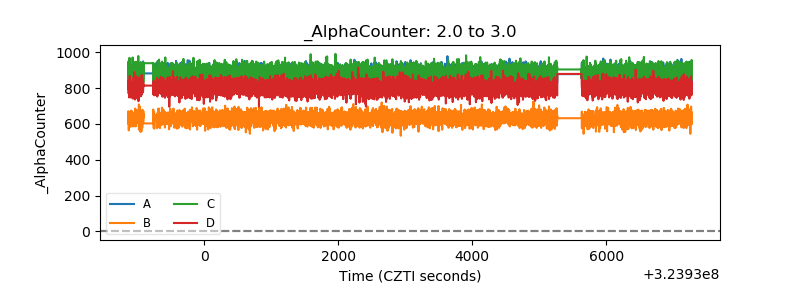 |
| _CPM_Rate | 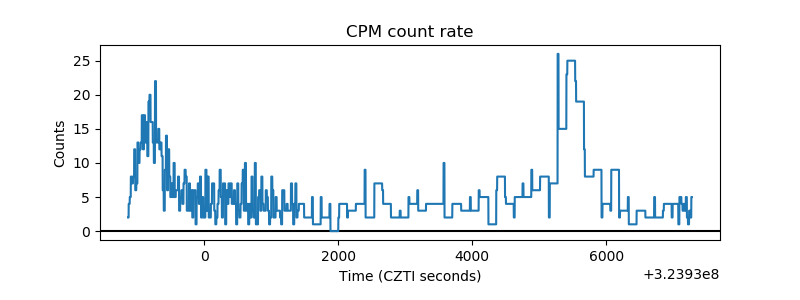 |
| CZT Counter | 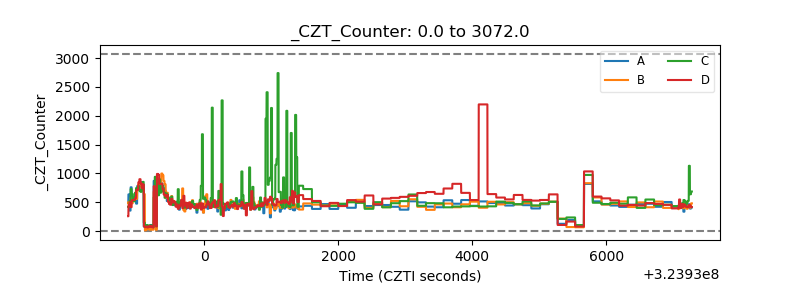 |
| +2.5 Volts monitor |  |
| +5 Volts monitor |  |
| _ROLL_ROT | 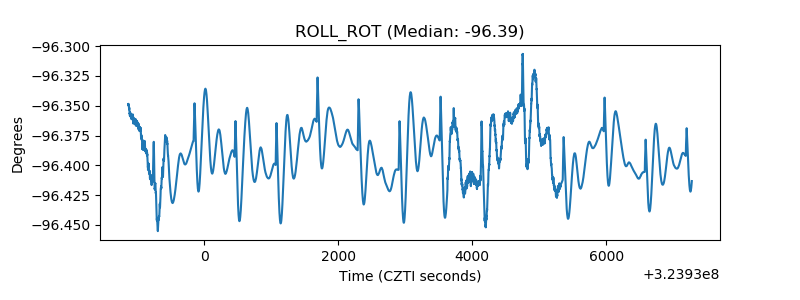 |
| _Roll_DEC | 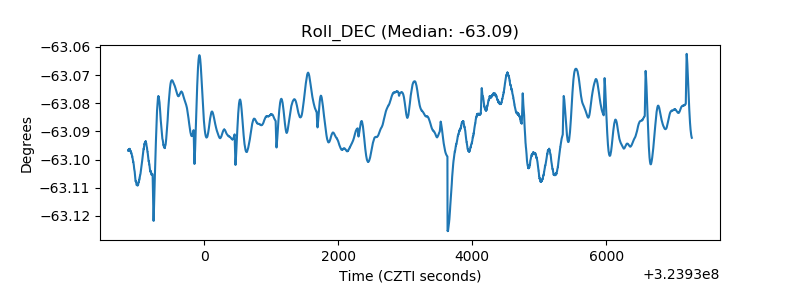 |
| _Roll_RA |  |
| Veto Counter | 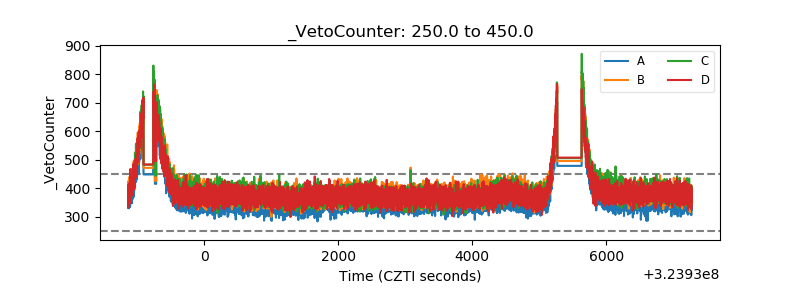 |