| Param | Original file | Final file |
|---|---|---|
| Filename | modeM0/AS1T03_183T01_9000003606_24471cztM0_level2.evt | modeM0/AS1T03_183T01_9000003606_24471cztM0_level2_quad_clean.evt |
| Size (bytes) | 524,914,560 | 113,155,200 |
| Size | 500.6 MB | 107.9 MB |
| Events in quadrant A | 3,428,761 | 735,195 |
| Events in quadrant B | 3,519,930 | 751,010 |
| Events in quadrant C | 3,848,601 | 719,518 |
| Events in quadrant D | 4,587,598 | 696,292 |
| Mode M0 | |||
|---|---|---|---|
| Quadrant | BADHDUFLAG | Total packets | Discarded packets |
| A | 0 | 15284 | 1 |
| B | 0 | 15342 | 1 |
| C | 0 | 16266 | 1 |
| D | 0 | 18687 | 1 |
| Mode SS | |||
|---|---|---|---|
| Quadrant | BADHDUFLAG | Total packets | Discarded packets |
| A | 0 | 154 | 0 |
| B | 0 | 154 | 0 |
| C | 0 | 154 | 0 |
| D | 0 | 154 | 0 |
| Mode M9 | |||
|---|---|---|---|
| Quadrant | BADHDUFLAG | Total packets | Discarded packets |
| A | 0 | 6 | 0 |
| B | 0 | 6 | 0 |
| C | 0 | 6 | 0 |
| D | 0 | 6 | 0 |
| Quadrant | Total seconds | Saturated seconds | Saturation percentage |
|---|---|---|---|
| A | 7540 | 64 | 0.848806% |
| B | 7541 | 65 | 0.861955% |
| C | 7541 | 163 | 2.161517% |
| D | 7541 | 146 | 1.936083% |
Noise dominated data is calculated using 1-second bins in cleaned event files. If a bin has >2000 counts, and if more than 50% of those come from <1% of pixels, then it is considered to be noise-dominated and hence unusable.
| Quadrant | # 1 sec bins | Bins with >0 counts | Bins with >2000 counts | High rate bins dominated by noise | Noise dominated (total time) | Noise dominated (detector-on time) | Marked lightcurve |
|---|---|---|---|---|---|---|---|
| A | 8125 | 7541 | 2 | 2 | 0.02% | 0.03% | 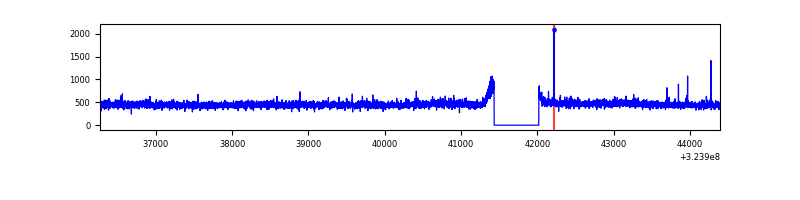 |
| B | 8126 | 7542 | 0 | 0 | 0.00% | 0.00% | 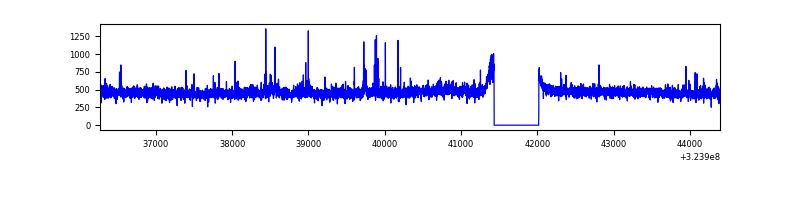 |
| C | 8126 | 7542 | 39 | 39 | 0.48% | 0.52% | 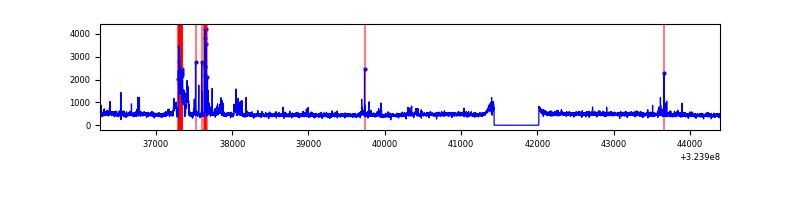 |
| D | 8126 | 7542 | 66 | 66 | 0.81% | 0.88% | 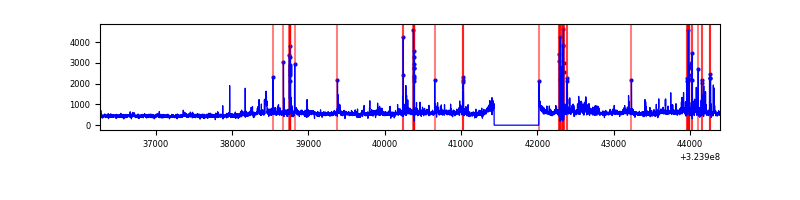 |
Top three noisy pixels from each quadrant. If the there are fewer than three noisy pixels in the level2.evt file, extra rows are filled as -1
| Pixel properties | Quadrant properties | ||||||
|---|---|---|---|---|---|---|---|
| Quadrant | DetID | PixID | Counts | Sigma | Mean | Median | Sigma |
| A | 4 | 2 | 17567 | 93.7 | 882 | 862 | 178.3 |
| A | 13 | 254 | 12177 | 63.47 | 882 | 862 | 178.3 |
| A | 3 | 137 | 8132 | 40.78 | 882 | 862 | 178.3 |
| B | 7 | 202 | 29134 | 167.37 | 879 | 854 | 169.0 |
| B | 15 | 33 | 20694 | 117.42 | 879 | 854 | 169.0 |
| B | 12 | 111 | 20641 | 117.11 | 879 | 854 | 169.0 |
| C | 2 | 16 | 353460 | 1771.11 | 852 | 855 | 199.1 |
| C | 14 | 238 | 134845 | 673.02 | 852 | 855 | 199.1 |
| C | 3 | 233 | 35511 | 174.07 | 852 | 855 | 199.1 |
| D | 9 | 35 | 573897 | 2738.59 | 858 | 832 | 209.3 |
| D | 12 | 218 | 308395 | 1469.79 | 858 | 832 | 209.3 |
| D | 1 | 52 | 213166 | 1014.71 | 858 | 832 | 209.3 |
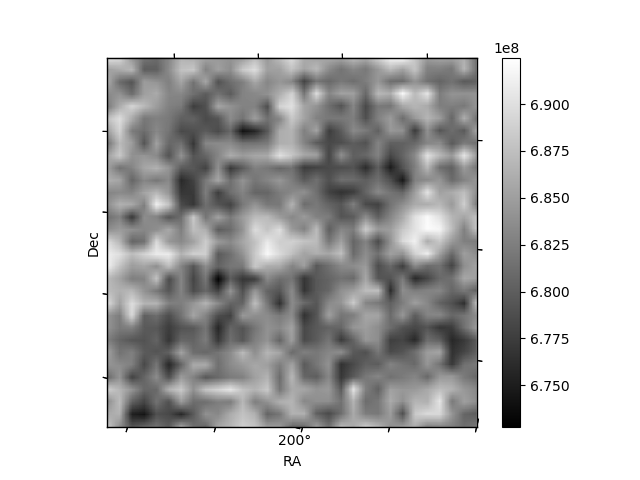
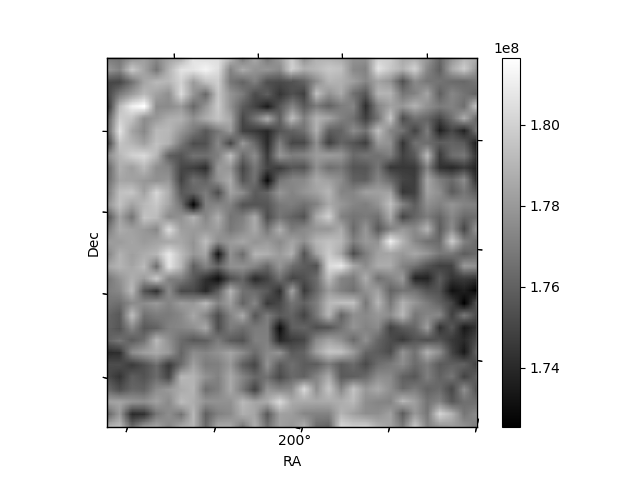
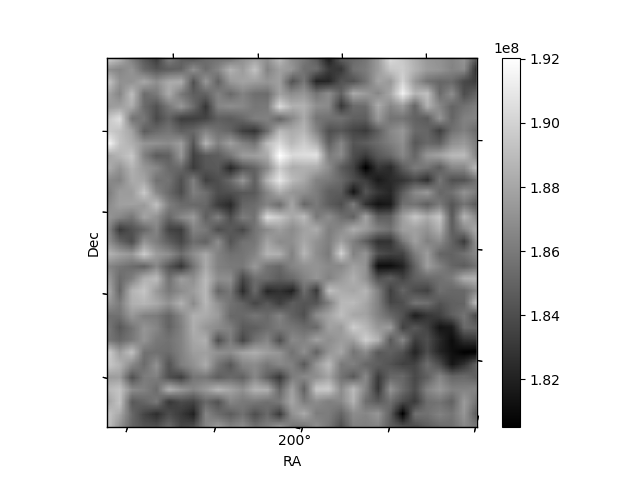
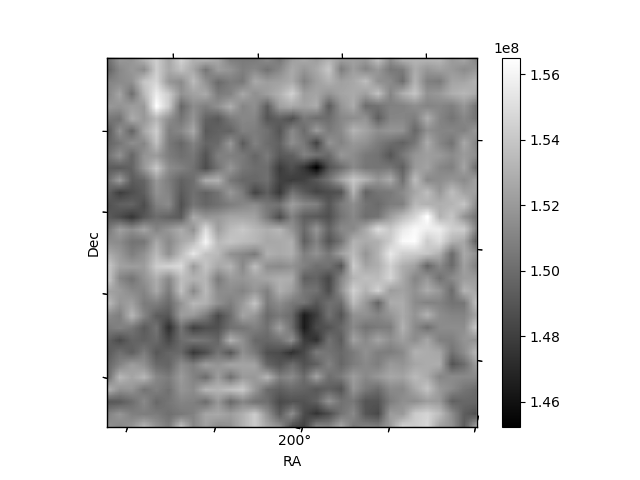
Histogram calculated using DETX and DETY for each event in the final _common_clean file
| Quadrant A | 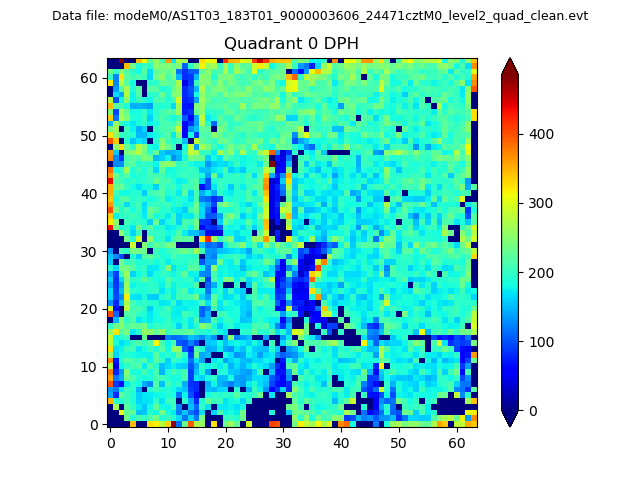 |
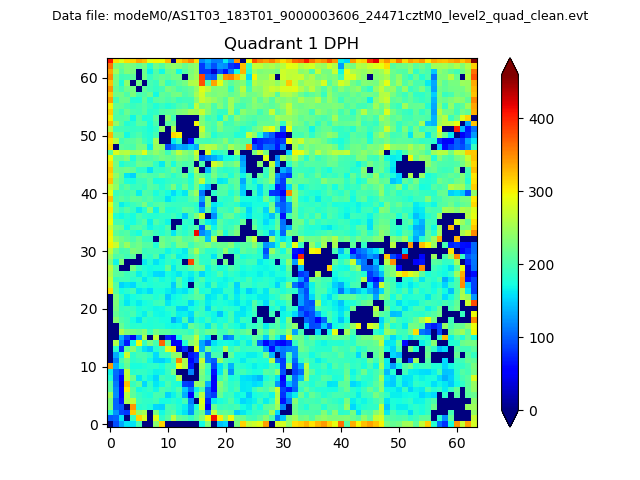 |
Quadrant B |
|---|---|---|---|
| Quadrant D | 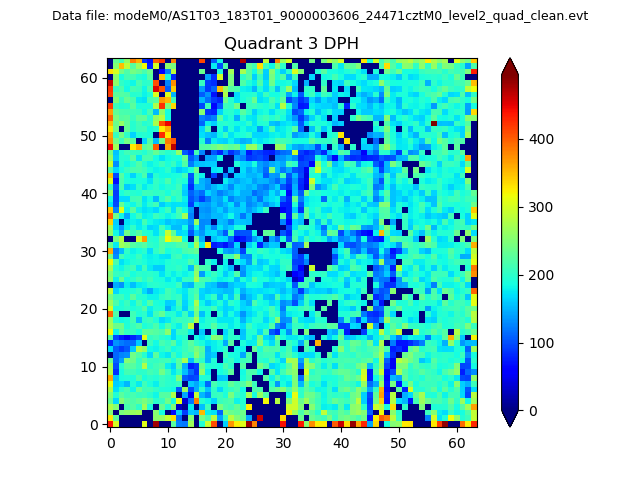 |
 |
Quadrant C |
| Plot type | Count rate plots | Images |
|---|---|---|
| Comparison with Poisson distribution Blue bars denote a histogram of data divided into 1 sec bins. Red curve is a Poisson curve with rate = median count rate of data. |
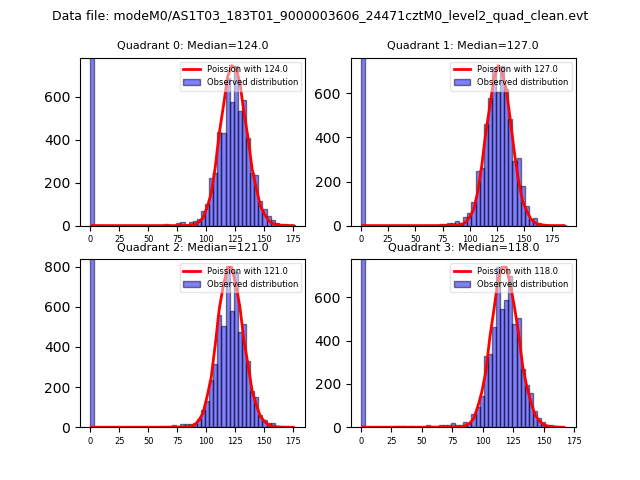 |
 |
| Quadrant-wise count rates Data is divided into 100 sec bins |
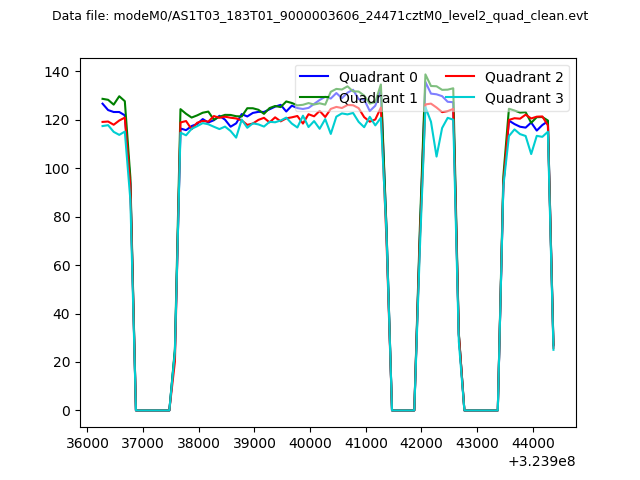 |
|
| Module-wise count rates for Quadrant A Data is divided into 100 sec bins |
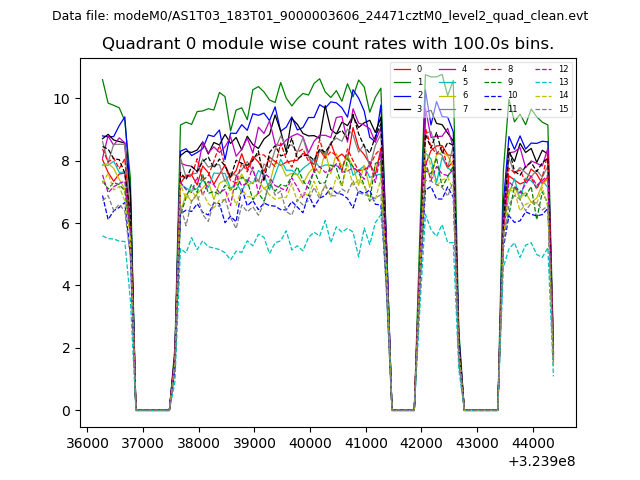 |
 |
| Module-wise count rates for Quadrant B Data is divided into 100 sec bins |
 |
 |
| Module-wise count rates for Quadrant C Data is divided into 100 sec bins |
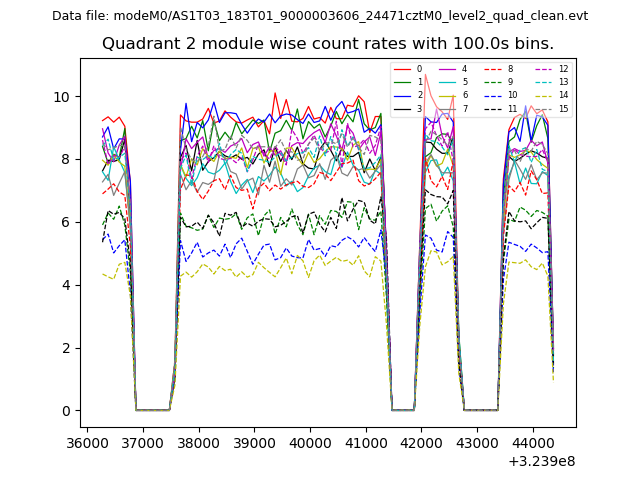 |
 |
| Module-wise count rates for Quadrant D Data is divided into 100 sec bins |
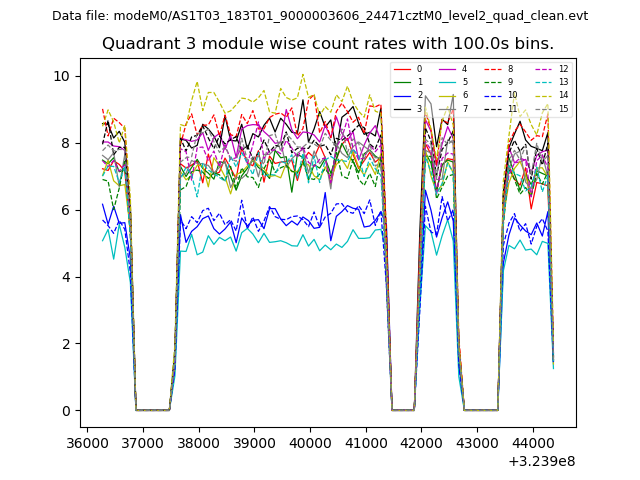 |
 |
| Parameter | Plot |
|---|---|
| CZT HV Monitor | 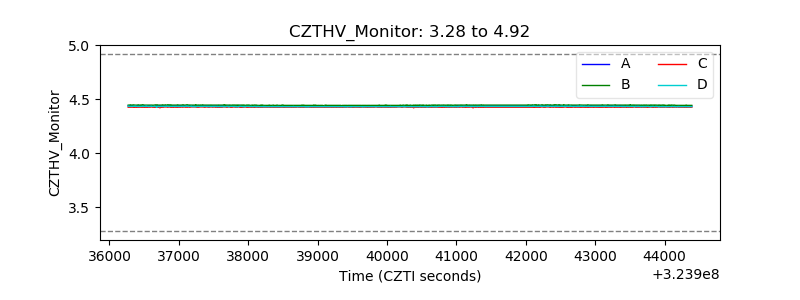 |
| D_VDD | 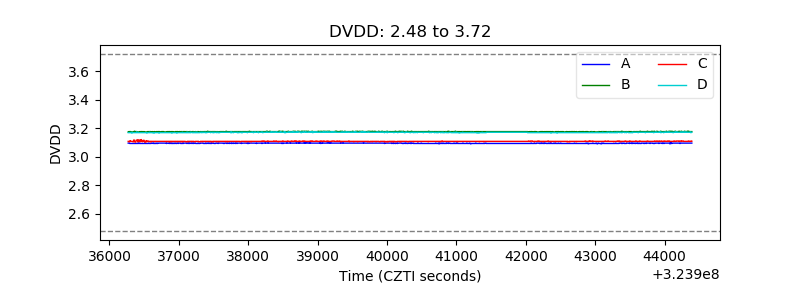 |
| Temperature 1 |  |
| Veto HV Monitor | 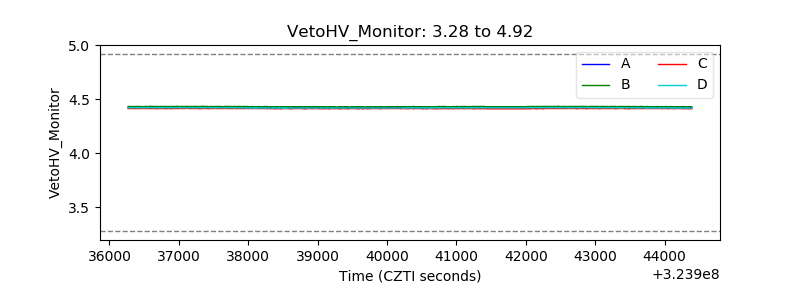 |
| Veto LLD | 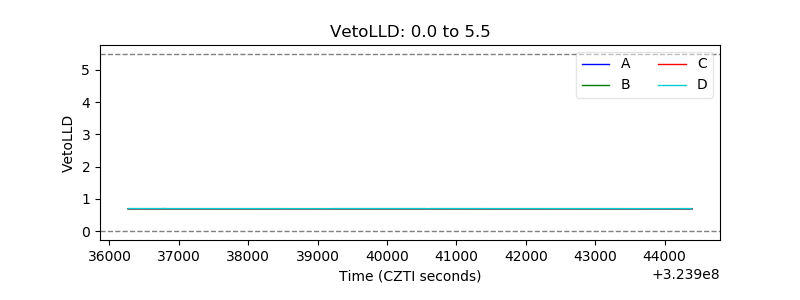 |
| Alpha Counter | 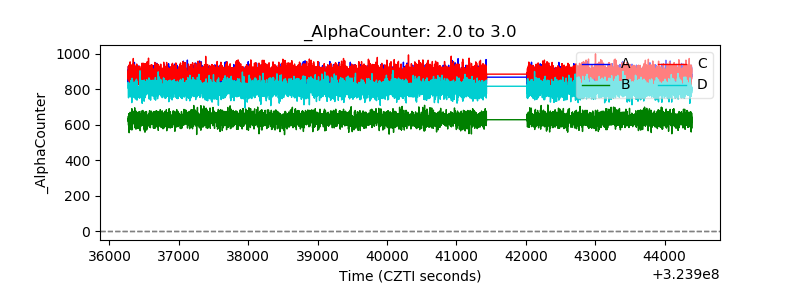 |
| _CPM_Rate | 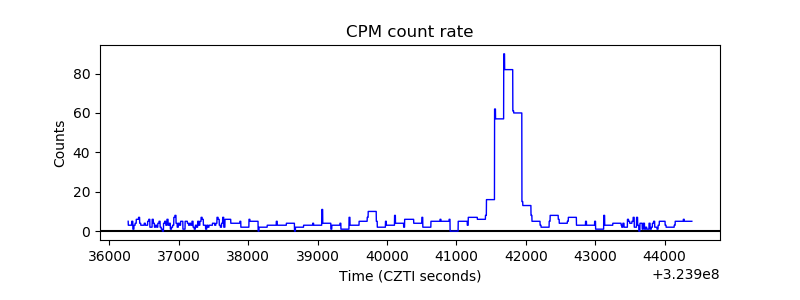 |
| CZT Counter | 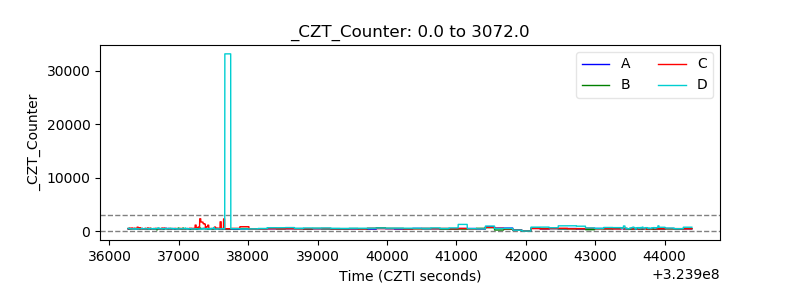 |
| +2.5 Volts monitor | 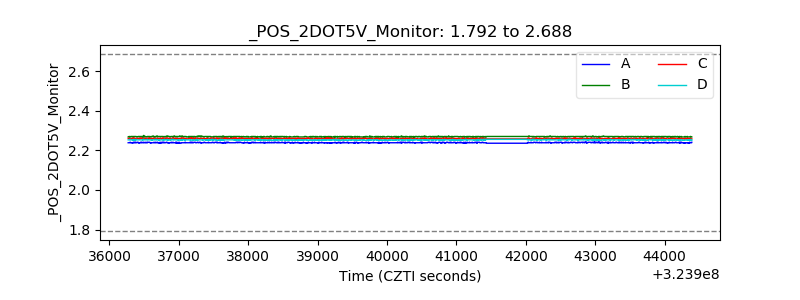 |
| +5 Volts monitor | 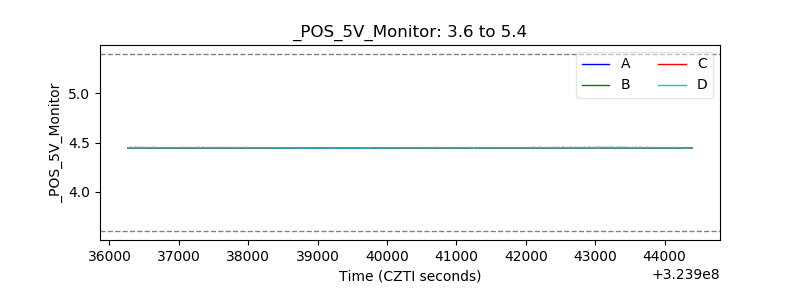 |
| _ROLL_ROT | 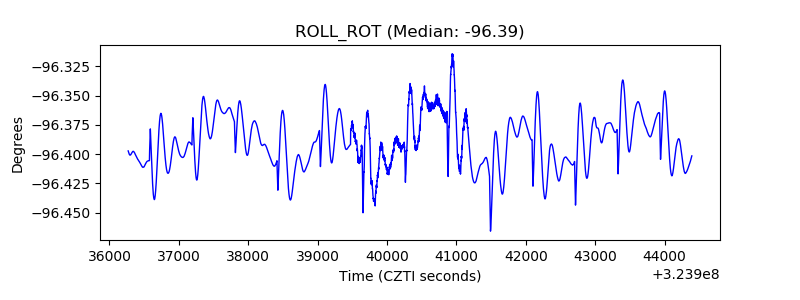 |
| _Roll_DEC | 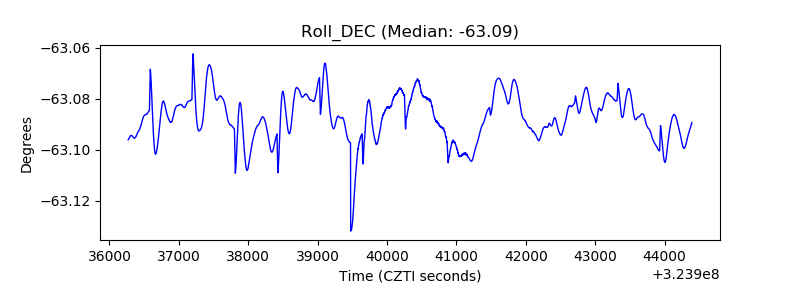 |
| _Roll_RA | 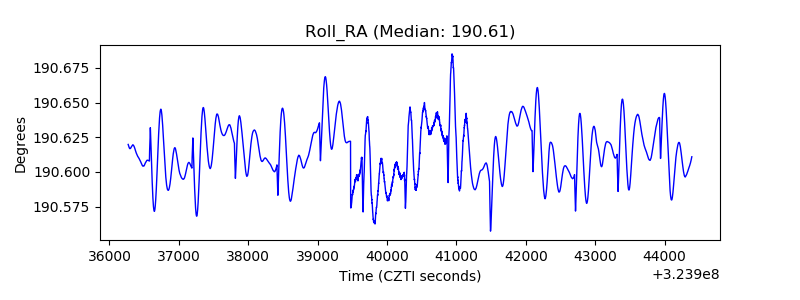 |
| Veto Counter |  |