| Param | Original file | Final file |
|---|---|---|
| Filename | modeM0/AS1T03_183T01_9000003606_24472cztM0_level2.evt | modeM0/AS1T03_183T01_9000003606_24472cztM0_level2_quad_clean.evt |
| Size (bytes) | 1,201,420,800 | 278,988,480 |
| Size | 1.1 GB | 266.1 MB |
| Events in quadrant A | 7,537,749 | 1,873,919 |
| Events in quadrant B | 7,712,468 | 1,906,310 |
| Events in quadrant C | 7,932,684 | 1,823,736 |
| Events in quadrant D | 12,118,992 | 1,740,832 |
| Mode M0 | |||
|---|---|---|---|
| Quadrant | BADHDUFLAG | Total packets | Discarded packets |
| A | 0 | 33273 | 3 |
| B | 0 | 33429 | 3 |
| C | 0 | 34236 | 3 |
| D | 0 | 47023 | 6 |
| Mode SS | |||
|---|---|---|---|
| Quadrant | BADHDUFLAG | Total packets | Discarded packets |
| A | 0 | 326 | 0 |
| B | 0 | 326 | 0 |
| C | 0 | 326 | 0 |
| D | 0 | 326 | 0 |
| Mode M9 | |||
|---|---|---|---|
| Quadrant | BADHDUFLAG | Total packets | Discarded packets |
| A | 0 | 27 | 0 |
| B | 0 | 27 | 0 |
| C | 0 | 27 | 0 |
| D | 0 | 27 | 0 |
| Quadrant | Total seconds | Saturated seconds | Saturation percentage |
|---|---|---|---|
| A | 16031 | 163 | 1.016780% |
| B | 16031 | 183 | 1.141538% |
| C | 16031 | 313 | 1.952467% |
| D | 16031 | 938 | 5.851163% |
Noise dominated data is calculated using 1-second bins in cleaned event files. If a bin has >2000 counts, and if more than 50% of those come from <1% of pixels, then it is considered to be noise-dominated and hence unusable.
| Quadrant | # 1 sec bins | Bins with >0 counts | Bins with >2000 counts | High rate bins dominated by noise | Noise dominated (total time) | Noise dominated (detector-on time) | Marked lightcurve |
|---|---|---|---|---|---|---|---|
| A | 18686 | 16033 | 0 | 0 | 0.00% | 0.00% | 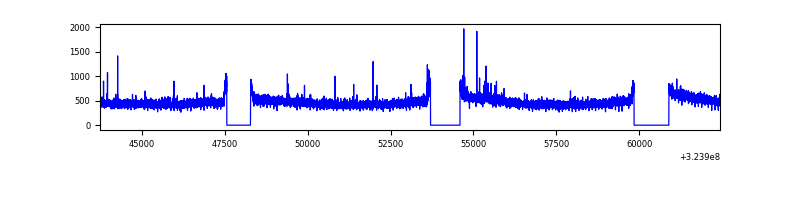 |
| B | 18686 | 16034 | 1 | 1 | 0.01% | 0.01% | 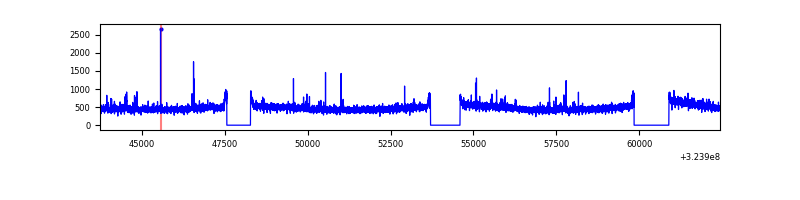 |
| C | 18686 | 16034 | 27 | 27 | 0.14% | 0.17% | 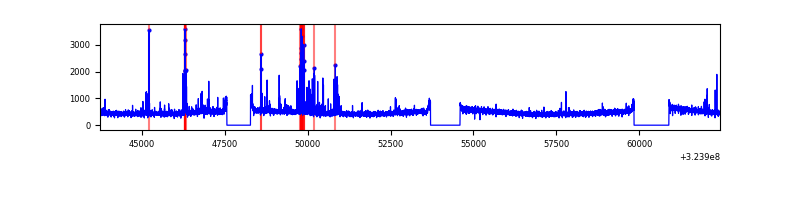 |
| D | 18686 | 16034 | 607 | 607 | 3.25% | 3.79% | 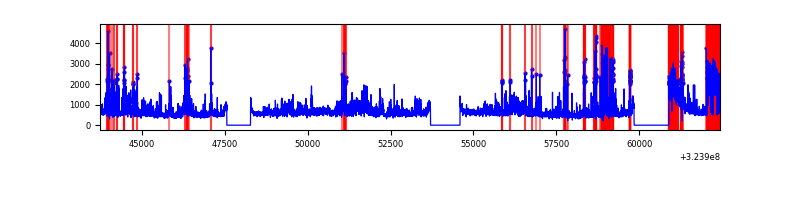 |
Top three noisy pixels from each quadrant. If the there are fewer than three noisy pixels in the level2.evt file, extra rows are filled as -1
| Pixel properties | Quadrant properties | ||||||
|---|---|---|---|---|---|---|---|
| Quadrant | DetID | PixID | Counts | Sigma | Mean | Median | Sigma |
| A | 4 | 2 | 55359 | 137.48 | 1940 | 1899 | 388.9 |
| A | 13 | 254 | 26044 | 62.09 | 1940 | 1899 | 388.9 |
| A | 3 | 137 | 17569 | 40.3 | 1940 | 1899 | 388.9 |
| B | 7 | 202 | 73274 | 196.36 | 1930 | 1883 | 363.6 |
| B | 12 | 111 | 44342 | 116.78 | 1930 | 1883 | 363.6 |
| B | 0 | 190 | 40764 | 106.94 | 1930 | 1883 | 363.6 |
| C | 2 | 16 | 391028 | 909.53 | 1849 | 1855 | 427.9 |
| C | 14 | 238 | 296018 | 687.48 | 1849 | 1855 | 427.9 |
| C | 3 | 233 | 45932 | 103.01 | 1849 | 1855 | 427.9 |
| D | 1 | 52 | 2722894 | 6115.3 | 1846 | 1791 | 445.0 |
| D | 12 | 218 | 1245486 | 2795.03 | 1846 | 1791 | 445.0 |
| D | 8 | 195 | 525693 | 1177.4 | 1846 | 1791 | 445.0 |
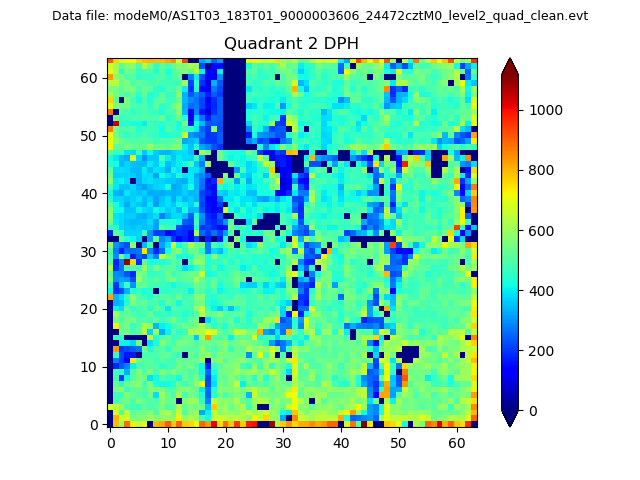
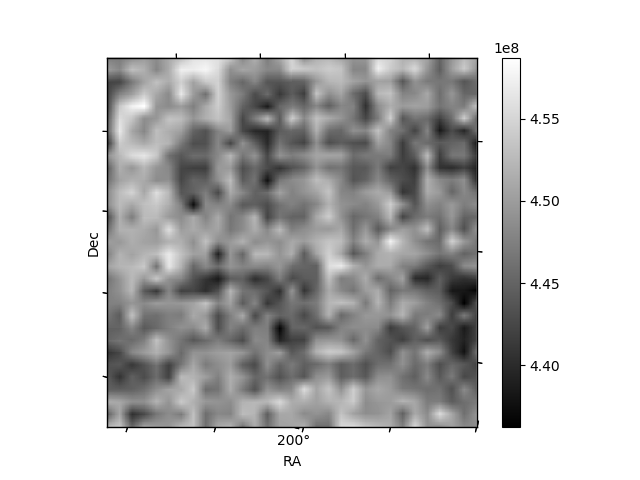
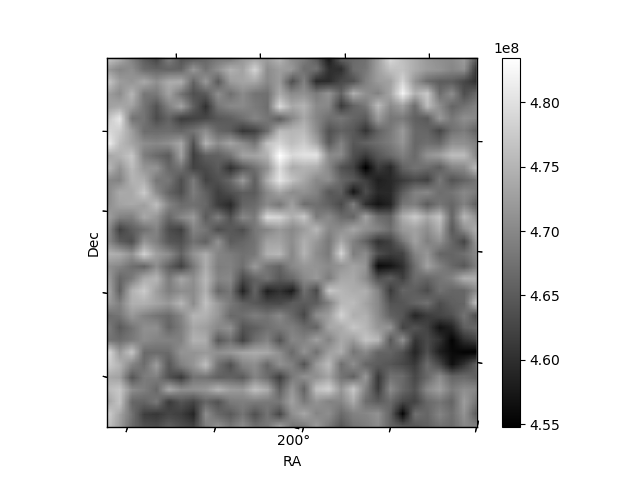
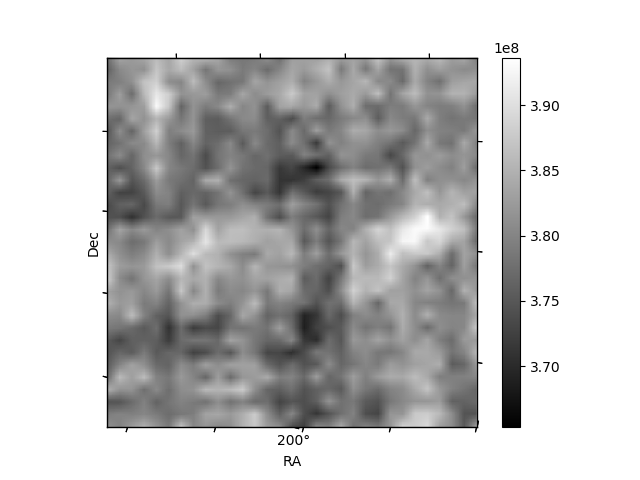
Histogram calculated using DETX and DETY for each event in the final _common_clean file
| Quadrant A | 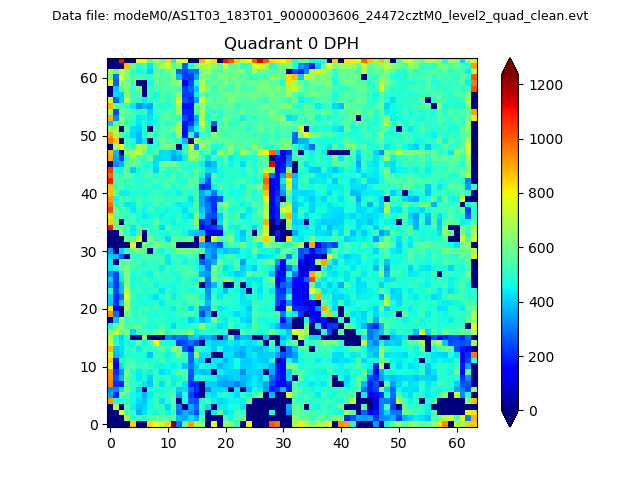 |
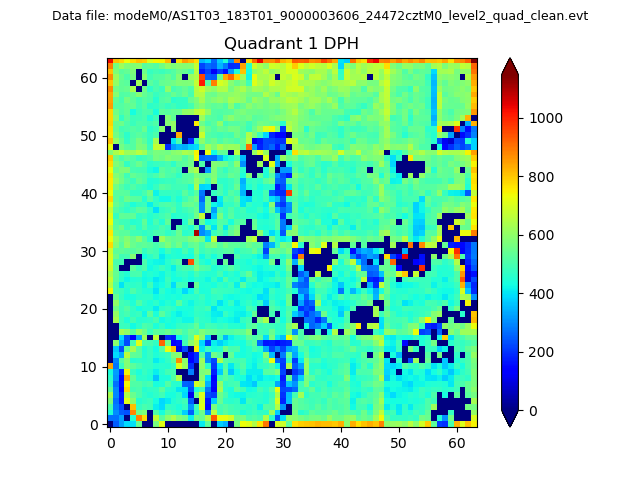 |
Quadrant B |
|---|---|---|---|
| Quadrant D | 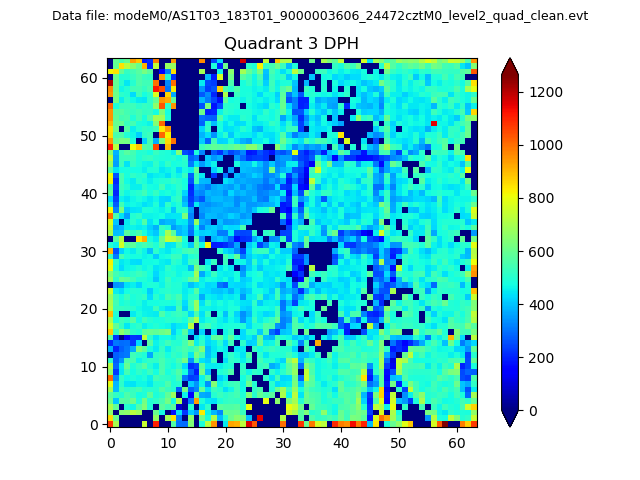 |
 |
Quadrant C |
| Plot type | Count rate plots | Images |
|---|---|---|
| Comparison with Poisson distribution Blue bars denote a histogram of data divided into 1 sec bins. Red curve is a Poisson curve with rate = median count rate of data. |
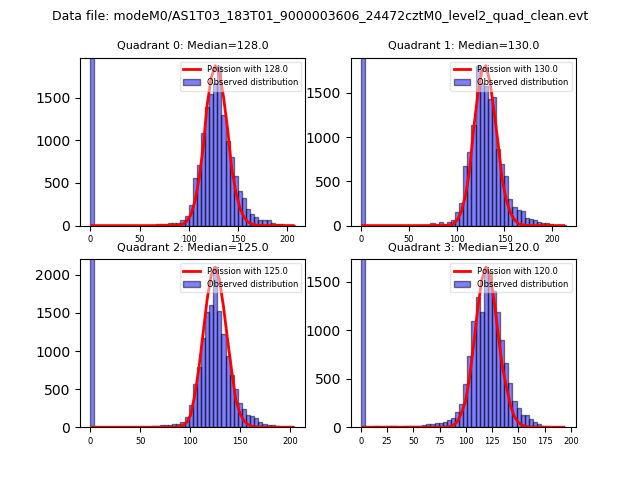 |
 |
| Quadrant-wise count rates Data is divided into 100 sec bins |
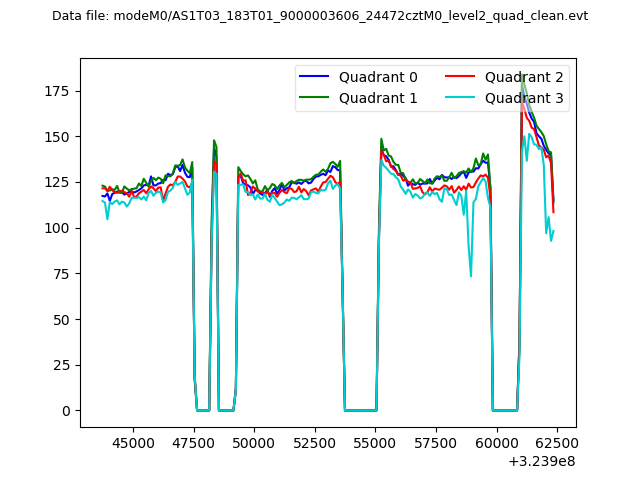 |
|
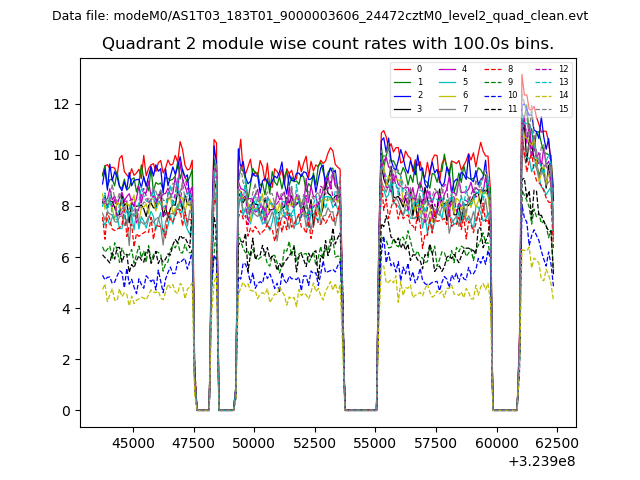
| Module-wise count rates for Quadrant A Data is divided into 100 sec bins |
 |
 |
| Module-wise count rates for Quadrant B Data is divided into 100 sec bins |
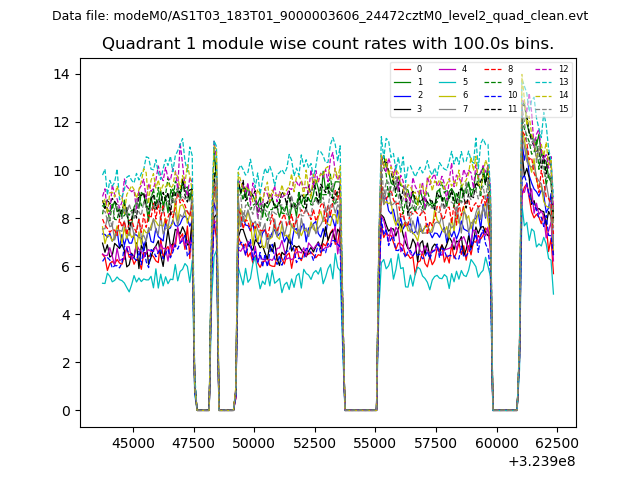 |
 |
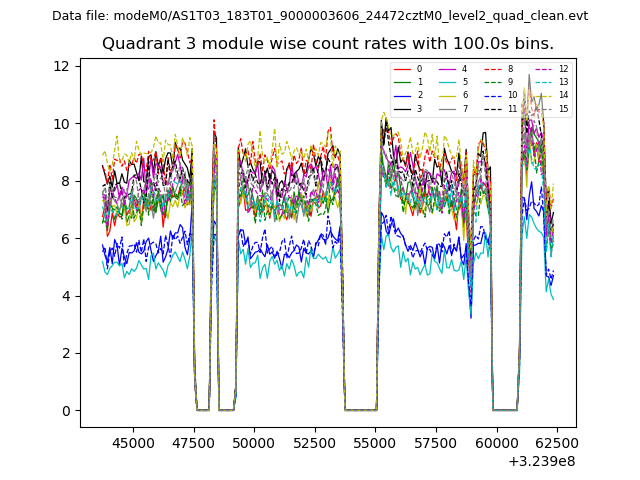
| Module-wise count rates for Quadrant C Data is divided into 100 sec bins |
 |
 |
| Module-wise count rates for Quadrant D Data is divided into 100 sec bins |
 |
 |
| Parameter | Plot |
|---|---|
| CZT HV Monitor | 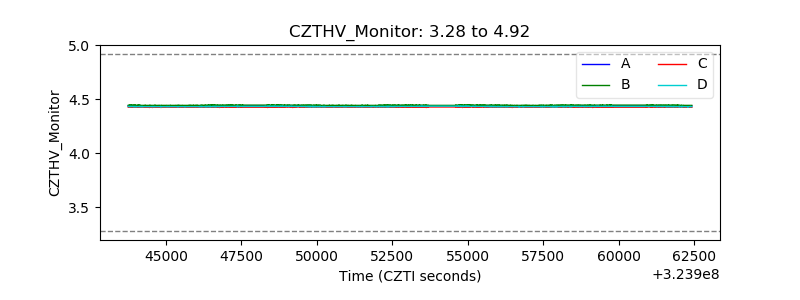 |
| D_VDD |  |
| Temperature 1 | 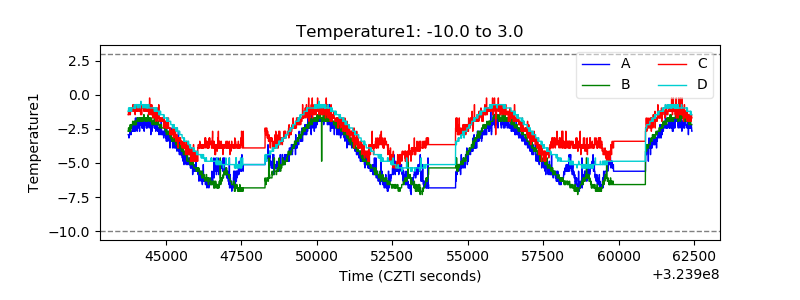 |
| Veto HV Monitor | 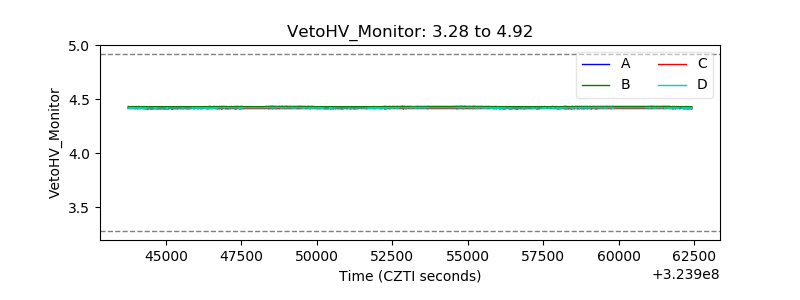 |
| Veto LLD | 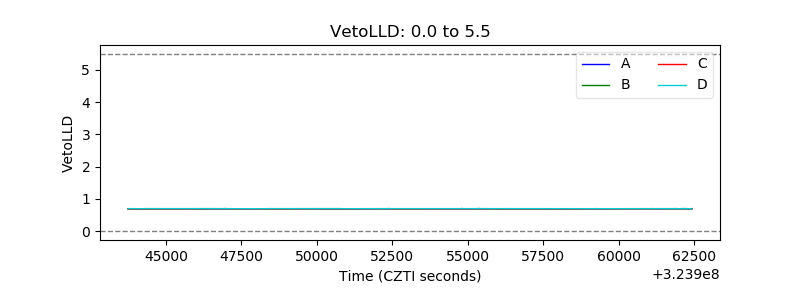 |
| Alpha Counter | 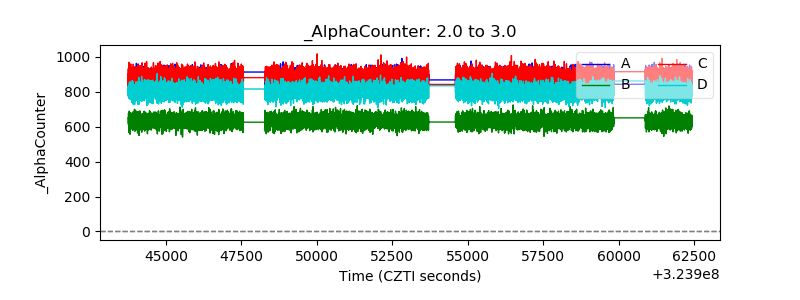 |
| _CPM_Rate | 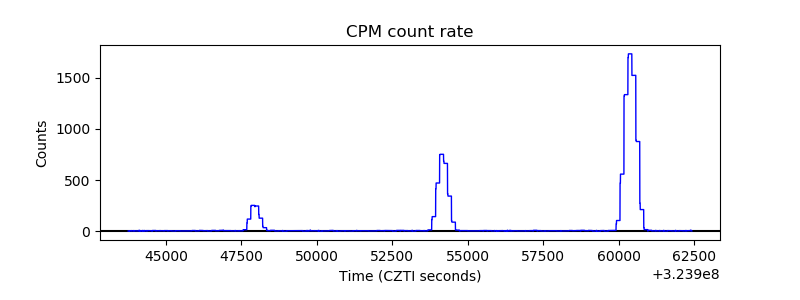 |
| CZT Counter | 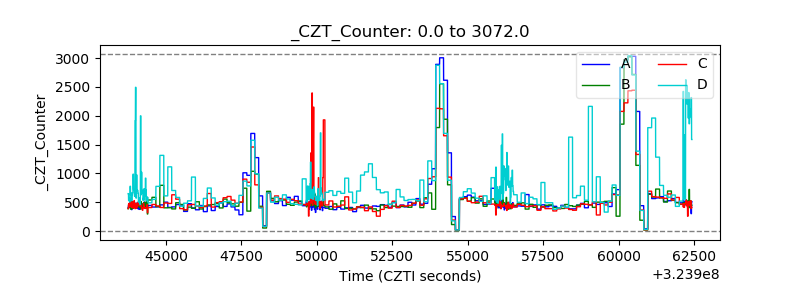 |
| +2.5 Volts monitor |  |
| +5 Volts monitor |  |
| _ROLL_ROT | 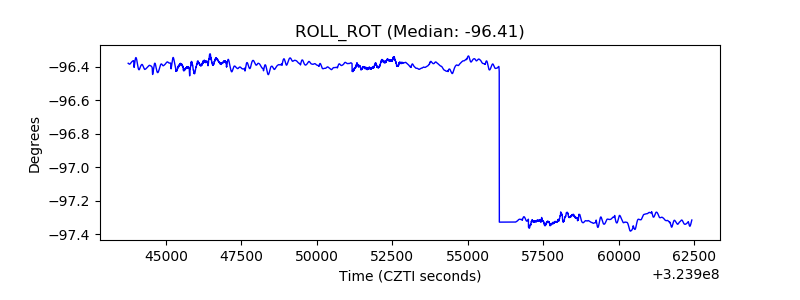 |
| _Roll_DEC | 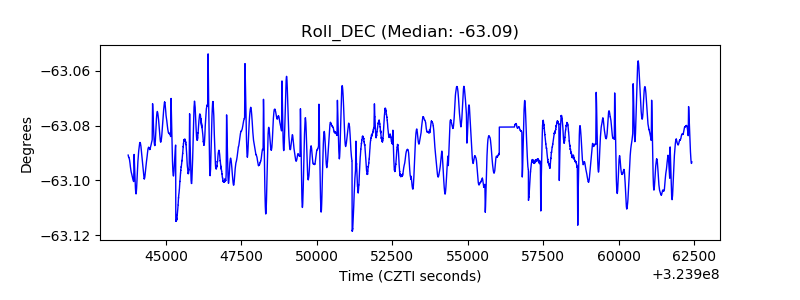 |
| _Roll_RA | 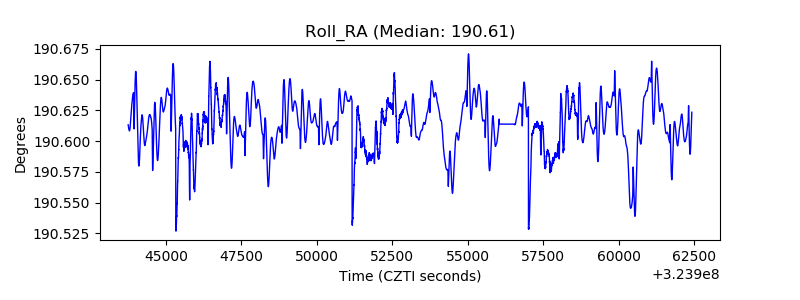 |
| Veto Counter | 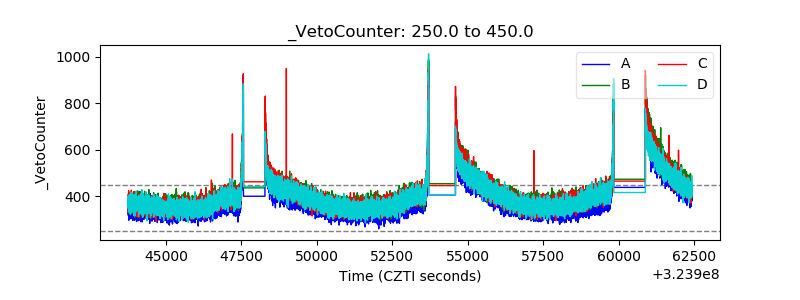 |