| Param | Original file | Final file |
|---|---|---|
| Filename | modeM0/AS1T03_183T01_9000003606_24474cztM0_level2.evt | modeM0/AS1T03_183T01_9000003606_24474cztM0_level2_quad_clean.evt |
| Size (bytes) | 529,001,280 | 124,499,520 |
| Size | 504.5 MB | 118.7 MB |
| Events in quadrant A | 2,958,597 | 872,979 |
| Events in quadrant B | 3,112,154 | 882,984 |
| Events in quadrant C | 2,952,503 | 830,505 |
| Events in quadrant D | 6,590,451 | 764,616 |
| Mode M0 | |||
|---|---|---|---|
| Quadrant | BADHDUFLAG | Total packets | Discarded packets |
| A | 0 | 12782 | 1 |
| B | 0 | 13199 | 1 |
| C | 0 | 12733 | 1 |
| D | 0 | 23806 | 1 |
| Mode SS | |||
|---|---|---|---|
| Quadrant | BADHDUFLAG | Total packets | Discarded packets |
| A | 0 | 122 | 0 |
| B | 0 | 122 | 0 |
| C | 0 | 122 | 0 |
| D | 0 | 122 | 0 |
| Mode M9 | |||
|---|---|---|---|
| Quadrant | BADHDUFLAG | Total packets | Discarded packets |
| A | 0 | 12 | 0 |
| B | 0 | 12 | 0 |
| C | 0 | 12 | 0 |
| D | 0 | 12 | 0 |
| Quadrant | Total seconds | Saturated seconds | Saturation percentage |
|---|---|---|---|
| A | 6007 | 44 | 0.732479% |
| B | 6007 | 86 | 1.431663% |
| C | 6007 | 72 | 1.198602% |
| D | 6007 | 823 | 13.700683% |
Noise dominated data is calculated using 1-second bins in cleaned event files. If a bin has >2000 counts, and if more than 50% of those come from <1% of pixels, then it is considered to be noise-dominated and hence unusable.
| Quadrant | # 1 sec bins | Bins with >0 counts | Bins with >2000 counts | High rate bins dominated by noise | Noise dominated (total time) | Noise dominated (detector-on time) | Marked lightcurve |
|---|---|---|---|---|---|---|---|
| A | 7187 | 6008 | 0 | 0 | 0.00% | 0.00% | 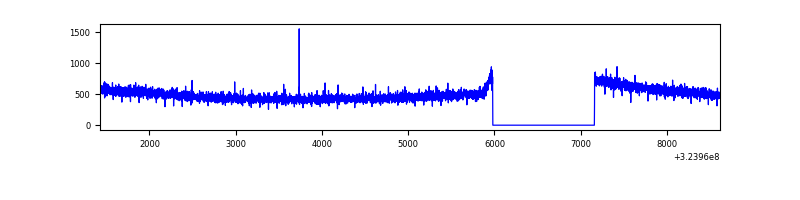 |
| B | 7187 | 6008 | 37 | 37 | 0.51% | 0.62% | 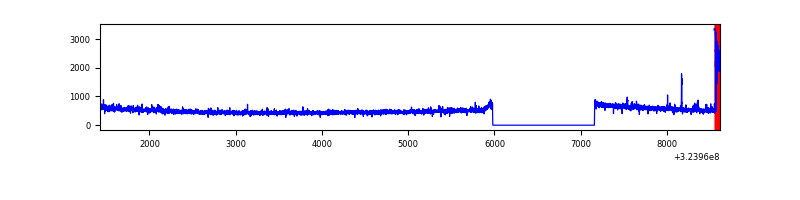 |
| C | 7187 | 6008 | 0 | 0 | 0.00% | 0.00% | 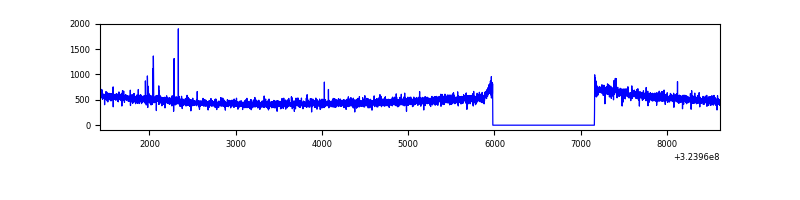 |
| D | 7187 | 6008 | 797 | 797 | 11.09% | 13.27% | 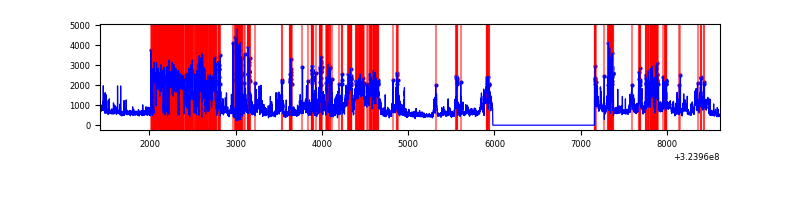 |
Top three noisy pixels from each quadrant. If the there are fewer than three noisy pixels in the level2.evt file, extra rows are filled as -1
| Pixel properties | Quadrant properties | ||||||
|---|---|---|---|---|---|---|---|
| Quadrant | DetID | PixID | Counts | Sigma | Mean | Median | Sigma |
| A | 13 | 254 | 10836 | 66.19 | 766 | 753 | 152.3 |
| A | 0 | 226 | 6591 | 38.33 | 766 | 753 | 152.3 |
| A | 3 | 137 | 6443 | 37.35 | 766 | 753 | 152.3 |
| B | 6 | 36 | 98270 | 694.34 | 759 | 743 | 140.5 |
| B | 7 | 202 | 25275 | 174.65 | 759 | 743 | 140.5 |
| B | 12 | 111 | 16665 | 113.36 | 759 | 743 | 140.5 |
| C | 14 | 238 | 118254 | 708.44 | 720 | 725 | 165.9 |
| C | 2 | 16 | 24982 | 146.22 | 720 | 725 | 165.9 |
| C | 13 | 61 | 5173 | 26.81 | 720 | 725 | 165.9 |
| D | 1 | 52 | 1862224 | 10825.76 | 704 | 683 | 172.0 |
| D | 12 | 218 | 1500311 | 8721.06 | 704 | 683 | 172.0 |
| D | 8 | 195 | 321959 | 1868.38 | 704 | 683 | 172.0 |
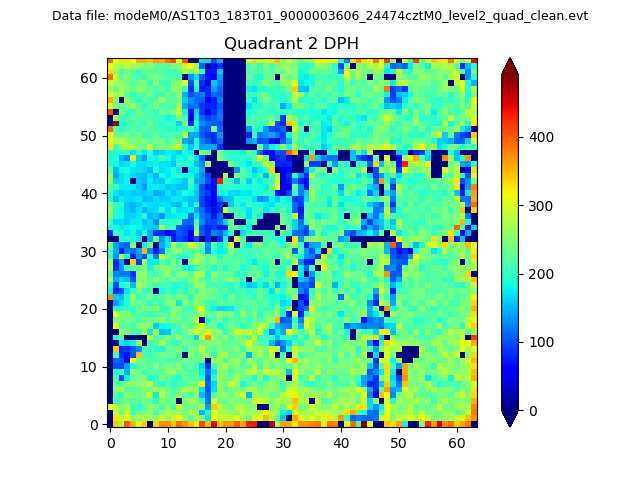
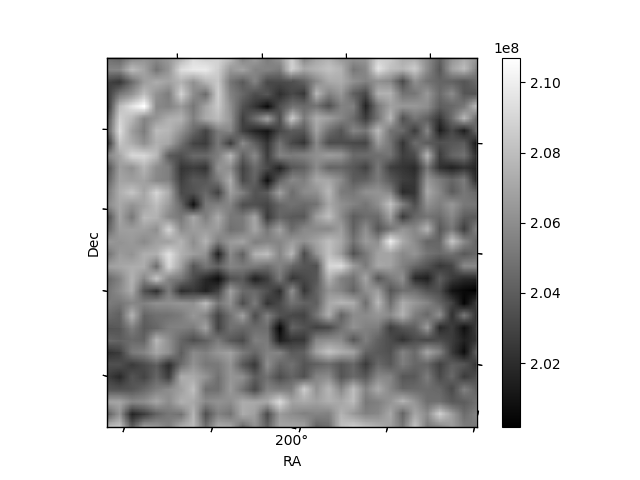
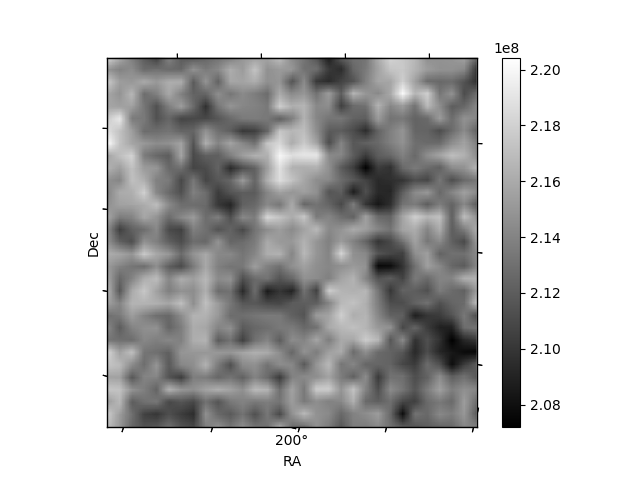
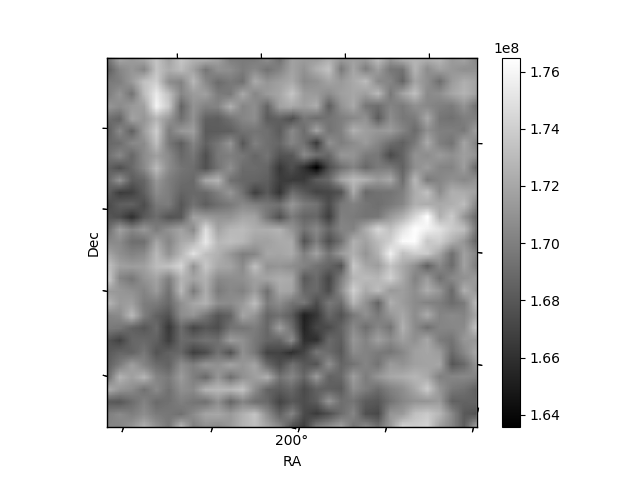
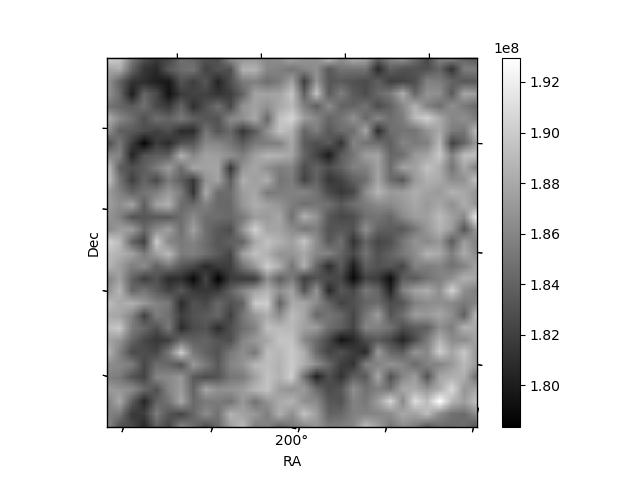
Histogram calculated using DETX and DETY for each event in the final _common_clean file
| Quadrant A |  |
 |
Quadrant B |
|---|---|---|---|
| Quadrant D |  |
 |
Quadrant C |
| Plot type | Count rate plots | Images |
|---|---|---|
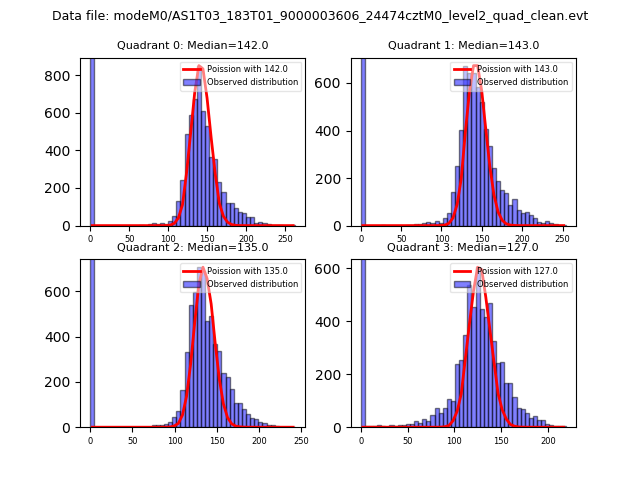
| Comparison with Poisson distribution Blue bars denote a histogram of data divided into 1 sec bins. Red curve is a Poisson curve with rate = median count rate of data. |
 |
 |
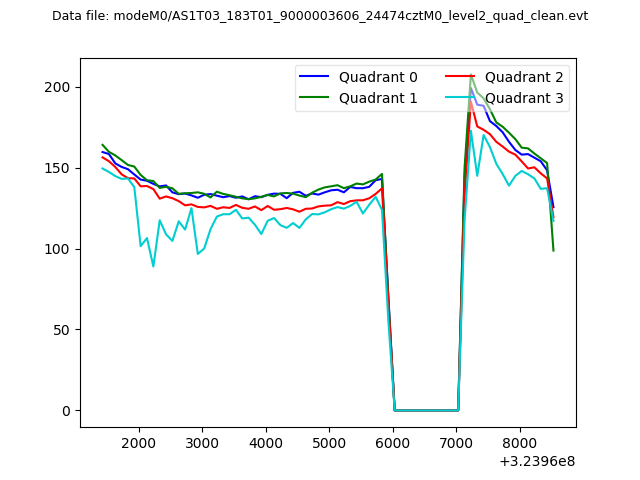
| Quadrant-wise count rates Data is divided into 100 sec bins |
 |
|
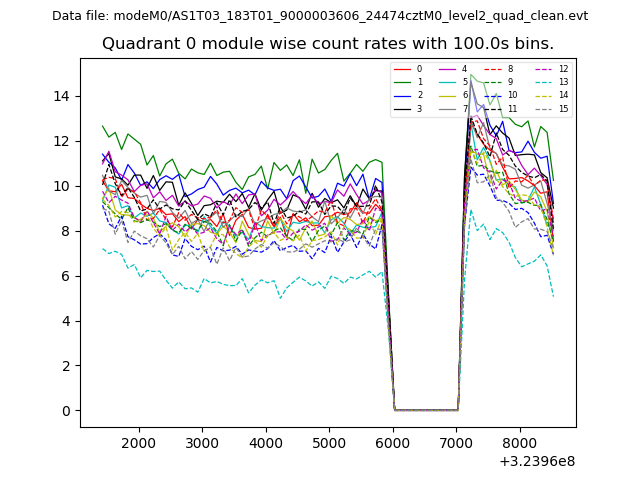
| Module-wise count rates for Quadrant A Data is divided into 100 sec bins |
 |
 |
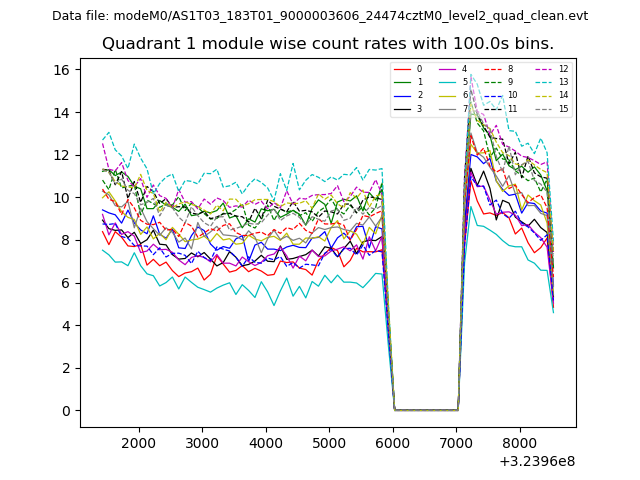
| Module-wise count rates for Quadrant B Data is divided into 100 sec bins |
 |
 |
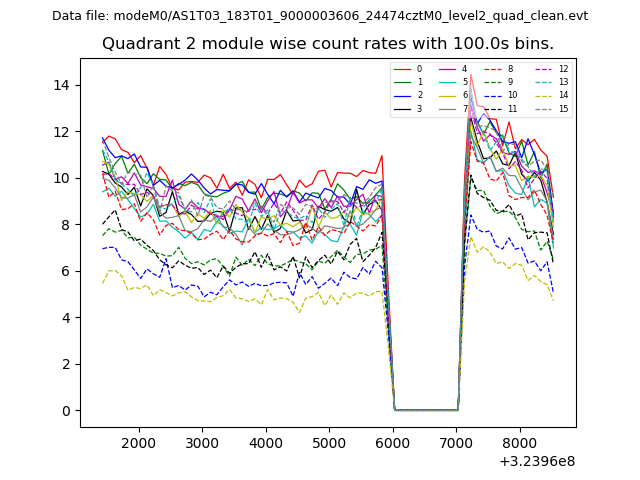
| Module-wise count rates for Quadrant C Data is divided into 100 sec bins |
 |
 |
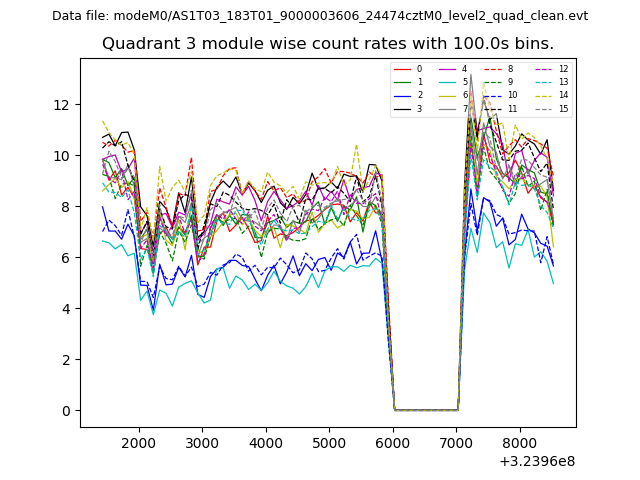
| Module-wise count rates for Quadrant D Data is divided into 100 sec bins |
 |
 |
| Parameter | Plot |
|---|---|
| CZT HV Monitor | 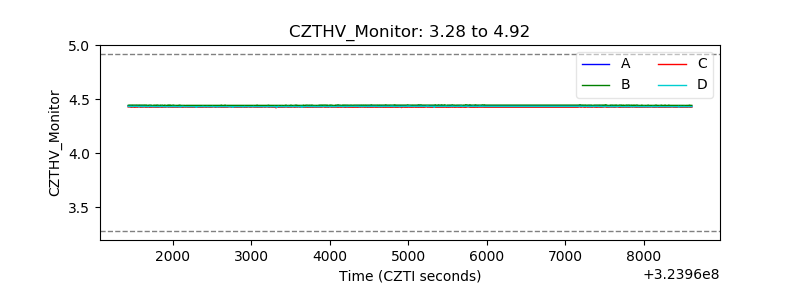 |
| D_VDD | 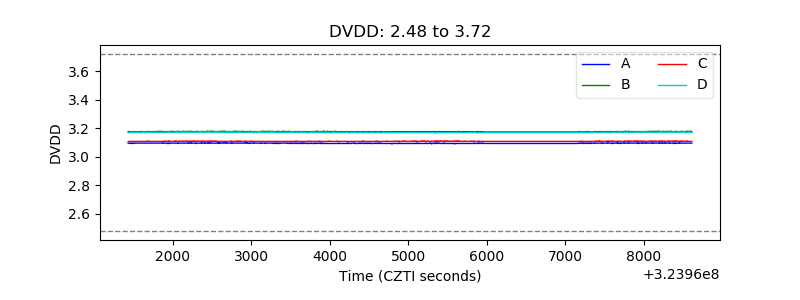 |
| Temperature 1 | 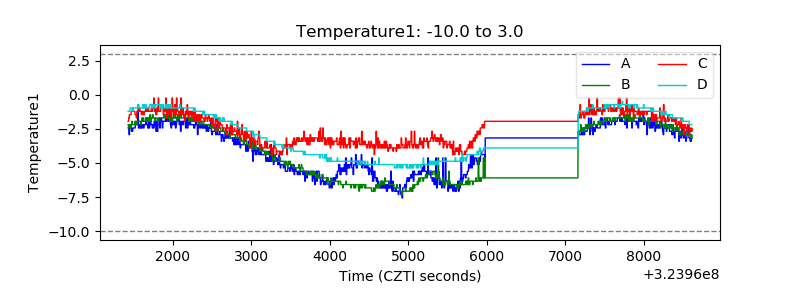 |
| Veto HV Monitor | 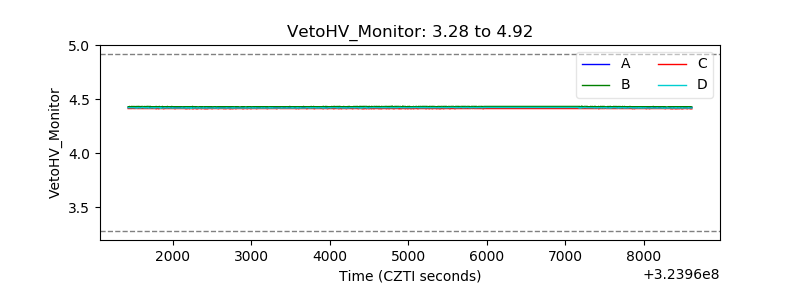 |
| Veto LLD | 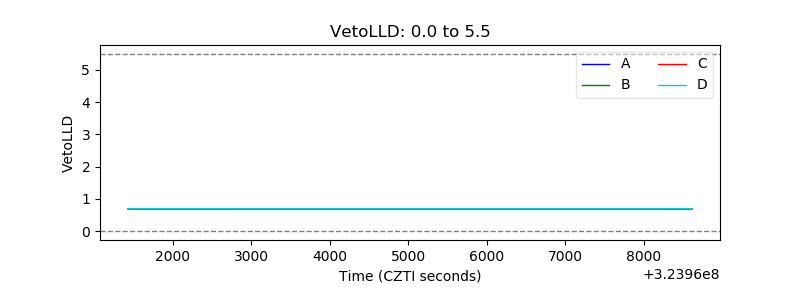 |
| Alpha Counter | 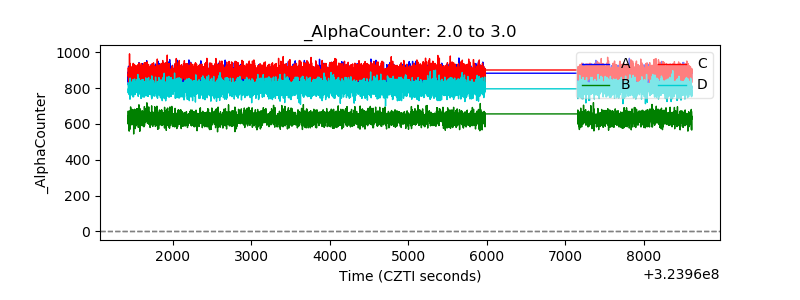 |
| _CPM_Rate | 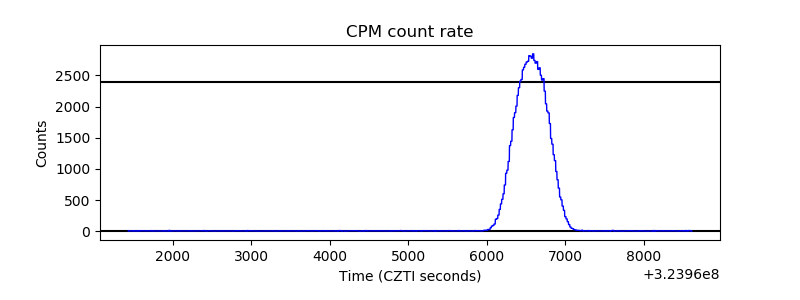 |
| CZT Counter | 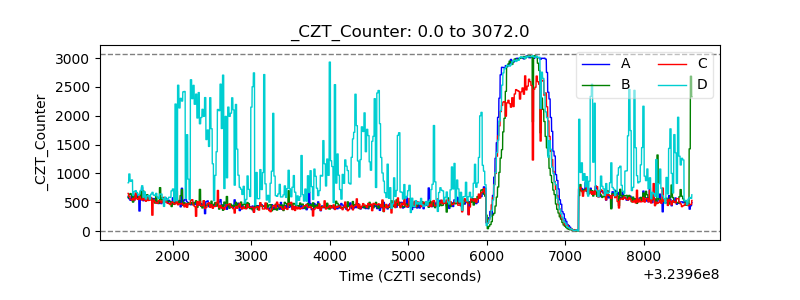 |
| +2.5 Volts monitor |  |
| +5 Volts monitor | 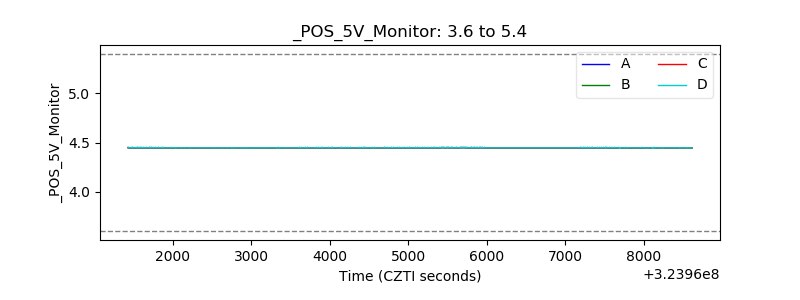 |
| _ROLL_ROT | 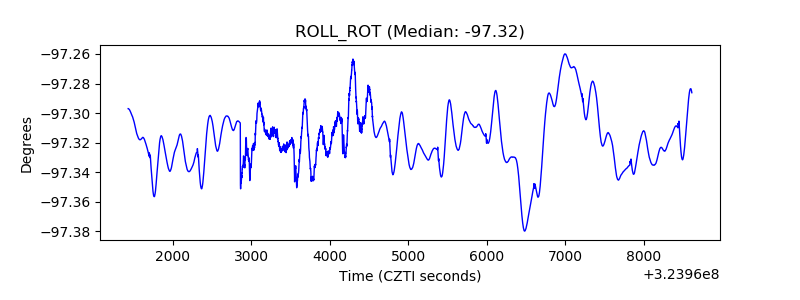 |
| _Roll_DEC | 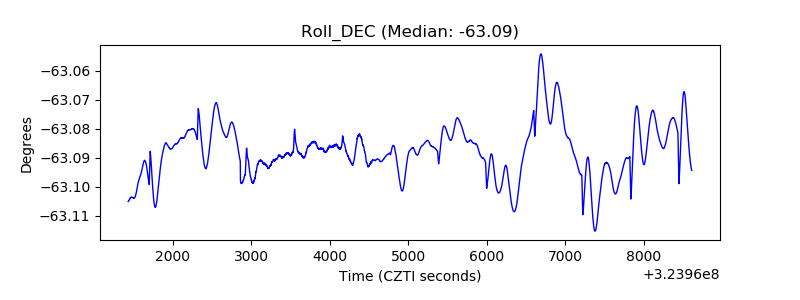 |
| _Roll_RA | 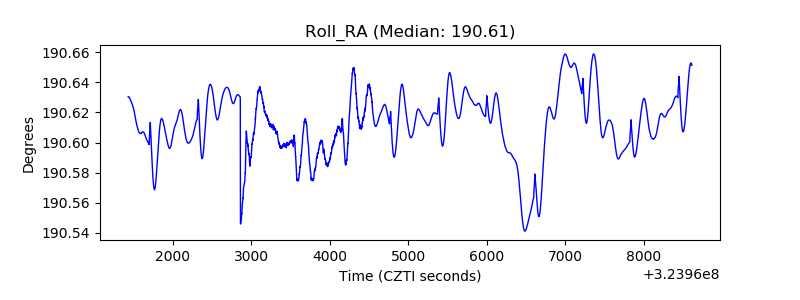 |
| Veto Counter | 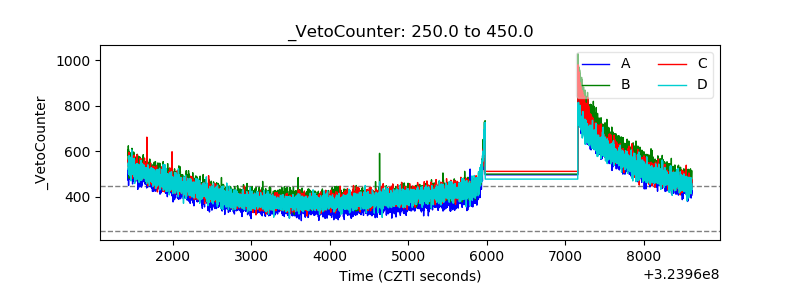 |