| Param | Original file | Final file |
|---|---|---|
| Filename | modeM0/AS1T03_183T01_9000003606_24475cztM0_level2.evt | modeM0/AS1T03_183T01_9000003606_24475cztM0_level2_quad_clean.evt |
| Size (bytes) | 532,391,040 | 127,126,080 |
| Size | 507.7 MB | 121.2 MB |
| Events in quadrant A | 3,094,496 | 891,167 |
| Events in quadrant B | 3,283,736 | 906,535 |
| Events in quadrant C | 3,045,776 | 841,702 |
| Events in quadrant D | 6,287,995 | 786,815 |
| Mode M0 | |||
|---|---|---|---|
| Quadrant | BADHDUFLAG | Total packets | Discarded packets |
| A | 0 | 13120 | 1 |
| B | 0 | 13642 | 1 |
| C | 0 | 12927 | 1 |
| D | 0 | 22991 | 1 |
| Mode SS | |||
|---|---|---|---|
| Quadrant | BADHDUFLAG | Total packets | Discarded packets |
| A | 0 | 124 | 0 |
| B | 0 | 124 | 0 |
| C | 0 | 124 | 0 |
| D | 0 | 124 | 0 |
| Mode M9 | |||
|---|---|---|---|
| Quadrant | BADHDUFLAG | Total packets | Discarded packets |
| A | 0 | 13 | 0 |
| B | 0 | 13 | 0 |
| C | 0 | 13 | 0 |
| D | 0 | 13 | 0 |
| Quadrant | Total seconds | Saturated seconds | Saturation percentage |
|---|---|---|---|
| A | 6072 | 71 | 1.169302% |
| B | 6073 | 145 | 2.387617% |
| C | 6073 | 86 | 1.416104% |
| D | 6073 | 503 | 8.282562% |
Noise dominated data is calculated using 1-second bins in cleaned event files. If a bin has >2000 counts, and if more than 50% of those come from <1% of pixels, then it is considered to be noise-dominated and hence unusable.
| Quadrant | # 1 sec bins | Bins with >0 counts | Bins with >2000 counts | High rate bins dominated by noise | Noise dominated (total time) | Noise dominated (detector-on time) | Marked lightcurve |
|---|---|---|---|---|---|---|---|
| A | 7327 | 6073 | 2 | 2 | 0.03% | 0.03% | 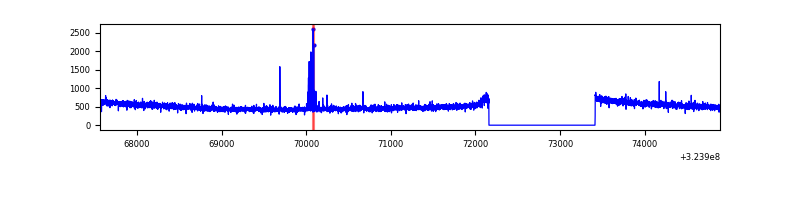 |
| B | 7328 | 6074 | 60 | 60 | 0.82% | 0.99% | 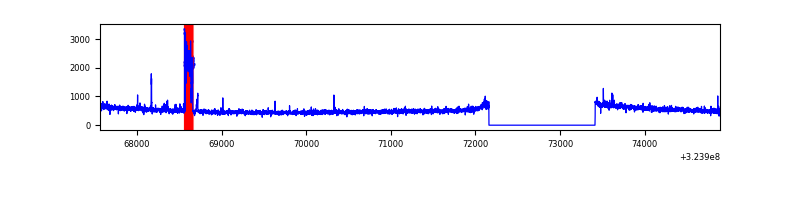 |
| C | 7328 | 6074 | 3 | 3 | 0.04% | 0.05% | 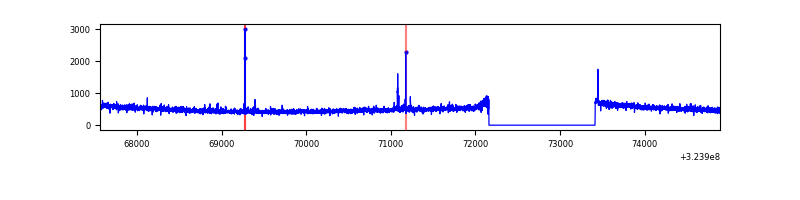 |
| D | 7328 | 6074 | 459 | 459 | 6.26% | 7.56% | 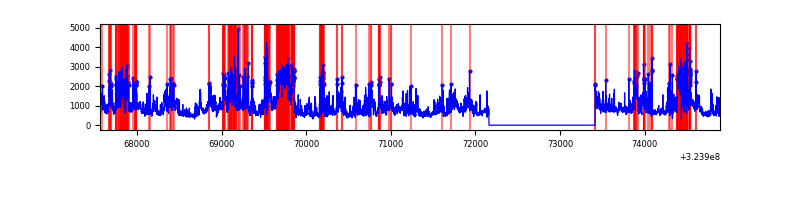 |
Top three noisy pixels from each quadrant. If the there are fewer than three noisy pixels in the level2.evt file, extra rows are filled as -1
| Pixel properties | Quadrant properties | ||||||
|---|---|---|---|---|---|---|---|
| Quadrant | DetID | PixID | Counts | Sigma | Mean | Median | Sigma |
| A | 4 | 2 | 41070 | 255.32 | 792 | 779 | 157.8 |
| A | 13 | 254 | 9738 | 56.77 | 792 | 779 | 157.8 |
| A | 0 | 226 | 6945 | 39.07 | 792 | 779 | 157.8 |
| B | 6 | 36 | 182656 | 1250.68 | 788 | 769 | 145.4 |
| B | 12 | 111 | 16833 | 110.46 | 788 | 769 | 145.4 |
| B | 11 | 111 | 14848 | 96.81 | 788 | 769 | 145.4 |
| C | 14 | 238 | 123291 | 721.62 | 742 | 745 | 169.8 |
| C | 2 | 16 | 27808 | 159.36 | 742 | 745 | 169.8 |
| C | 13 | 61 | 5294 | 26.79 | 742 | 745 | 169.8 |
| D | 12 | 218 | 1749065 | 9870.88 | 736 | 715 | 177.1 |
| D | 1 | 52 | 1313833 | 7413.63 | 736 | 715 | 177.1 |
| D | 8 | 195 | 340927 | 1920.78 | 736 | 715 | 177.1 |
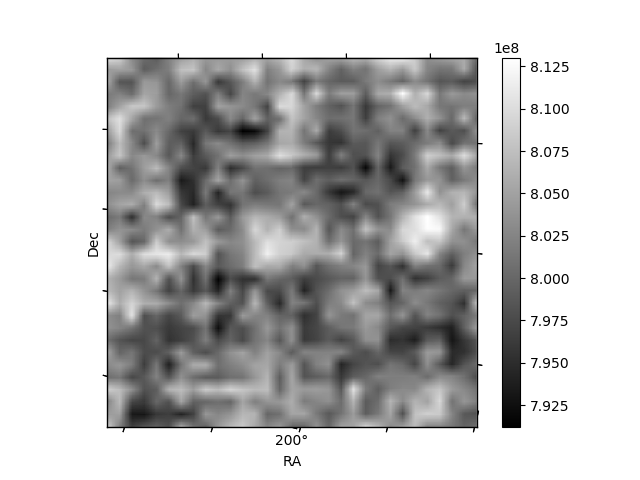
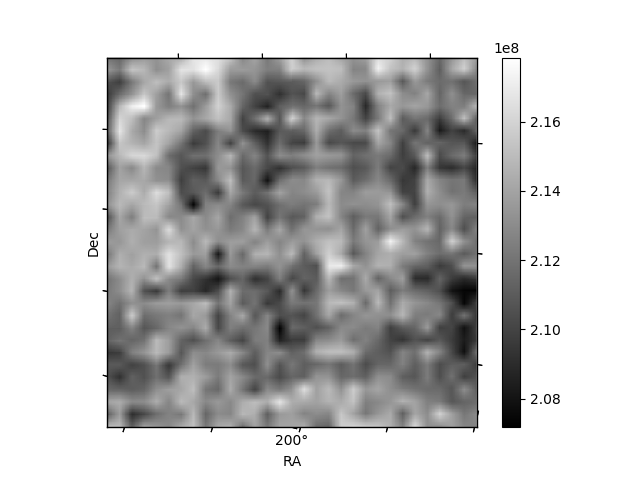
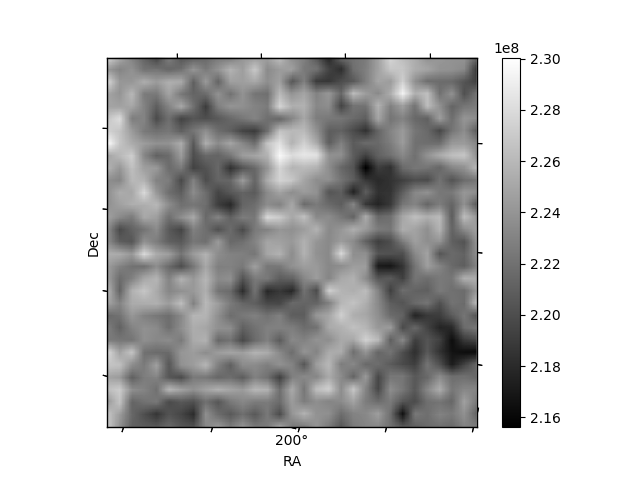
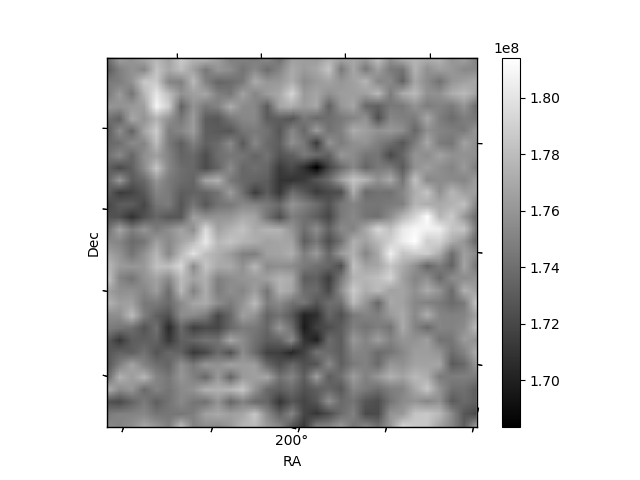
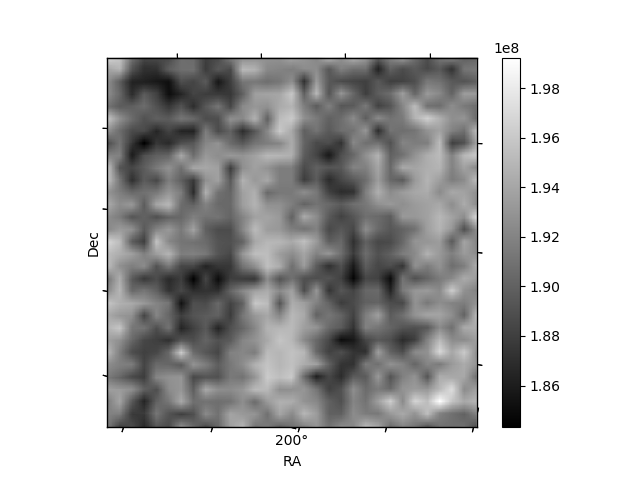
Histogram calculated using DETX and DETY for each event in the final _common_clean file
| Quadrant A | 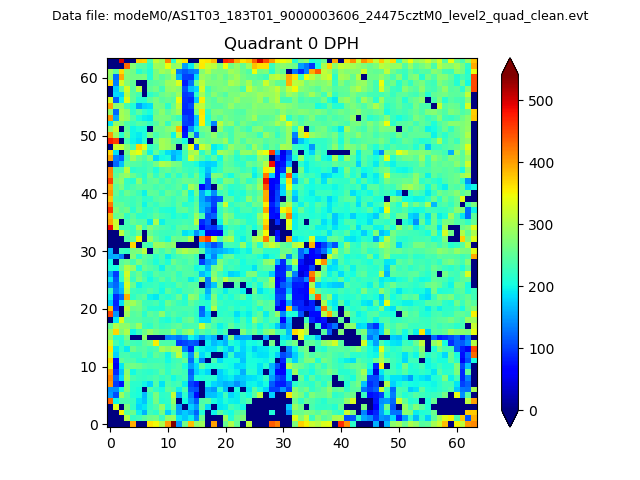 |
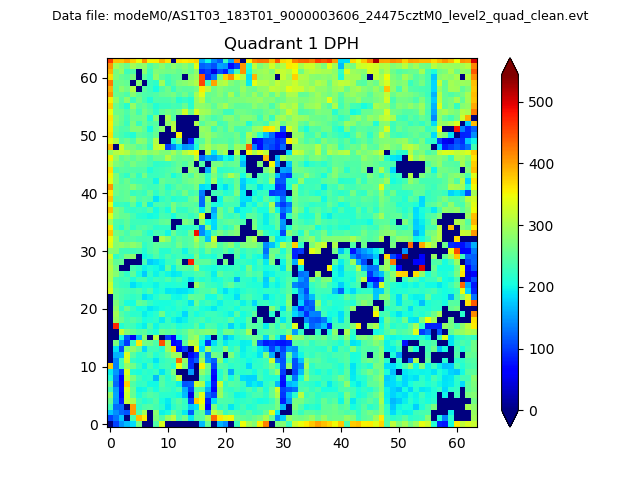 |
Quadrant B |
|---|---|---|---|
| Quadrant D | 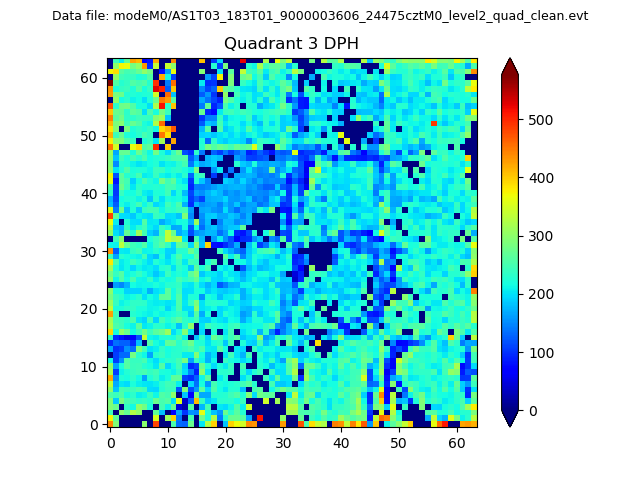 |
 |
Quadrant C |
| Plot type | Count rate plots | Images |
|---|---|---|
| Comparison with Poisson distribution Blue bars denote a histogram of data divided into 1 sec bins. Red curve is a Poisson curve with rate = median count rate of data. |
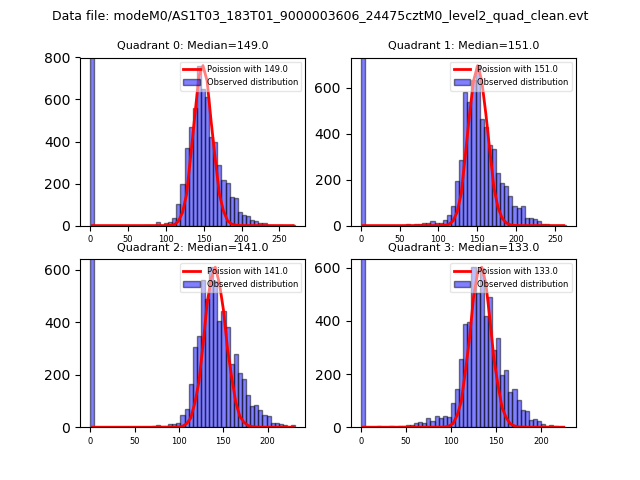 |
 |
| Quadrant-wise count rates Data is divided into 100 sec bins |
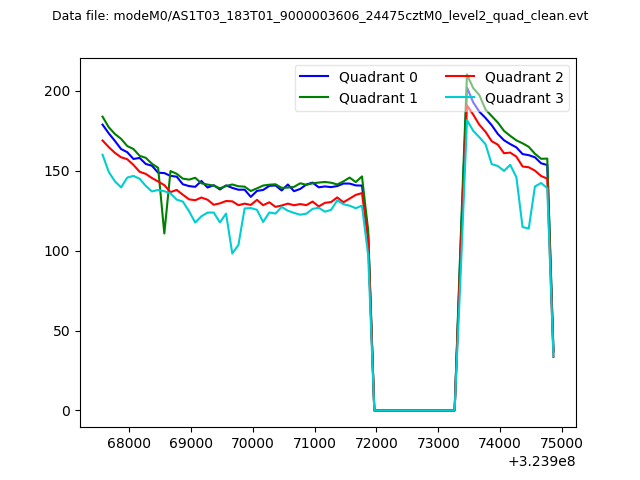 |
|
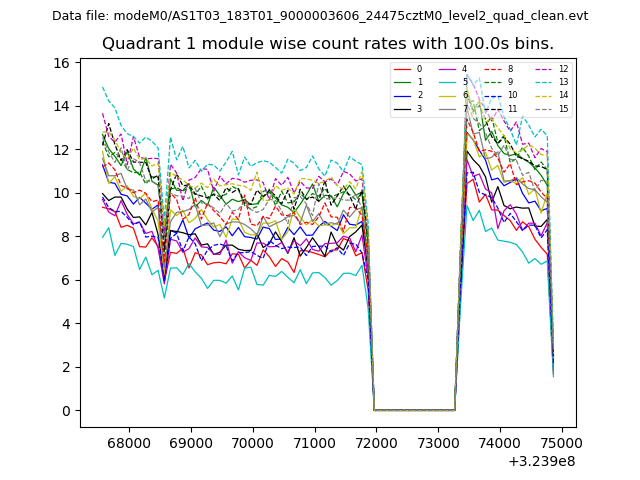
| Module-wise count rates for Quadrant A Data is divided into 100 sec bins |
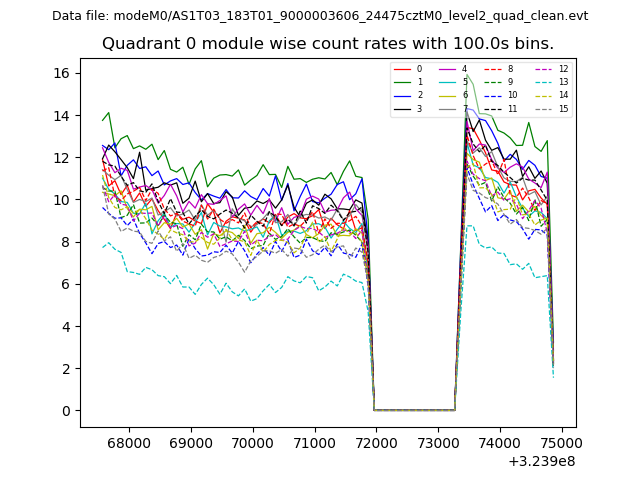 |
 |
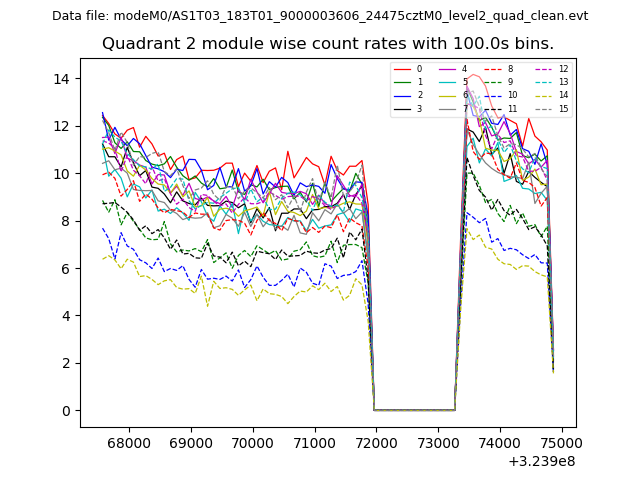
| Module-wise count rates for Quadrant B Data is divided into 100 sec bins |
 |
 |
| Module-wise count rates for Quadrant C Data is divided into 100 sec bins |
 |
 |
| Module-wise count rates for Quadrant D Data is divided into 100 sec bins |
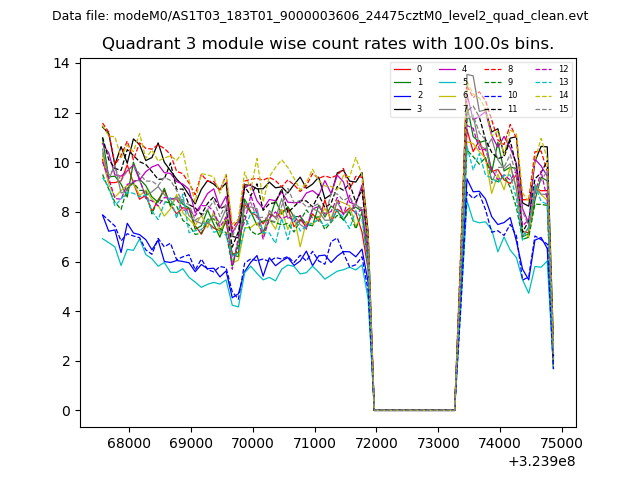 |
 |
| Parameter | Plot |
|---|---|
| CZT HV Monitor | 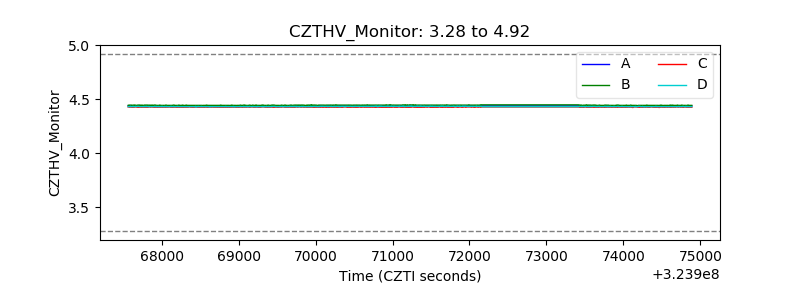 |
| D_VDD | 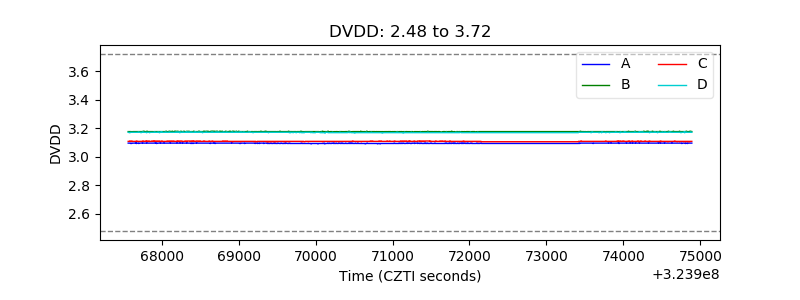 |
| Temperature 1 | 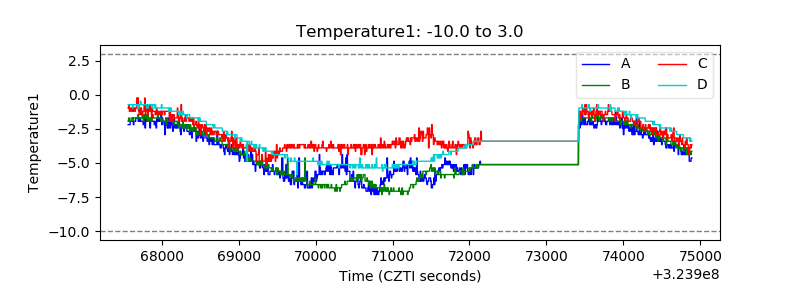 |
| Veto HV Monitor | 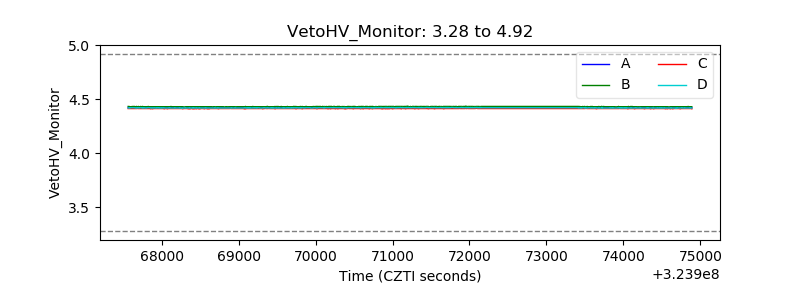 |
| Veto LLD | 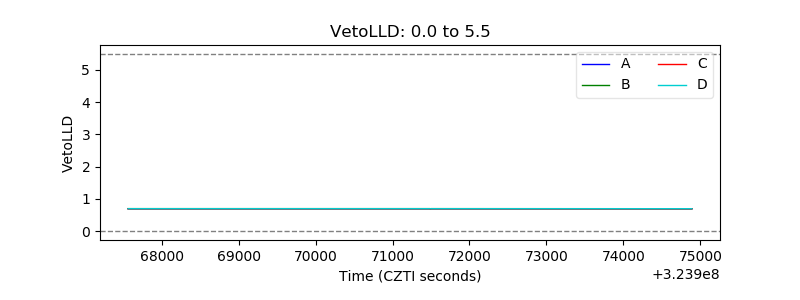 |
| Alpha Counter | 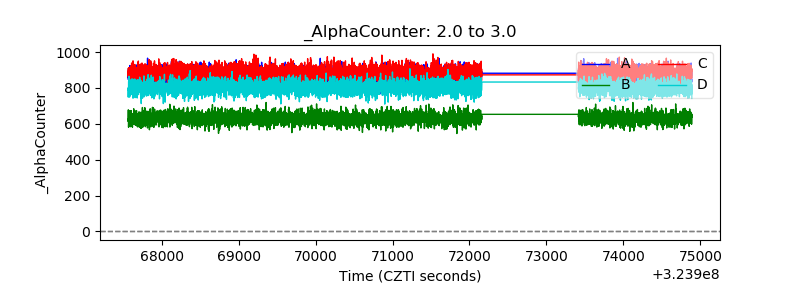 |
| _CPM_Rate | 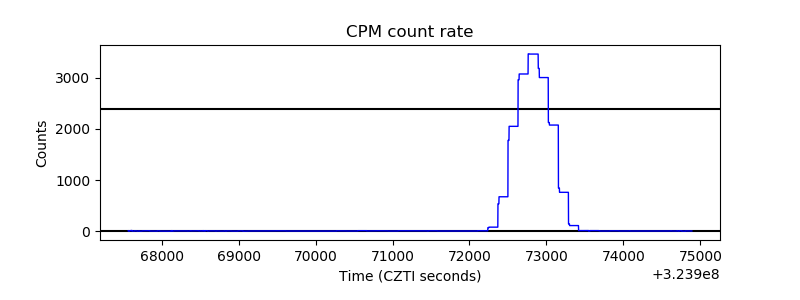 |
| CZT Counter | 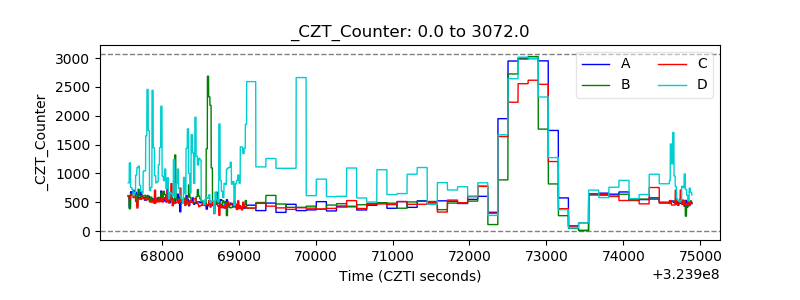 |
| +2.5 Volts monitor |  |
| +5 Volts monitor |  |
| _ROLL_ROT | 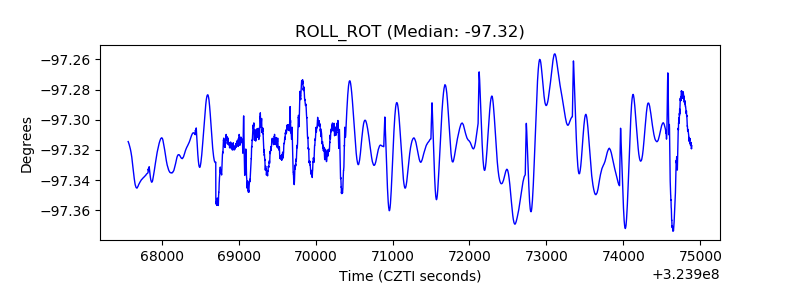 |
| _Roll_DEC |  |
| _Roll_RA | 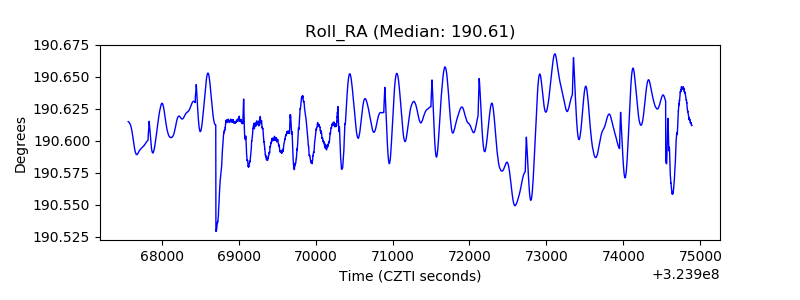 |
| Veto Counter | 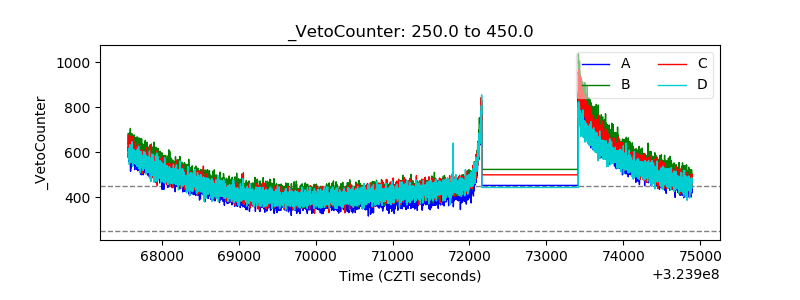 |