| Param | Original file | Final file |
|---|---|---|
| Filename | modeM0/AS1T03_183T01_9000003606_24477cztM0_level2.evt | modeM0/AS1T03_183T01_9000003606_24477cztM0_level2_quad_clean.evt |
| Size (bytes) | 439,303,680 | 119,511,360 |
| Size | 419.0 MB | 114.0 MB |
| Events in quadrant A | 3,123,096 | 819,578 |
| Events in quadrant B | 3,192,015 | 844,827 |
| Events in quadrant C | 3,108,383 | 774,693 |
| Events in quadrant D | 3,461,197 | 749,669 |
| Mode M0 | |||
|---|---|---|---|
| Quadrant | BADHDUFLAG | Total packets | Discarded packets |
| A | 0 | 13235 | 2 |
| B | 0 | 13322 | 2 |
| C | 0 | 13102 | 2 |
| D | 0 | 14496 | 2 |
| Mode SS | |||
|---|---|---|---|
| Quadrant | BADHDUFLAG | Total packets | Discarded packets |
| A | 0 | 126 | 0 |
| B | 0 | 126 | 0 |
| C | 0 | 126 | 0 |
| D | 0 | 126 | 0 |
| Mode M9 | |||
|---|---|---|---|
| Quadrant | BADHDUFLAG | Total packets | Discarded packets |
| A | 0 | 19 | 0 |
| B | 0 | 20 | 0 |
| C | 0 | 20 | 0 |
| D | 0 | 20 | 0 |
| Quadrant | Total seconds | Saturated seconds | Saturation percentage |
|---|---|---|---|
| A | 6175 | 32 | 0.518219% |
| B | 6175 | 45 | 0.728745% |
| C | 6175 | 79 | 1.279352% |
| D | 6175 | 60 | 0.971660% |
Noise dominated data is calculated using 1-second bins in cleaned event files. If a bin has >2000 counts, and if more than 50% of those come from <1% of pixels, then it is considered to be noise-dominated and hence unusable.
| Quadrant | # 1 sec bins | Bins with >0 counts | Bins with >2000 counts | High rate bins dominated by noise | Noise dominated (total time) | Noise dominated (detector-on time) | Marked lightcurve |
|---|---|---|---|---|---|---|---|
| A | 7505 | 6176 | 4 | 4 | 0.05% | 0.06% | 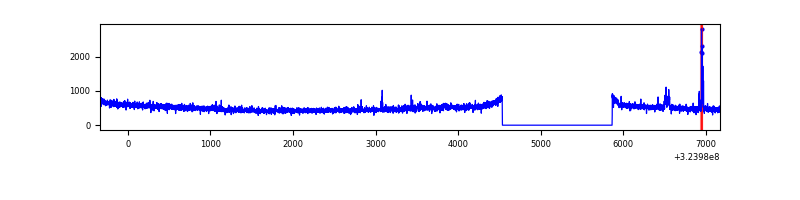 |
| B | 7505 | 6176 | 2 | 2 | 0.03% | 0.03% | 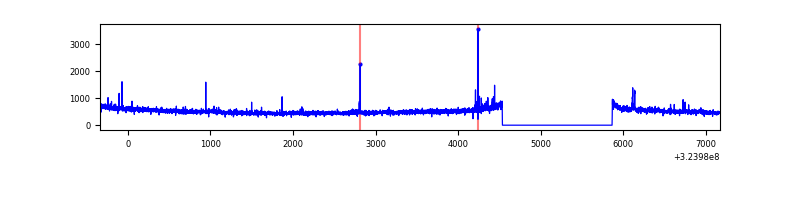 |
| C | 7505 | 6176 | 18 | 18 | 0.24% | 0.29% | 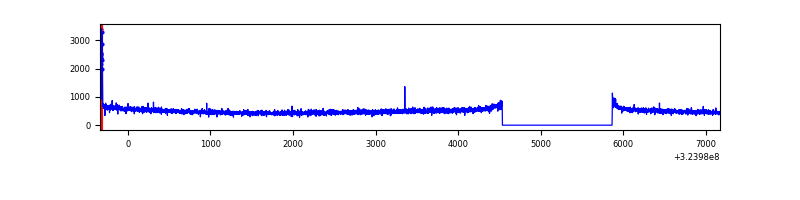 |
| D | 7505 | 6176 | 35 | 35 | 0.47% | 0.57% | 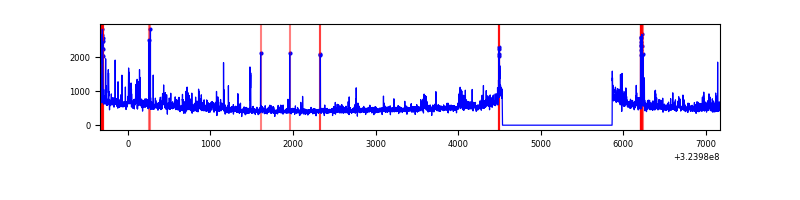 |
Top three noisy pixels from each quadrant. If the there are fewer than three noisy pixels in the level2.evt file, extra rows are filled as -1
| Pixel properties | Quadrant properties | ||||||
|---|---|---|---|---|---|---|---|
| Quadrant | DetID | PixID | Counts | Sigma | Mean | Median | Sigma |
| A | 14 | 111 | 61151 | 383.22 | 795 | 780 | 157.5 |
| A | 13 | 254 | 10093 | 59.12 | 795 | 780 | 157.5 |
| A | 0 | 226 | 6994 | 39.45 | 795 | 780 | 157.5 |
| B | 3 | 64 | 28810 | 188.87 | 800 | 782 | 148.4 |
| B | 7 | 202 | 24288 | 158.4 | 800 | 782 | 148.4 |
| B | 12 | 111 | 17181 | 110.51 | 800 | 782 | 148.4 |
| C | 14 | 238 | 122252 | 705.42 | 750 | 758 | 172.2 |
| C | 0 | 10 | 57560 | 329.8 | 750 | 758 | 172.2 |
| C | 13 | 61 | 5303 | 26.39 | 750 | 758 | 172.2 |
| D | 1 | 52 | 287198 | 1594.72 | 749 | 728 | 179.6 |
| D | 8 | 195 | 217180 | 1204.94 | 749 | 728 | 179.6 |
| D | 12 | 218 | 63486 | 349.36 | 749 | 728 | 179.6 |
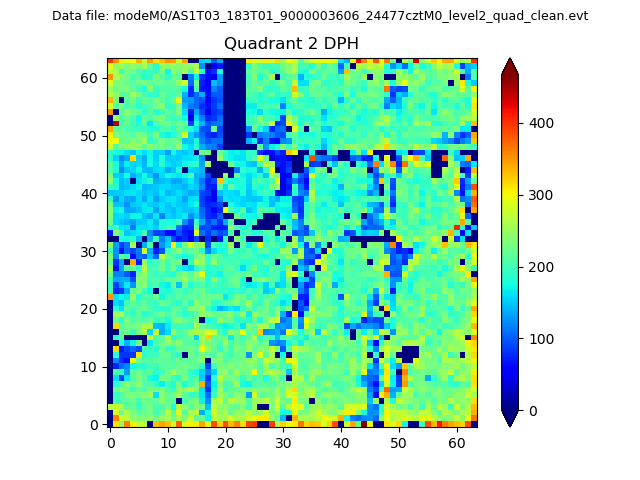
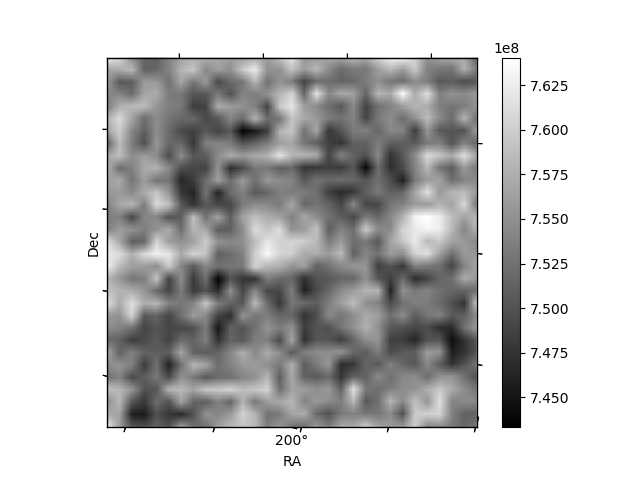
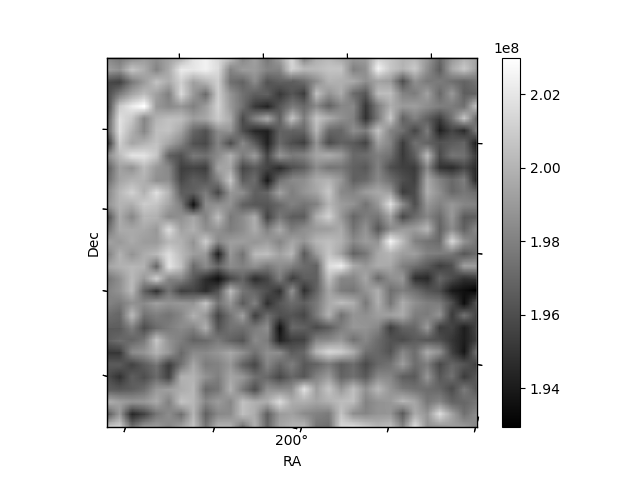
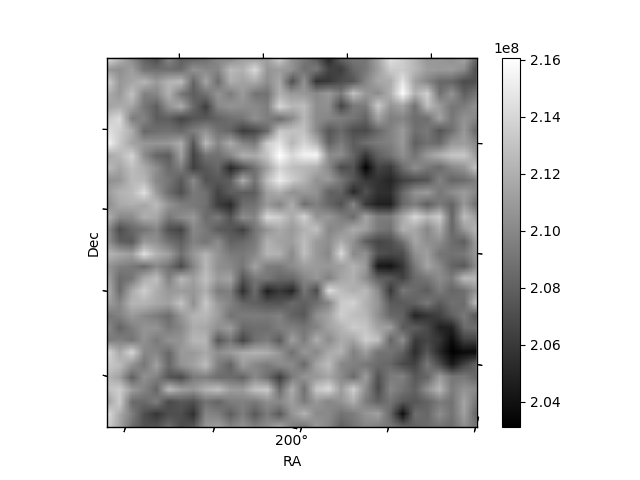
Histogram calculated using DETX and DETY for each event in the final _common_clean file
| Quadrant A | 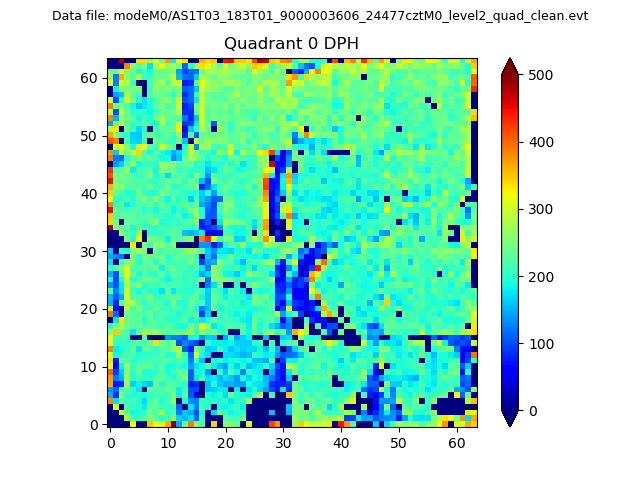 |
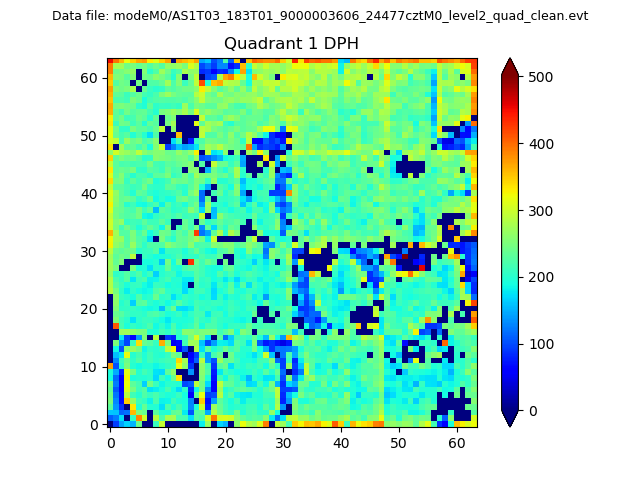 |
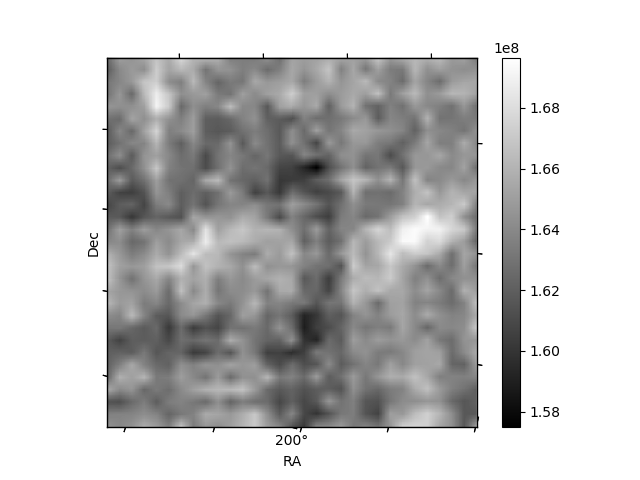
Quadrant B |
|---|---|---|---|
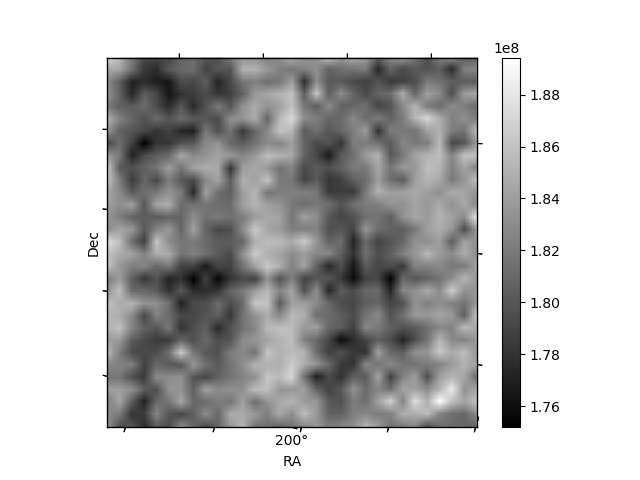
| Quadrant D | 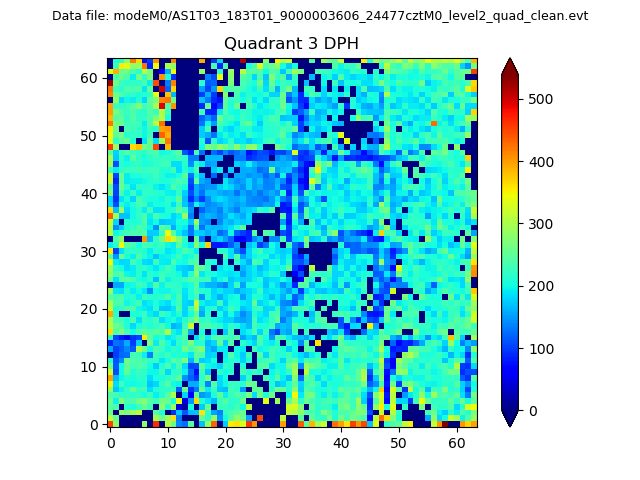 |
 |
Quadrant C |
| Plot type | Count rate plots | Images |
|---|---|---|
| Comparison with Poisson distribution Blue bars denote a histogram of data divided into 1 sec bins. Red curve is a Poisson curve with rate = median count rate of data. |
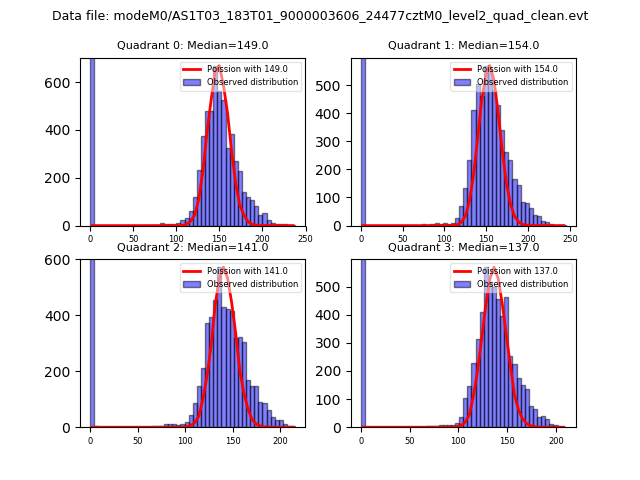 |
 |
| Quadrant-wise count rates Data is divided into 100 sec bins |
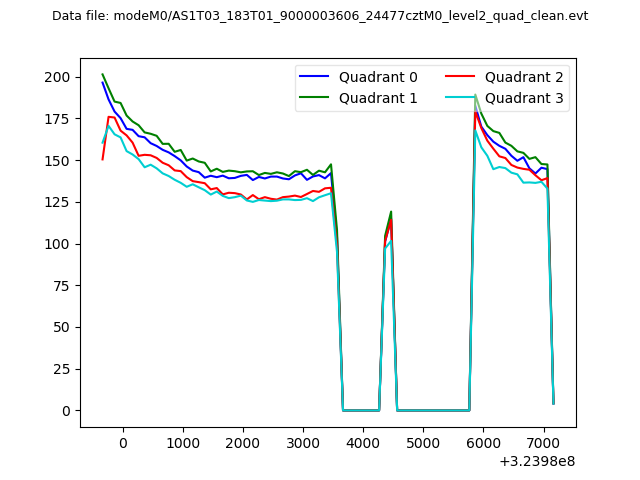 |
|
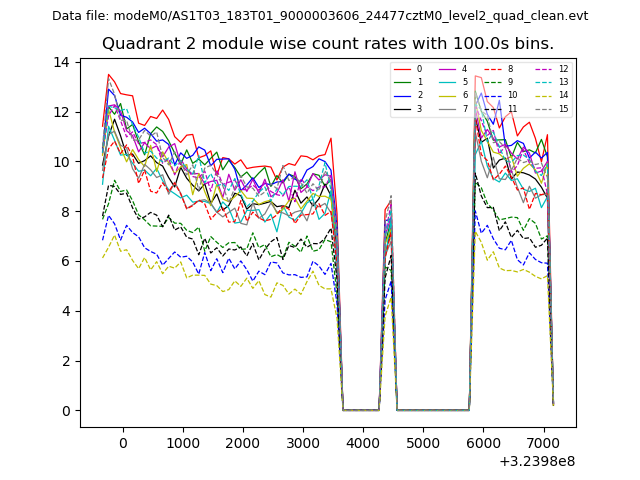
| Module-wise count rates for Quadrant A Data is divided into 100 sec bins |
 |
 |
| Module-wise count rates for Quadrant B Data is divided into 100 sec bins |
 |
 |
| Module-wise count rates for Quadrant C Data is divided into 100 sec bins |
 |
 |
| Module-wise count rates for Quadrant D Data is divided into 100 sec bins |
 |
 |
| Parameter | Plot |
|---|---|
| CZT HV Monitor |  |
| D_VDD | 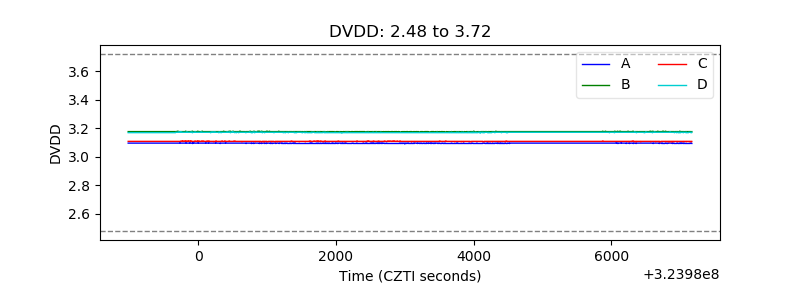 |
| Temperature 1 | 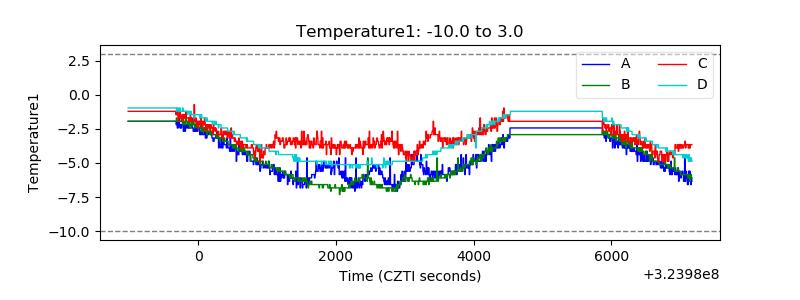 |
| Veto HV Monitor | 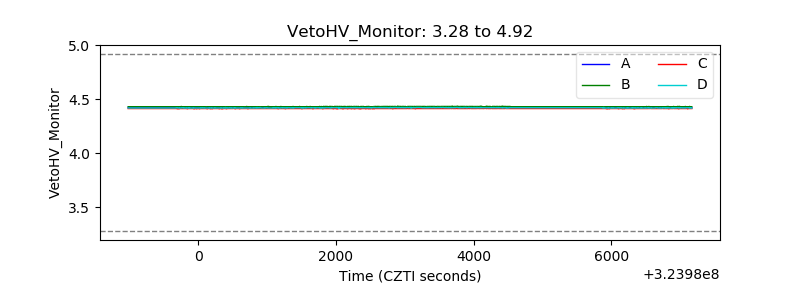 |
| Veto LLD | 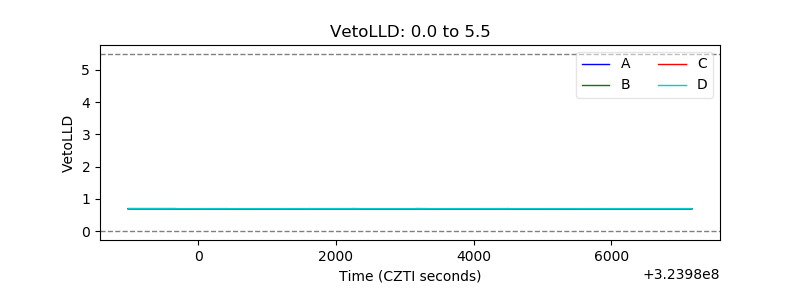 |
| Alpha Counter | 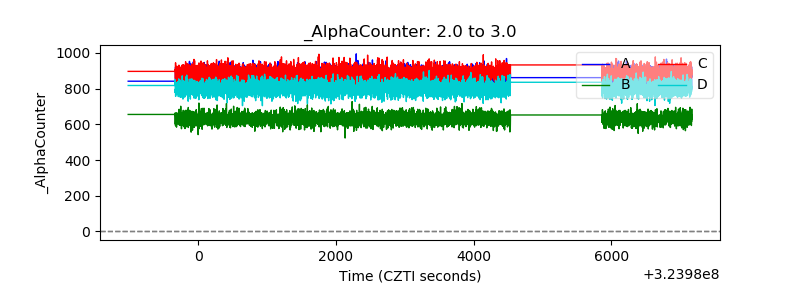 |
| _CPM_Rate | 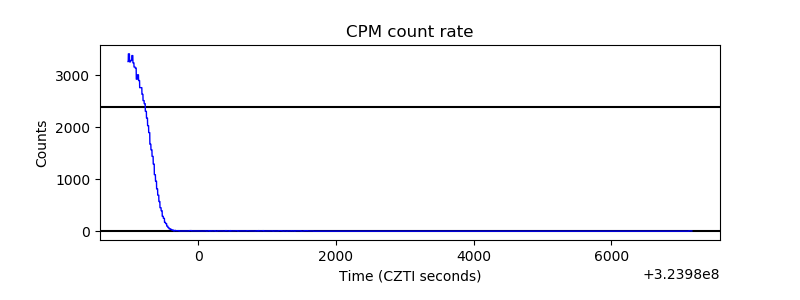 |
| CZT Counter | 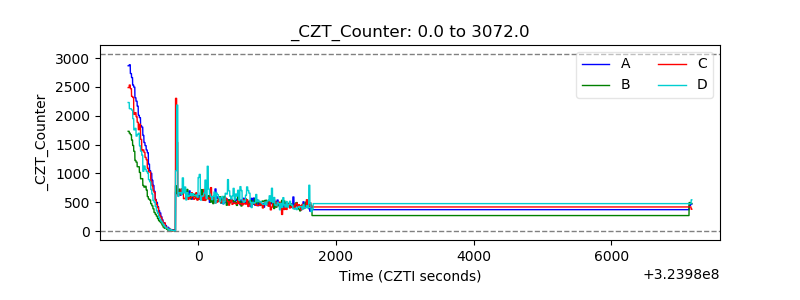 |
| +2.5 Volts monitor | 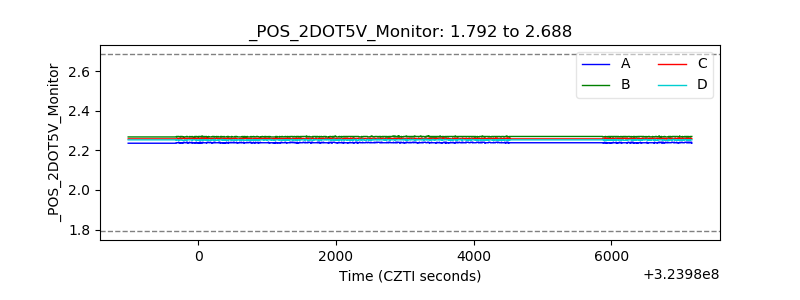 |
| +5 Volts monitor | 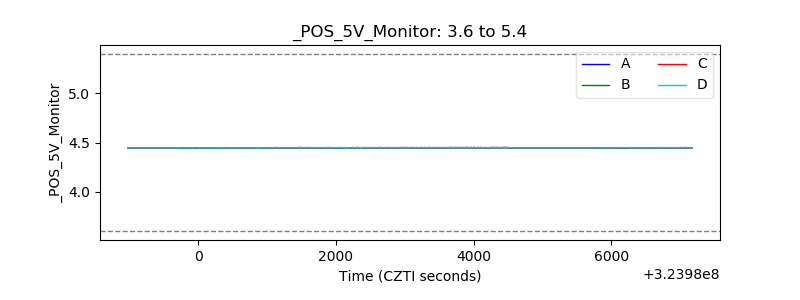 |
| _ROLL_ROT |  |
| _Roll_DEC | 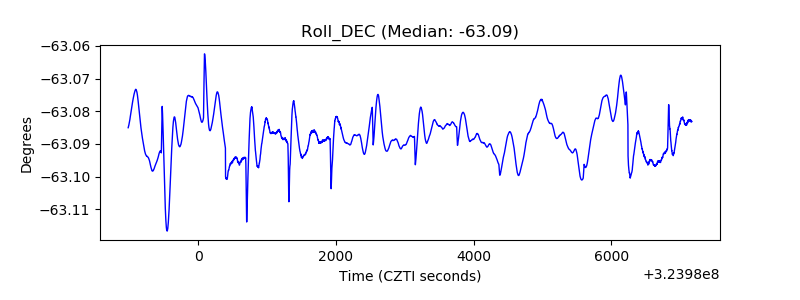 |
| _Roll_RA | 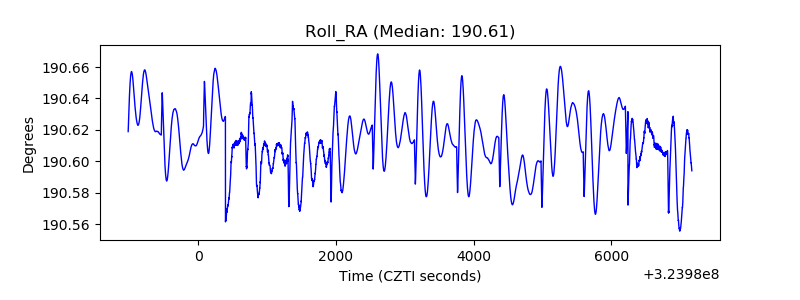 |
| Veto Counter | 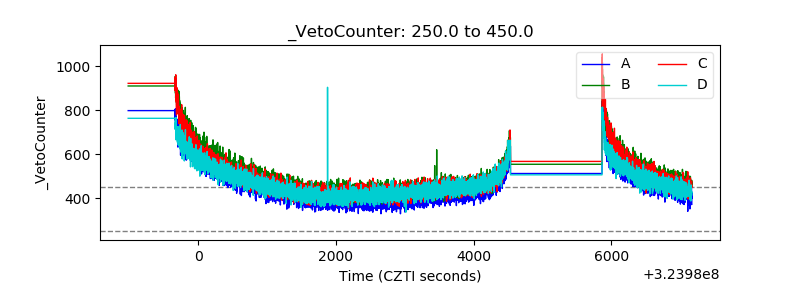 |