| Param | Original file | Final file |
|---|---|---|
| Filename | modeM0/AS1T03_183T01_9000003606_24480cztM0_level2.evt | modeM0/AS1T03_183T01_9000003606_24480cztM0_level2_quad_clean.evt |
| Size (bytes) | 994,020,480 | 213,459,840 |
| Size | 948.0 MB | 203.6 MB |
| Events in quadrant A | 7,403,281 | 1,429,401 |
| Events in quadrant B | 6,106,132 | 1,478,385 |
| Events in quadrant C | 6,354,834 | 1,382,085 |
| Events in quadrant D | 9,394,576 | 1,310,853 |
| Mode M0 | |||
|---|---|---|---|
| Quadrant | BADHDUFLAG | Total packets | Discarded packets |
| A | 0 | 30419 | 3 |
| B | 0 | 26279 | 3 |
| C | 0 | 26936 | 3 |
| D | 0 | 36494 | 3 |
| Mode SS | |||
|---|---|---|---|
| Quadrant | BADHDUFLAG | Total packets | Discarded packets |
| A | 0 | 252 | 0 |
| B | 0 | 252 | 0 |
| C | 0 | 252 | 0 |
| D | 0 | 252 | 0 |
| Mode M9 | |||
|---|---|---|---|
| Quadrant | BADHDUFLAG | Total packets | Discarded packets |
| A | 0 | 22 | 0 |
| B | 0 | 23 | 0 |
| C | 0 | 23 | 0 |
| D | 0 | 23 | 0 |
| Quadrant | Total seconds | Saturated seconds | Saturation percentage |
|---|---|---|---|
| A | 12516 | 341 | 2.724513% |
| B | 12516 | 70 | 0.559284% |
| C | 12516 | 248 | 1.981464% |
| D | 12516 | 587 | 4.689997% |
Noise dominated data is calculated using 1-second bins in cleaned event files. If a bin has >2000 counts, and if more than 50% of those come from <1% of pixels, then it is considered to be noise-dominated and hence unusable.
| Quadrant | # 1 sec bins | Bins with >0 counts | Bins with >2000 counts | High rate bins dominated by noise | Noise dominated (total time) | Noise dominated (detector-on time) | Marked lightcurve |
|---|---|---|---|---|---|---|---|
| A | 14096 | 12518 | 148 | 148 | 1.05% | 1.18% | 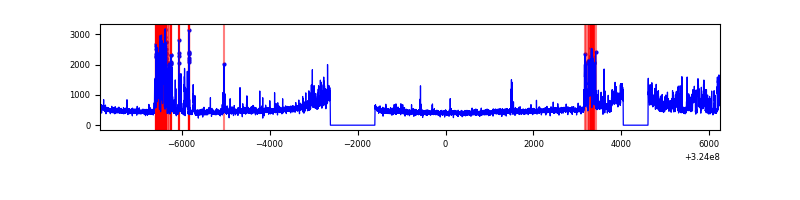 |
| B | 14096 | 12518 | 22 | 22 | 0.16% | 0.18% | 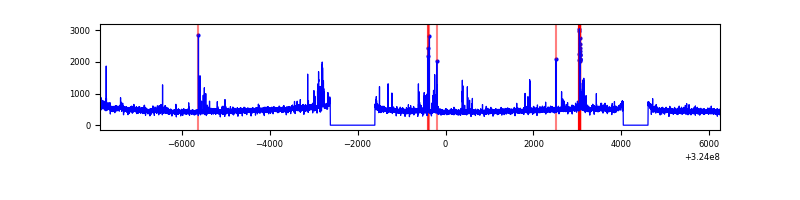 |
| C | 14096 | 12518 | 111 | 111 | 0.79% | 0.89% | 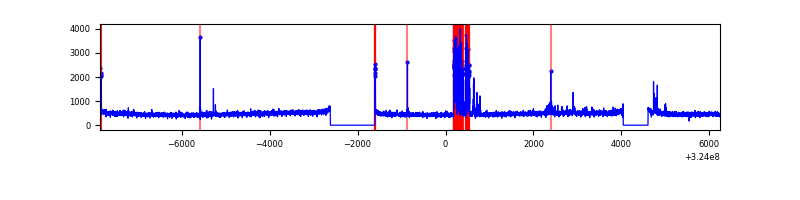 |
| D | 14096 | 12518 | 543 | 543 | 3.85% | 4.34% | 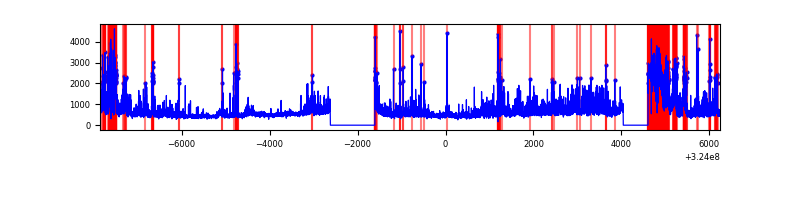 |
Top three noisy pixels from each quadrant. If the there are fewer than three noisy pixels in the level2.evt file, extra rows are filled as -1
| Pixel properties | Quadrant properties | ||||||
|---|---|---|---|---|---|---|---|
| Quadrant | DetID | PixID | Counts | Sigma | Mean | Median | Sigma |
| A | 14 | 111 | 1713205 | 5880.7 | 1464 | 1435 | 291.1 |
| A | 4 | 2 | 42321 | 140.46 | 1464 | 1435 | 291.1 |
| A | 13 | 254 | 19860 | 63.3 | 1464 | 1435 | 291.1 |
| B | 3 | 64 | 104905 | 374.93 | 1481 | 1444 | 275.9 |
| B | 0 | 190 | 88252 | 314.58 | 1481 | 1444 | 275.9 |
| B | 12 | 17 | 47308 | 166.21 | 1481 | 1444 | 275.9 |
| C | 2 | 16 | 521347 | 1595.95 | 1414 | 1420 | 325.8 |
| C | 14 | 238 | 228978 | 698.51 | 1414 | 1420 | 325.8 |
| C | 0 | 10 | 52600 | 157.1 | 1414 | 1420 | 325.8 |
| D | 8 | 195 | 1782547 | 5316.09 | 1395 | 1355 | 335.1 |
| D | 12 | 218 | 1403843 | 4185.82 | 1395 | 1355 | 335.1 |
| D | 1 | 52 | 896555 | 2671.79 | 1395 | 1355 | 335.1 |
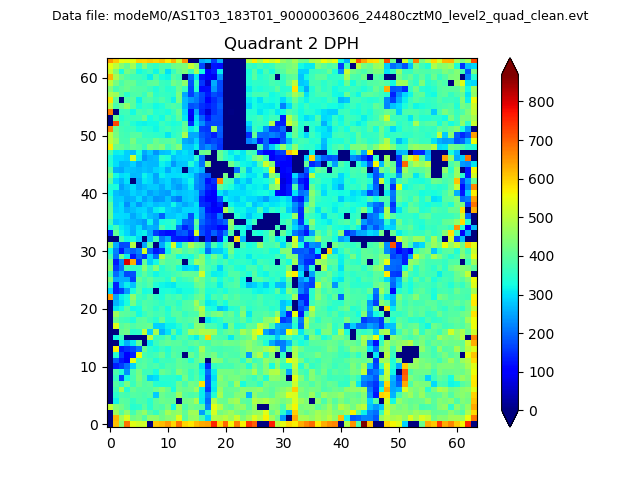
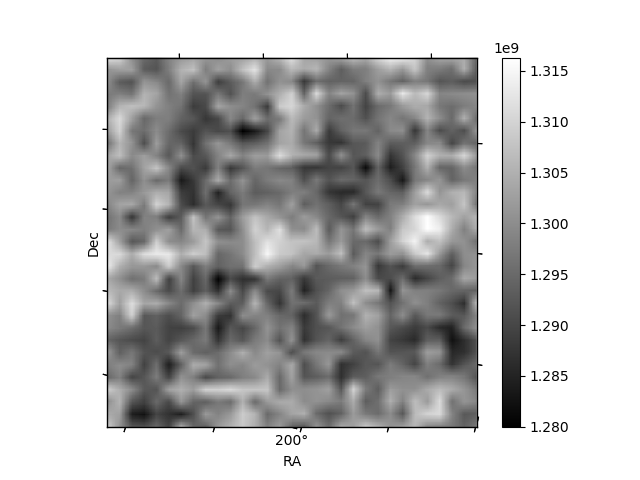
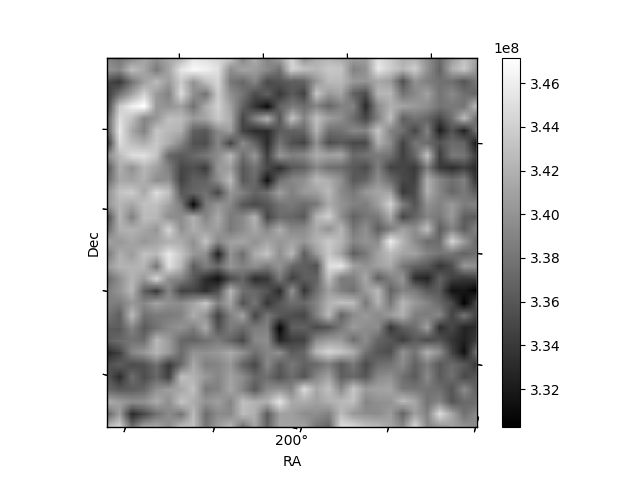
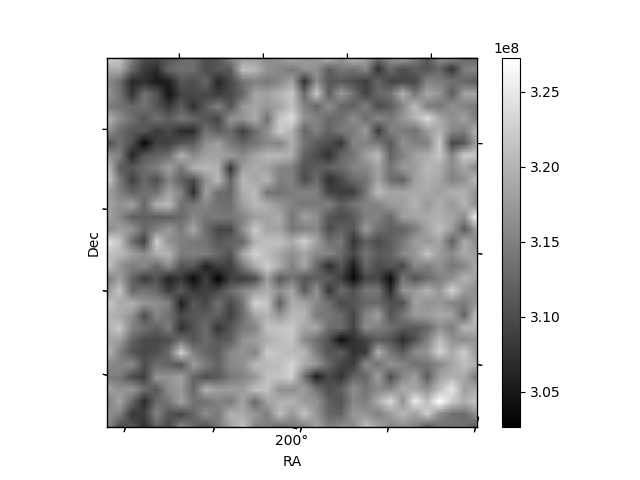
Histogram calculated using DETX and DETY for each event in the final _common_clean file
| Quadrant A | 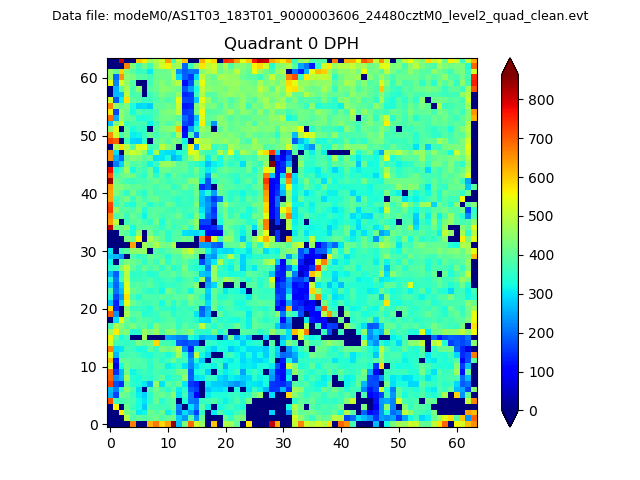 |
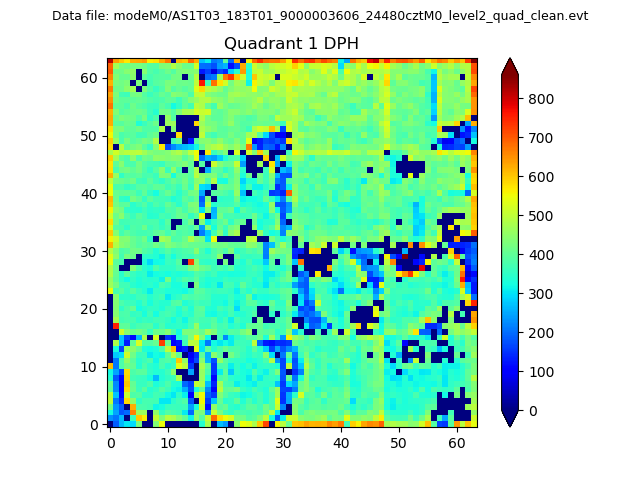 |
Quadrant B |
|---|---|---|---|
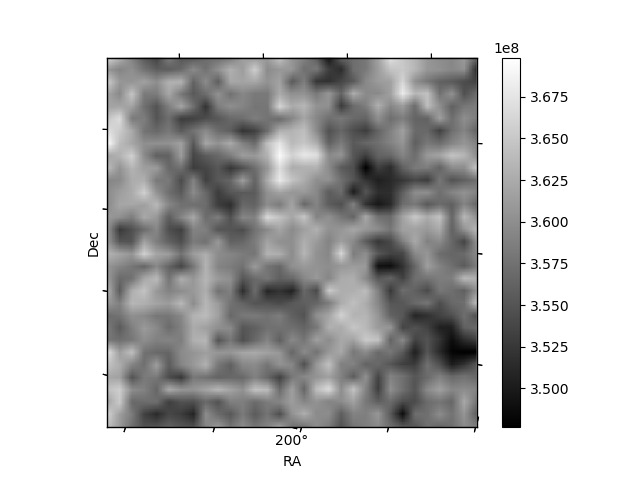
| Quadrant D | 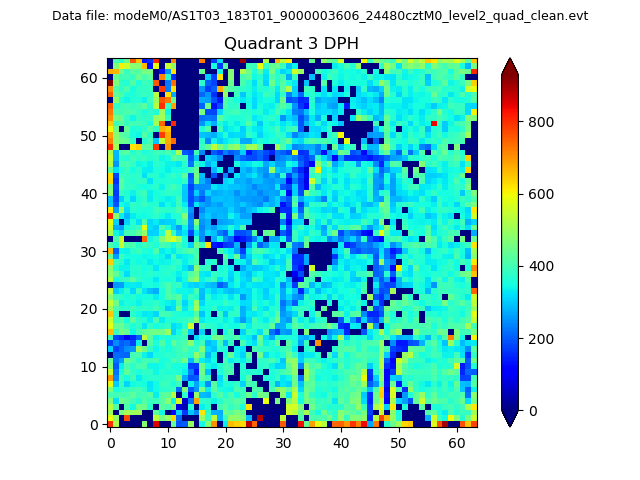 |
 |
Quadrant C |
| Plot type | Count rate plots | Images |
|---|---|---|
| Comparison with Poisson distribution Blue bars denote a histogram of data divided into 1 sec bins. Red curve is a Poisson curve with rate = median count rate of data. |
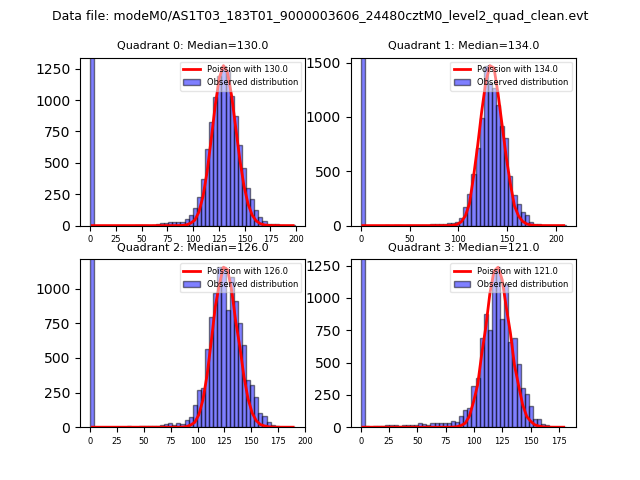 |
 |
| Quadrant-wise count rates Data is divided into 100 sec bins |
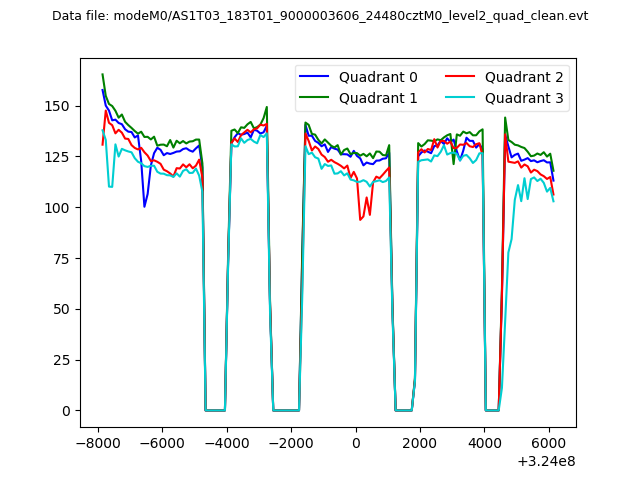 |
|
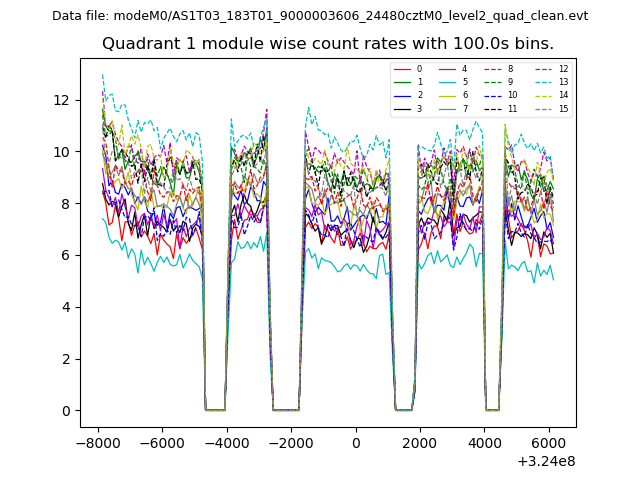
| Module-wise count rates for Quadrant A Data is divided into 100 sec bins |
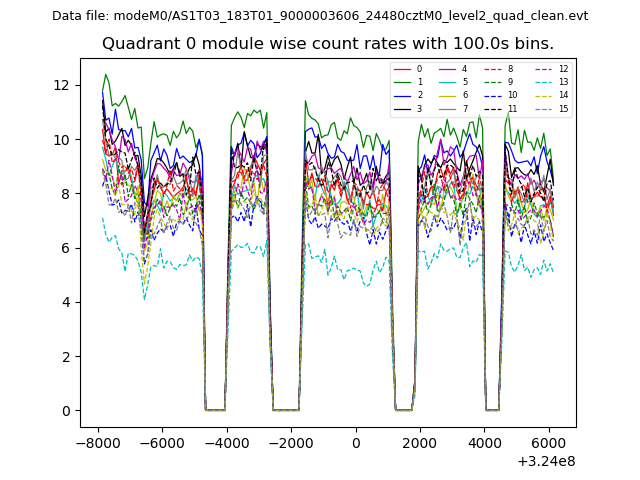 |
 |
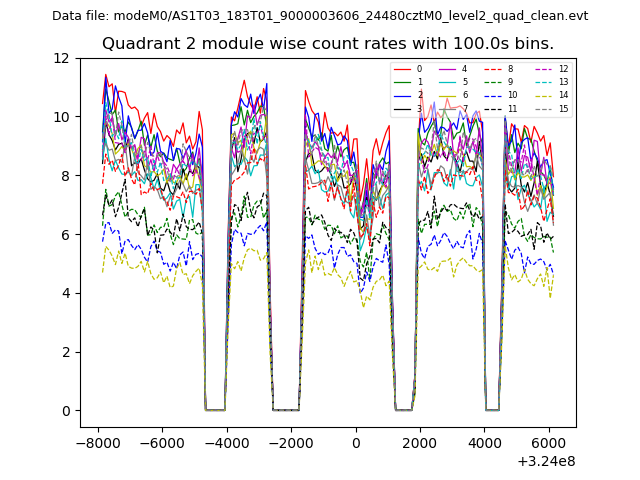
| Module-wise count rates for Quadrant B Data is divided into 100 sec bins |
 |
 |
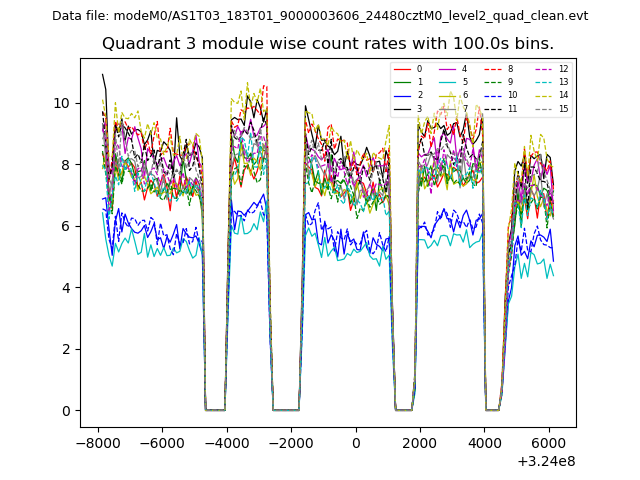
| Module-wise count rates for Quadrant C Data is divided into 100 sec bins |
 |
 |
| Module-wise count rates for Quadrant D Data is divided into 100 sec bins |
 |
 |
| Parameter | Plot |
|---|---|
| CZT HV Monitor | 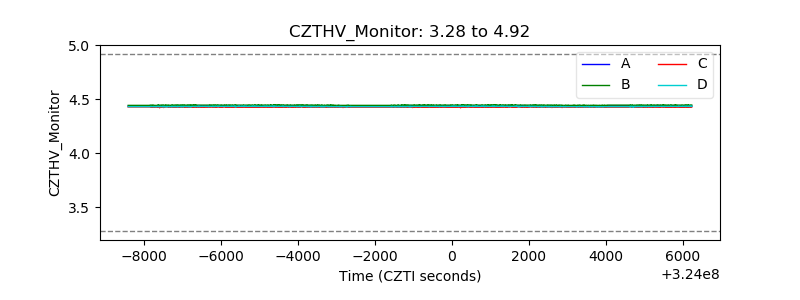 |
| D_VDD | 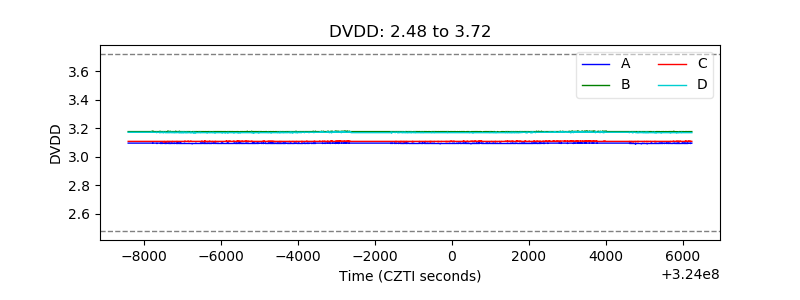 |
| Temperature 1 |  |
| Veto HV Monitor |  |
| Veto LLD | 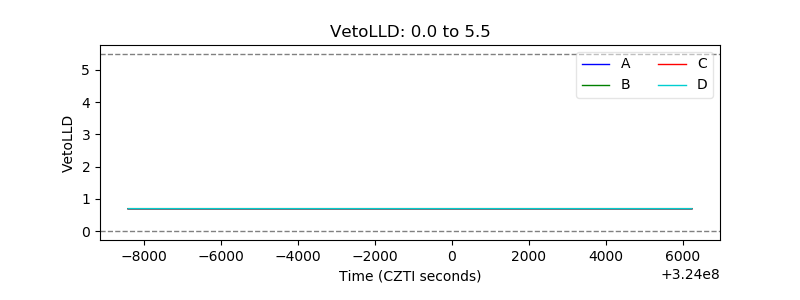 |
| Alpha Counter | 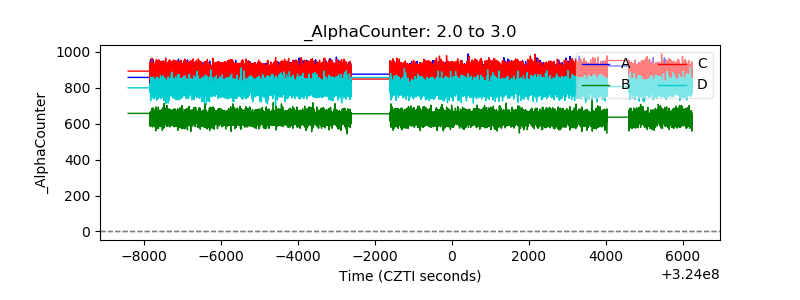 |
| _CPM_Rate | 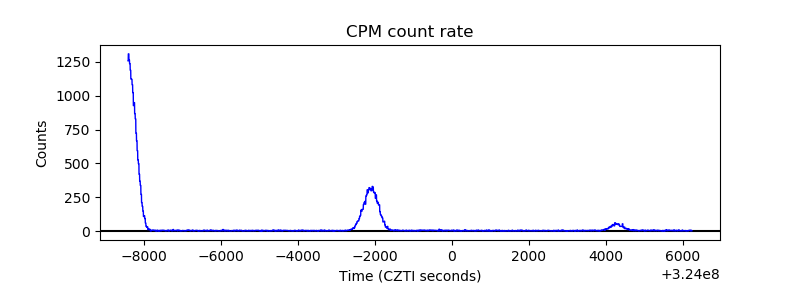 |
| CZT Counter | 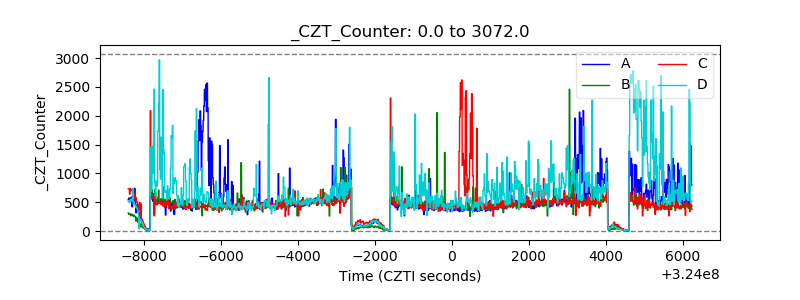 |
| +2.5 Volts monitor |  |
| +5 Volts monitor |  |
| _ROLL_ROT |  |
| _Roll_DEC | 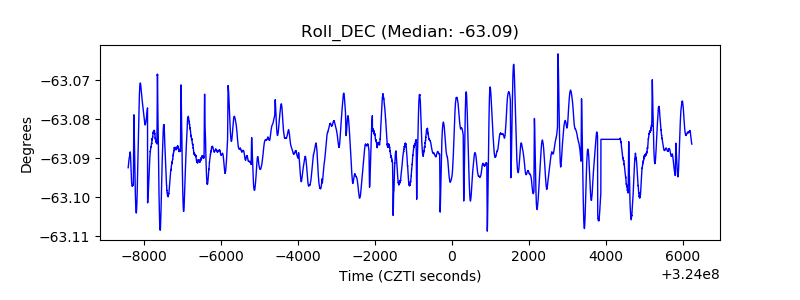 |
| _Roll_RA | 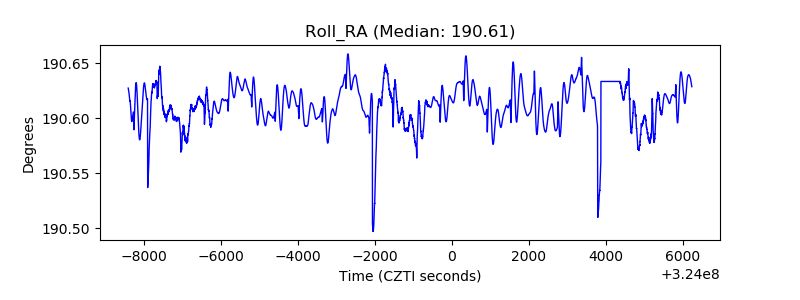 |
| Veto Counter | 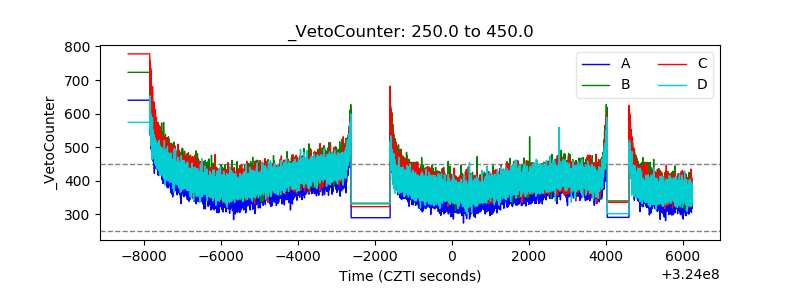 |