| Param | Original file | Final file |
|---|---|---|
| Filename | modeM0/AS1T03_183T01_9000003606_24481cztM0_level2.evt | modeM0/AS1T03_183T01_9000003606_24481cztM0_level2_quad_clean.evt |
| Size (bytes) | 652,006,080 | 137,280,960 |
| Size | 621.8 MB | 130.9 MB |
| Events in quadrant A | 4,541,320 | 923,905 |
| Events in quadrant B | 3,811,947 | 948,138 |
| Events in quadrant C | 3,855,400 | 894,222 |
| Events in quadrant D | 6,992,104 | 831,606 |
| Mode M0 | |||
|---|---|---|---|
| Quadrant | BADHDUFLAG | Total packets | Discarded packets |
| A | 0 | 18758 | 3 |
| B | 0 | 16616 | 3 |
| C | 0 | 16670 | 3 |
| D | 0 | 26299 | 3 |
| Mode SS | |||
|---|---|---|---|
| Quadrant | BADHDUFLAG | Total packets | Discarded packets |
| A | 0 | 164 | 0 |
| B | 0 | 164 | 0 |
| C | 0 | 164 | 0 |
| D | 0 | 164 | 0 |
| Mode M9 | |||
|---|---|---|---|
| Quadrant | BADHDUFLAG | Total packets | Discarded packets |
| A | 0 | 8 | 0 |
| B | 0 | 8 | 0 |
| C | 0 | 8 | 0 |
| D | 0 | 8 | 0 |
| Quadrant | Total seconds | Saturated seconds | Saturation percentage |
|---|---|---|---|
| A | 8054 | 153 | 1.899677% |
| B | 8055 | 159 | 1.973929% |
| C | 8055 | 194 | 2.408442% |
| D | 8055 | 657 | 8.156425% |
Noise dominated data is calculated using 1-second bins in cleaned event files. If a bin has >2000 counts, and if more than 50% of those come from <1% of pixels, then it is considered to be noise-dominated and hence unusable.
| Quadrant | # 1 sec bins | Bins with >0 counts | Bins with >2000 counts | High rate bins dominated by noise | Noise dominated (total time) | Noise dominated (detector-on time) | Marked lightcurve |
|---|---|---|---|---|---|---|---|
| A | 8839 | 8057 | 0 | 0 | 0.00% | 0.00% | 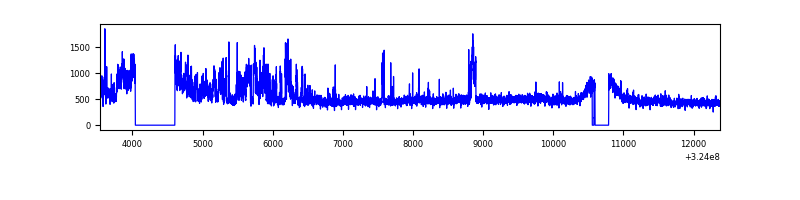 |
| B | 8840 | 8058 | 1 | 1 | 0.01% | 0.01% | 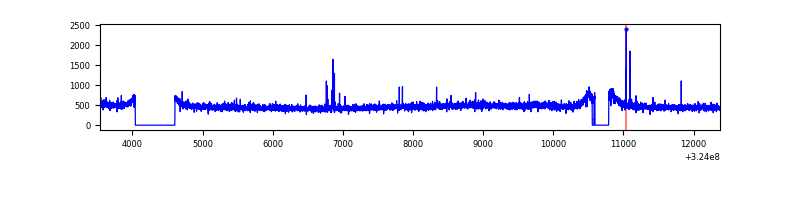 |
| C | 8840 | 8058 | 0 | 0 | 0.00% | 0.00% | 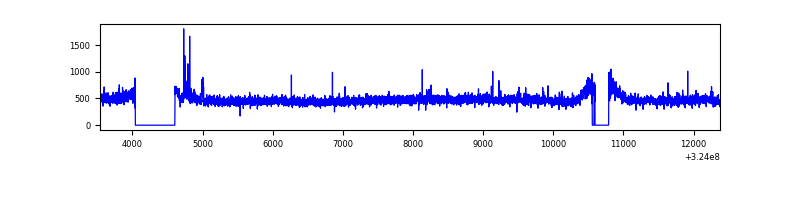 |
| D | 8840 | 8058 | 503 | 503 | 5.69% | 6.24% | 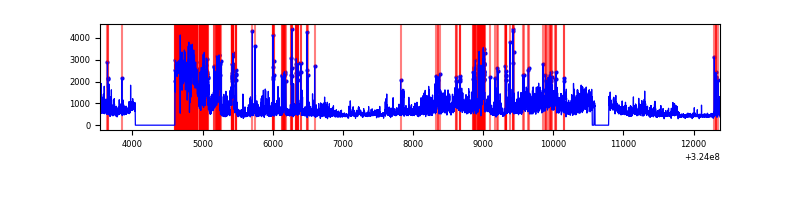 |
Top three noisy pixels from each quadrant. If the there are fewer than three noisy pixels in the level2.evt file, extra rows are filled as -1
| Pixel properties | Quadrant properties | ||||||
|---|---|---|---|---|---|---|---|
| Quadrant | DetID | PixID | Counts | Sigma | Mean | Median | Sigma |
| A | 14 | 111 | 834100 | 4347.49 | 952 | 933 | 191.6 |
| A | 4 | 2 | 29992 | 151.63 | 952 | 933 | 191.6 |
| A | 13 | 254 | 12288 | 59.25 | 952 | 933 | 191.6 |
| B | 3 | 64 | 29660 | 157.07 | 961 | 935 | 182.9 |
| B | 12 | 111 | 22806 | 119.59 | 961 | 935 | 182.9 |
| B | 11 | 111 | 19893 | 103.66 | 961 | 935 | 182.9 |
| C | 14 | 238 | 146665 | 682.49 | 917 | 919 | 213.5 |
| C | 7 | 247 | 73779 | 341.18 | 917 | 919 | 213.5 |
| C | 2 | 16 | 56344 | 259.54 | 917 | 919 | 213.5 |
| D | 8 | 195 | 1599814 | 7332.42 | 895 | 865 | 218.1 |
| D | 12 | 218 | 1290383 | 5913.44 | 895 | 865 | 218.1 |
| D | 1 | 52 | 512245 | 2345.07 | 895 | 865 | 218.1 |
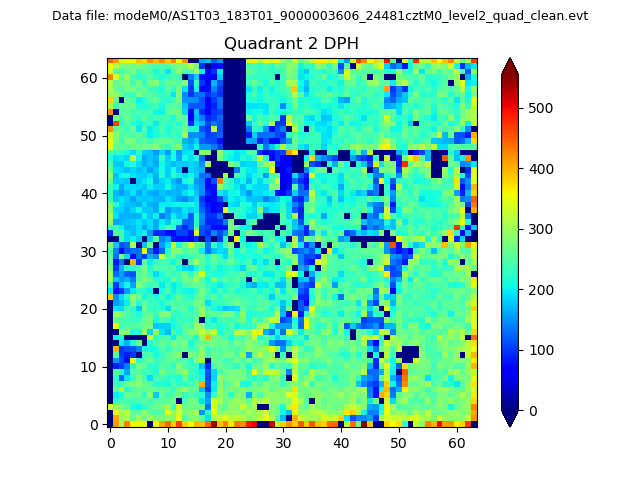
Histogram calculated using DETX and DETY for each event in the final _common_clean file
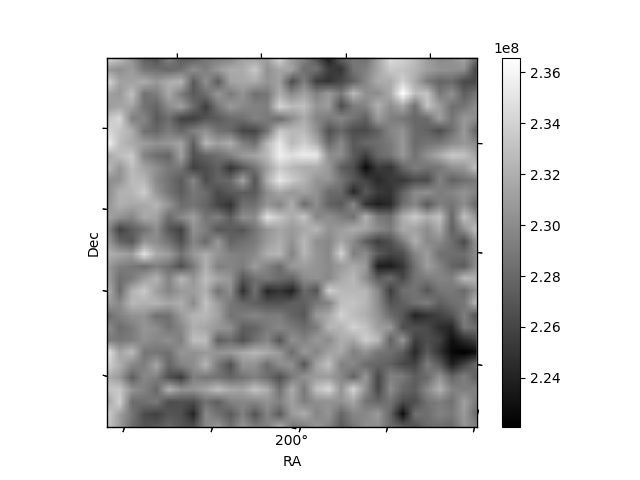
| Quadrant A | 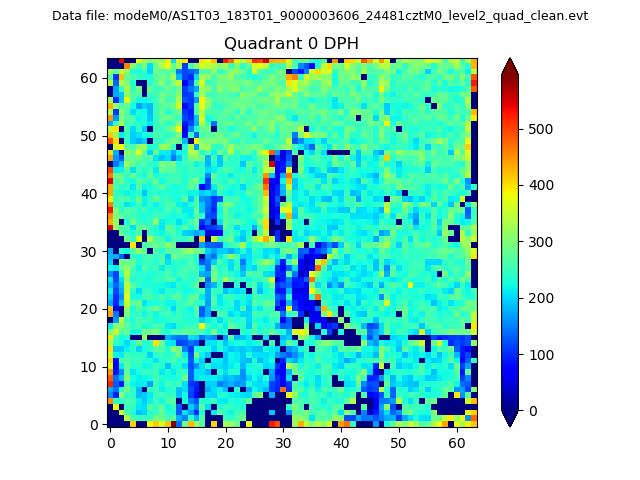 |
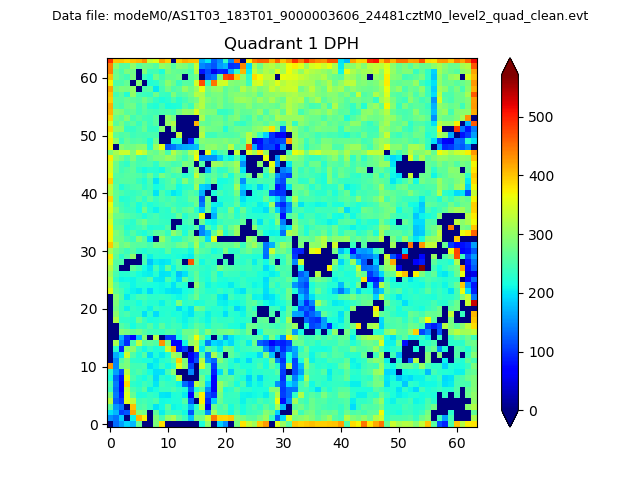 |
Quadrant B |
|---|---|---|---|
| Quadrant D | 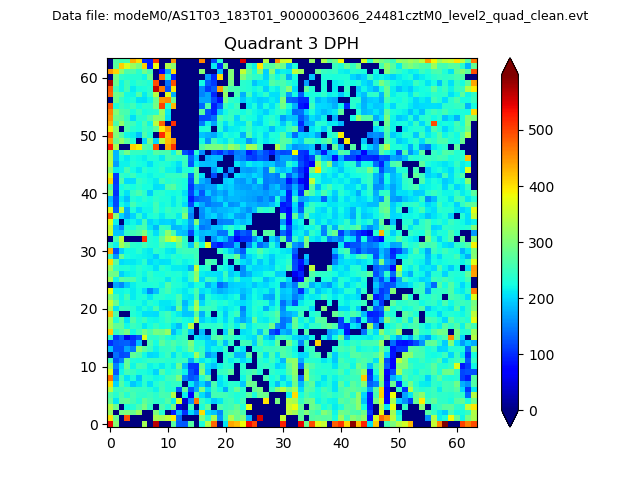 |
 |
Quadrant C |
| Plot type | Count rate plots | Images |
|---|---|---|
| Comparison with Poisson distribution Blue bars denote a histogram of data divided into 1 sec bins. Red curve is a Poisson curve with rate = median count rate of data. |
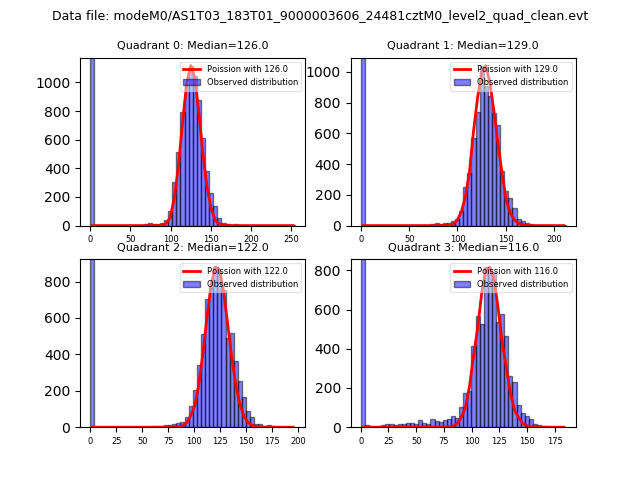 |
 |
| Quadrant-wise count rates Data is divided into 100 sec bins |
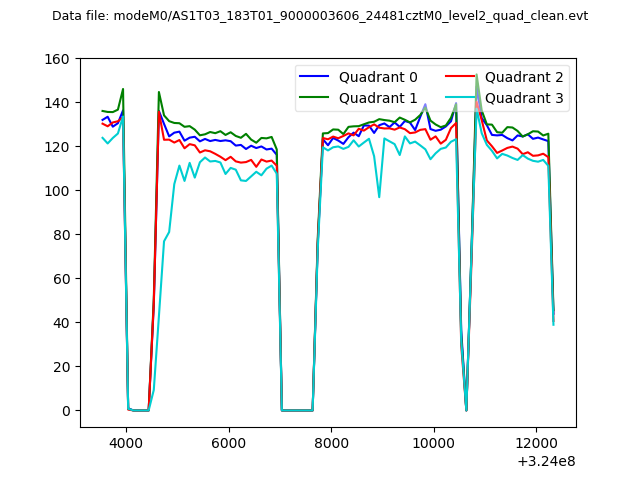 |
|
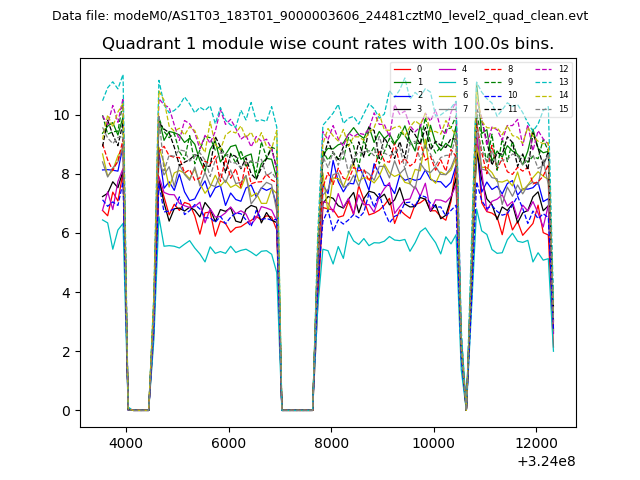
| Module-wise count rates for Quadrant A Data is divided into 100 sec bins |
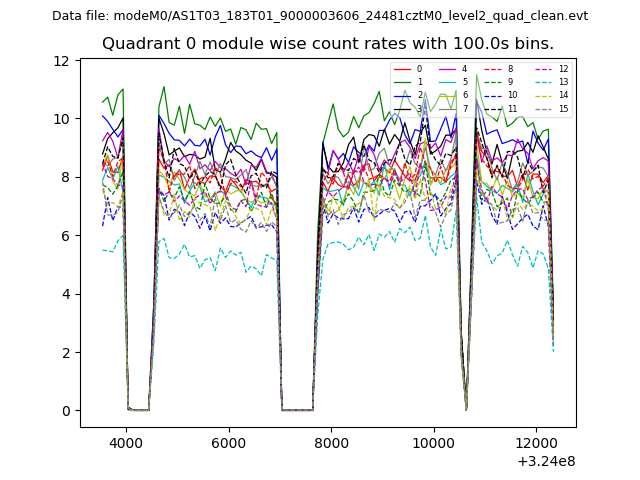 |
 |
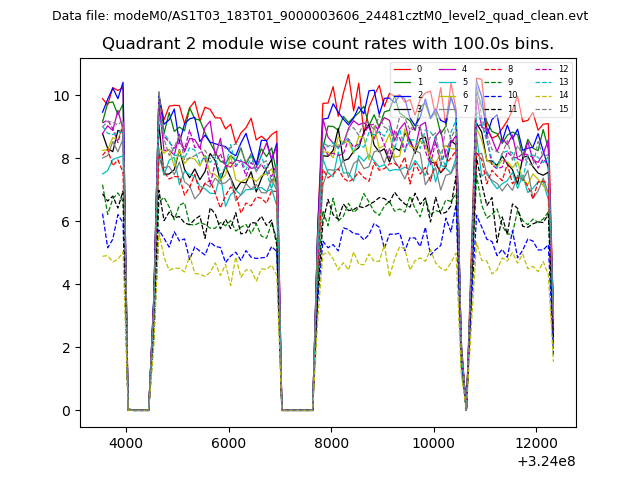
| Module-wise count rates for Quadrant B Data is divided into 100 sec bins |
 |
 |
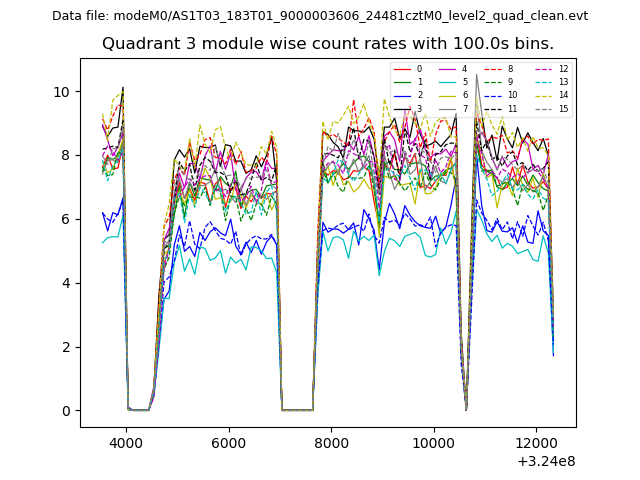
| Module-wise count rates for Quadrant C Data is divided into 100 sec bins |
 |
 |
| Module-wise count rates for Quadrant D Data is divided into 100 sec bins |
 |
 |
| Parameter | Plot |
|---|---|
| CZT HV Monitor | 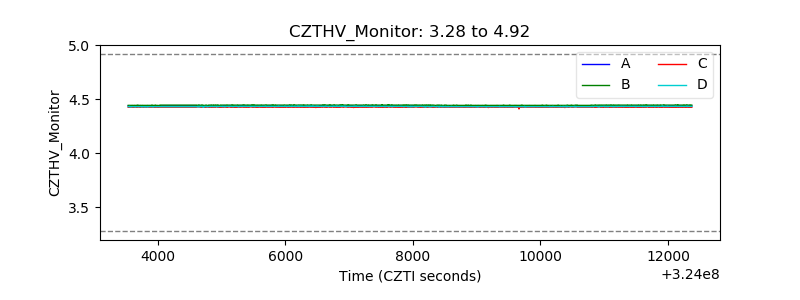 |
| D_VDD | 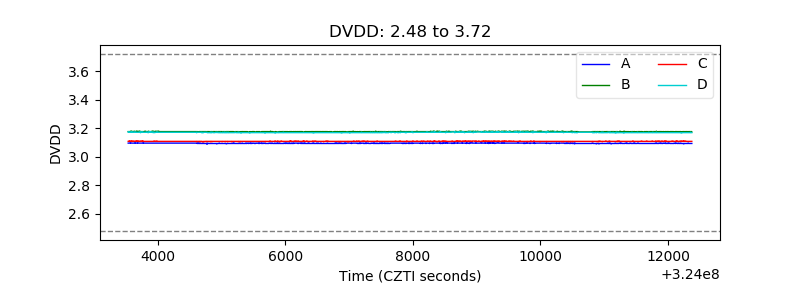 |
| Temperature 1 | 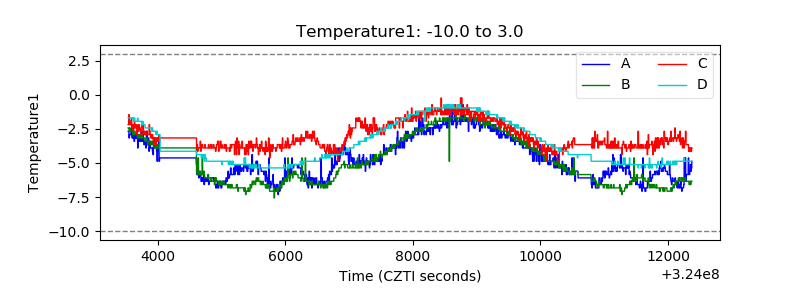 |
| Veto HV Monitor | 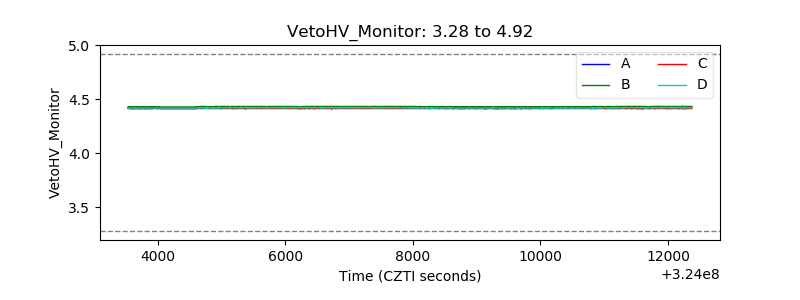 |
| Veto LLD |  |
| Alpha Counter | 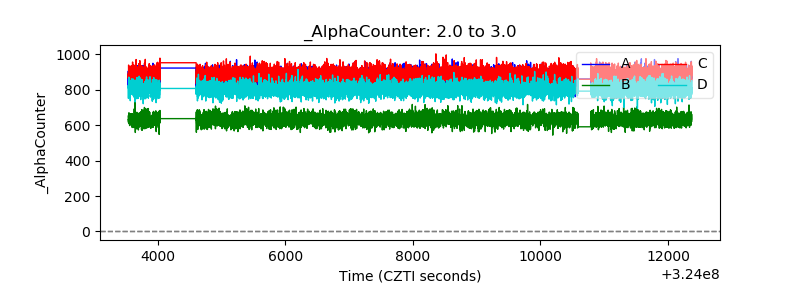 |
| _CPM_Rate | 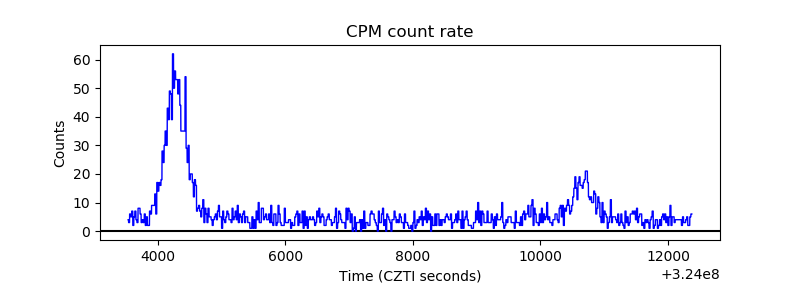 |
| CZT Counter |  |
| +2.5 Volts monitor |  |
| +5 Volts monitor | 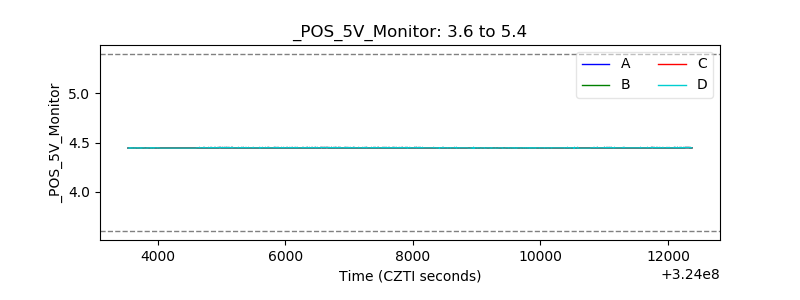 |
| _ROLL_ROT | 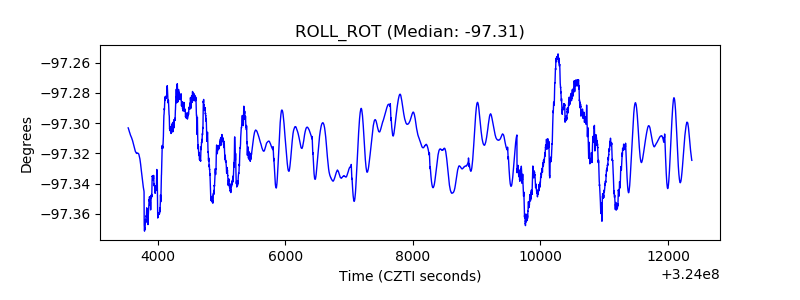 |
| _Roll_DEC | 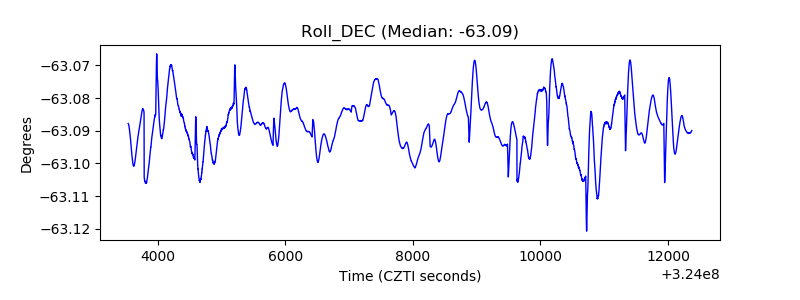 |
| _Roll_RA | 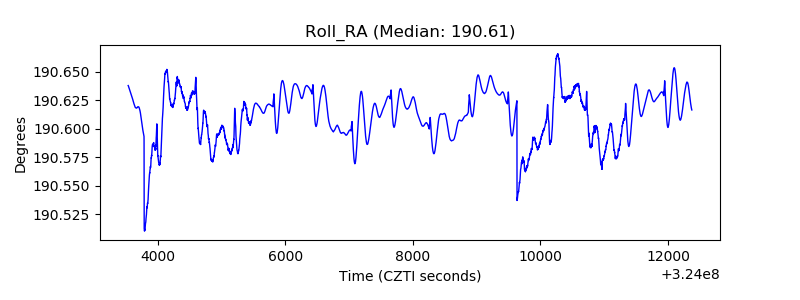 |
| Veto Counter | 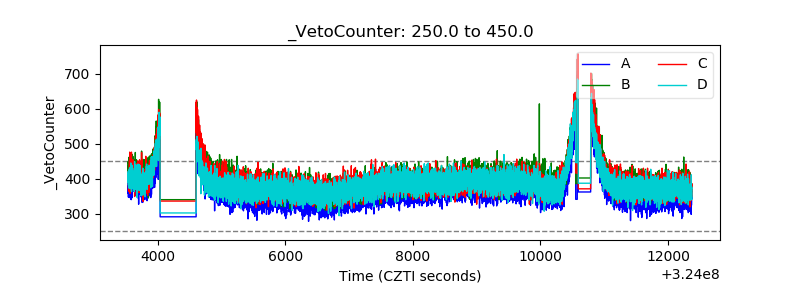 |