| Param | Original file | Final file |
|---|---|---|
| Filename | modeM0/AS1T03_183T01_9000003606_24482cztM0_level2.evt | modeM0/AS1T03_183T01_9000003606_24482cztM0_level2_quad_clean.evt |
| Size (bytes) | 512,038,080 | 126,679,680 |
| Size | 488.3 MB | 120.8 MB |
| Events in quadrant A | 3,530,811 | 842,535 |
| Events in quadrant B | 3,752,374 | 861,493 |
| Events in quadrant C | 3,581,167 | 814,828 |
| Events in quadrant D | 4,133,280 | 795,945 |
| Mode M0 | |||
|---|---|---|---|
| Quadrant | BADHDUFLAG | Total packets | Discarded packets |
| A | 0 | 15361 | 1 |
| B | 0 | 16000 | 1 |
| C | 0 | 15316 | 1 |
| D | 0 | 17316 | 1 |
| Mode SS | |||
|---|---|---|---|
| Quadrant | BADHDUFLAG | Total packets | Discarded packets |
| A | 0 | 152 | 0 |
| B | 0 | 152 | 0 |
| C | 0 | 152 | 0 |
| D | 0 | 152 | 0 |
| Mode M9 | |||
|---|---|---|---|
| Quadrant | BADHDUFLAG | Total packets | Discarded packets |
| A | 0 | 3 | 0 |
| B | 0 | 3 | 0 |
| C | 0 | 3 | 0 |
| D | 0 | 3 | 0 |
| Quadrant | Total seconds | Saturated seconds | Saturation percentage |
|---|---|---|---|
| A | 7503 | 62 | 0.826336% |
| B | 7503 | 129 | 1.719312% |
| C | 7503 | 104 | 1.386112% |
| D | 7504 | 62 | 0.826226% |
Noise dominated data is calculated using 1-second bins in cleaned event files. If a bin has >2000 counts, and if more than 50% of those come from <1% of pixels, then it is considered to be noise-dominated and hence unusable.
| Quadrant | # 1 sec bins | Bins with >0 counts | Bins with >2000 counts | High rate bins dominated by noise | Noise dominated (total time) | Noise dominated (detector-on time) | Marked lightcurve |
|---|---|---|---|---|---|---|---|
| A | 7818 | 7504 | 1 | 1 | 0.01% | 0.01% | 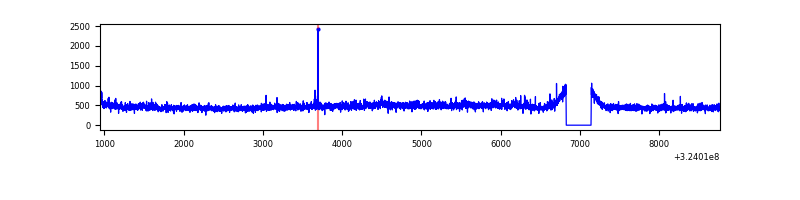 |
| B | 7818 | 7504 | 29 | 29 | 0.37% | 0.39% | 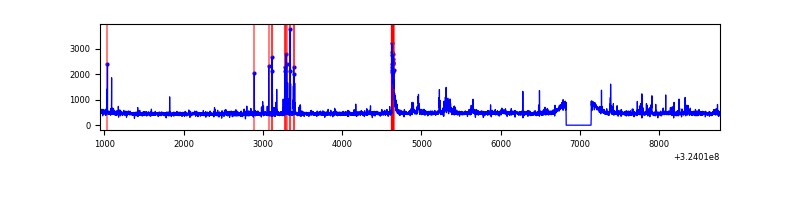 |
| C | 7818 | 7504 | 0 | 0 | 0.00% | 0.00% | 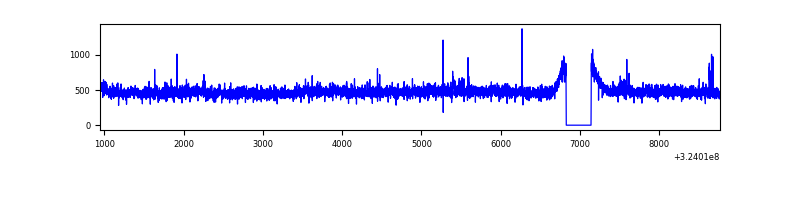 |
| D | 7819 | 7505 | 9 | 9 | 0.12% | 0.12% | 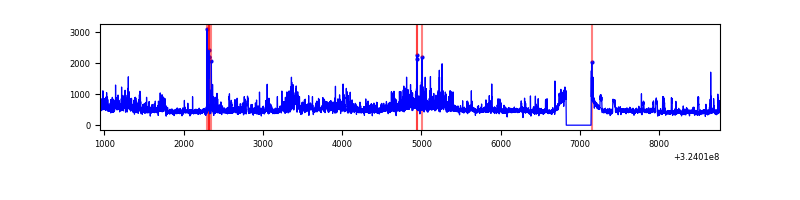 |
Top three noisy pixels from each quadrant. If the there are fewer than three noisy pixels in the level2.evt file, extra rows are filled as -1
| Pixel properties | Quadrant properties | ||||||
|---|---|---|---|---|---|---|---|
| Quadrant | DetID | PixID | Counts | Sigma | Mean | Median | Sigma |
| A | 14 | 111 | 148829 | 837.34 | 876 | 854 | 176.7 |
| A | 13 | 254 | 10934 | 57.04 | 876 | 854 | 176.7 |
| A | 3 | 137 | 8252 | 41.86 | 876 | 854 | 176.7 |
| B | 3 | 64 | 155206 | 925.25 | 877 | 852 | 166.8 |
| B | 12 | 17 | 120121 | 714.94 | 877 | 852 | 166.8 |
| B | 0 | 219 | 25468 | 147.56 | 877 | 852 | 166.8 |
| C | 14 | 238 | 134575 | 673.52 | 848 | 852 | 198.5 |
| C | 7 | 247 | 102483 | 511.88 | 848 | 852 | 198.5 |
| C | 2 | 16 | 31900 | 156.38 | 848 | 852 | 198.5 |
| D | 8 | 195 | 470519 | 2287.15 | 850 | 824 | 205.4 |
| D | 1 | 52 | 376121 | 1827.48 | 850 | 824 | 205.4 |
| D | 9 | 35 | 64490 | 310.02 | 850 | 824 | 205.4 |
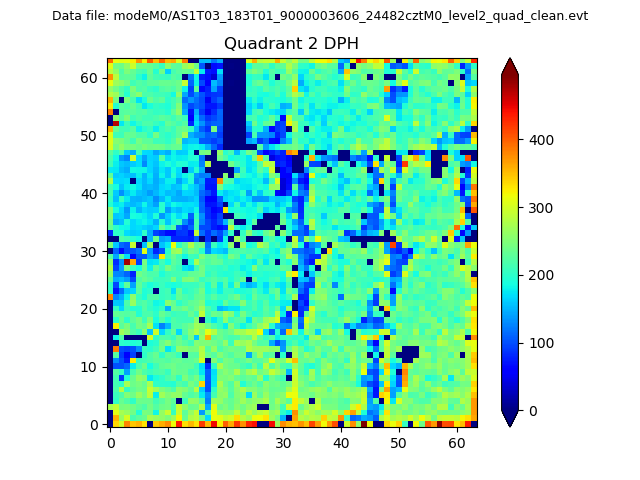
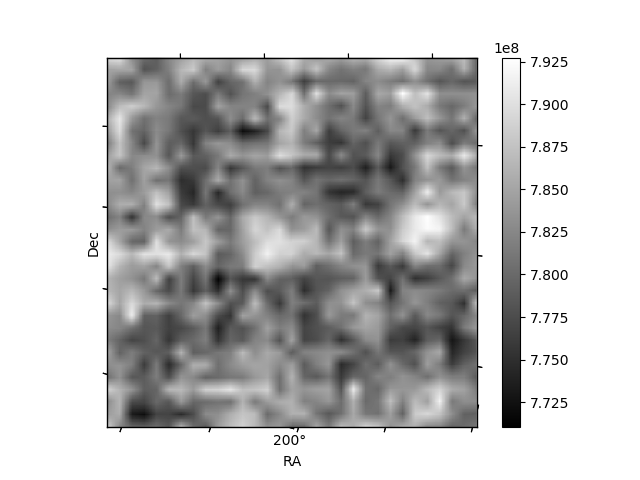
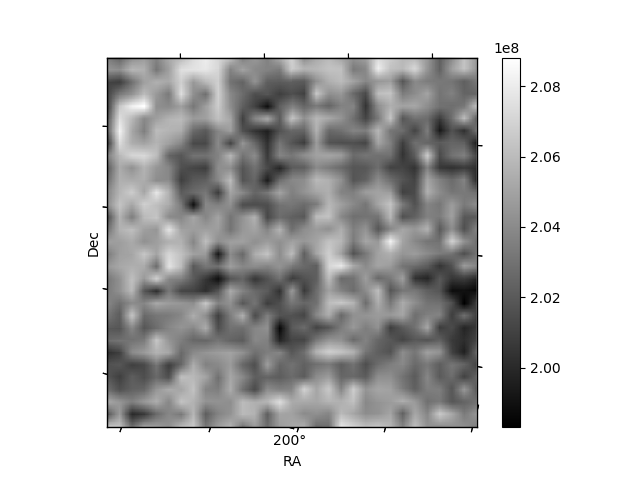
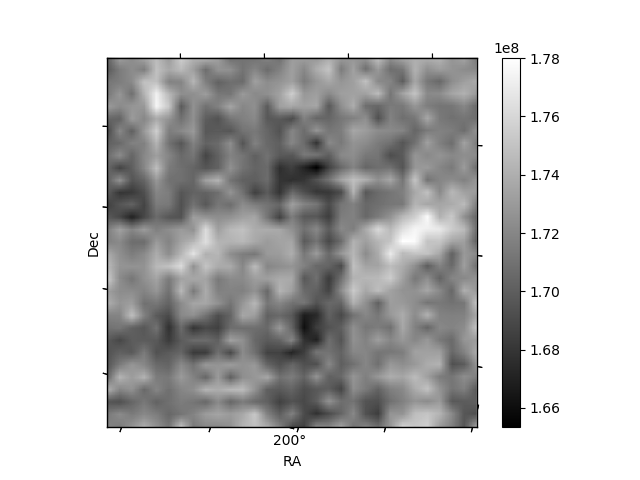
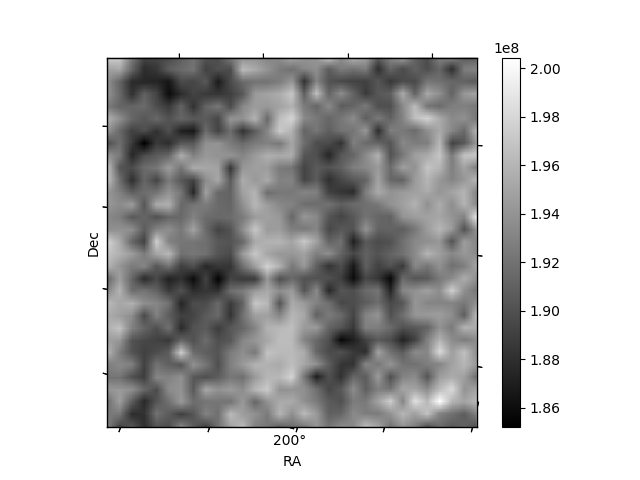
Histogram calculated using DETX and DETY for each event in the final _common_clean file
| Quadrant A | 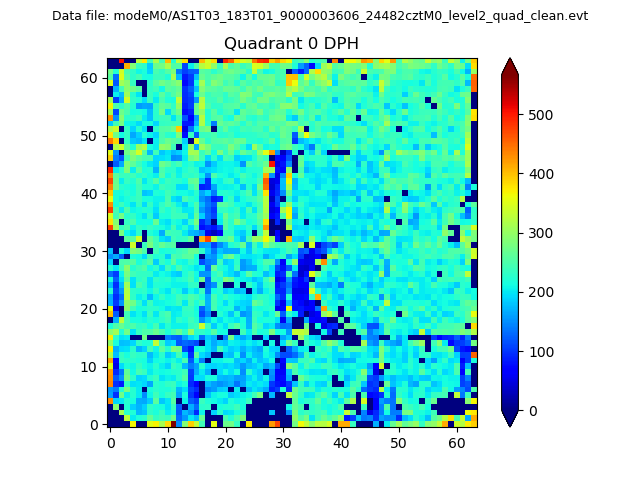 |
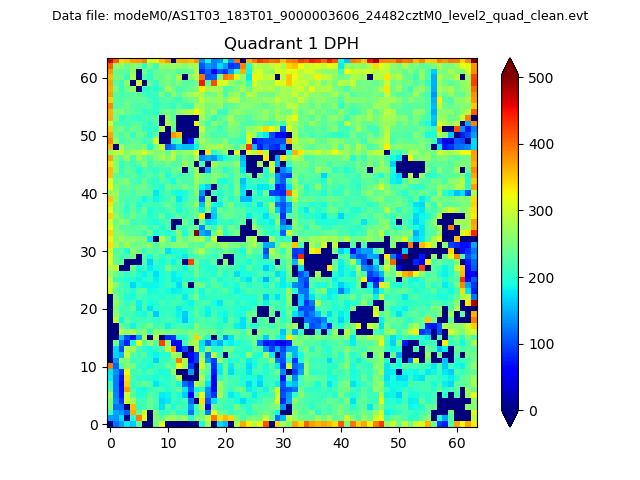 |
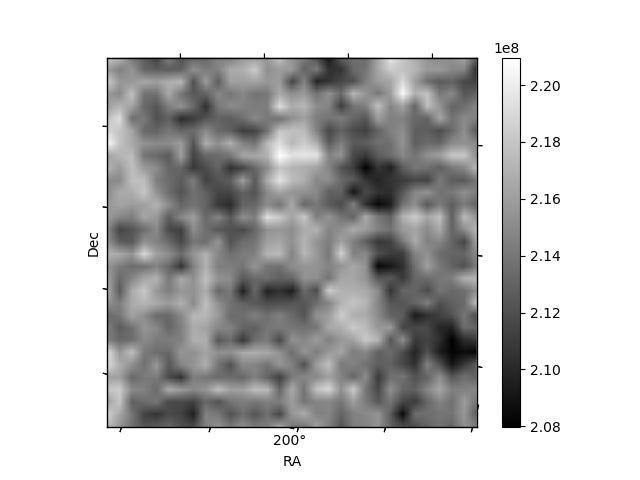
Quadrant B |
|---|---|---|---|
| Quadrant D | 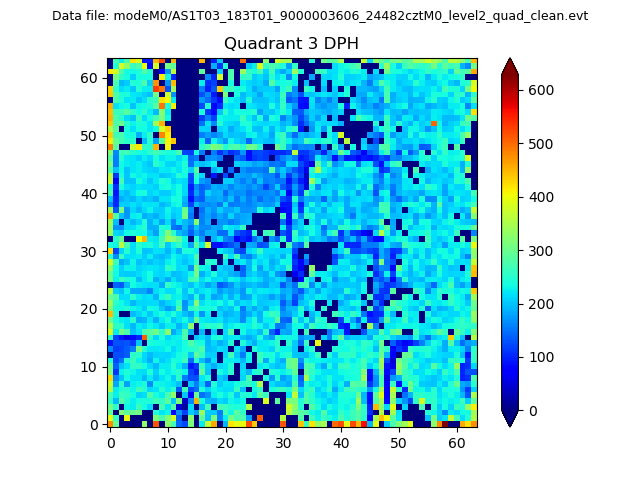 |
 |
Quadrant C |
| Plot type | Count rate plots | Images |
|---|---|---|
| Comparison with Poisson distribution Blue bars denote a histogram of data divided into 1 sec bins. Red curve is a Poisson curve with rate = median count rate of data. |
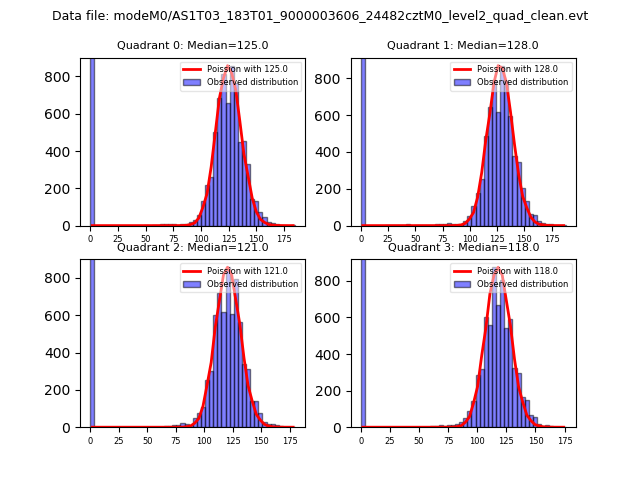 |
 |
| Quadrant-wise count rates Data is divided into 100 sec bins |
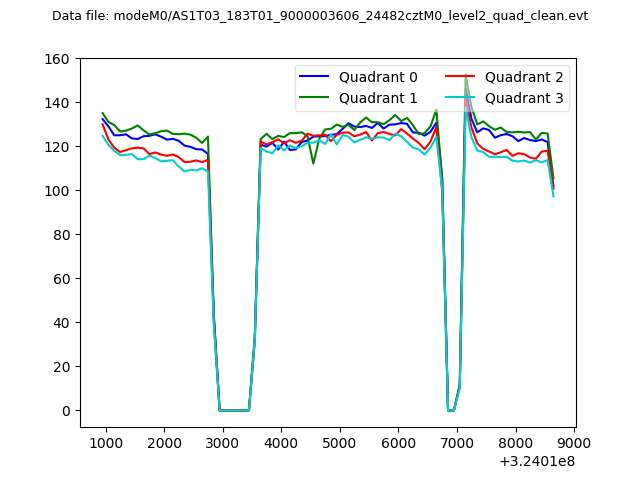 |
|
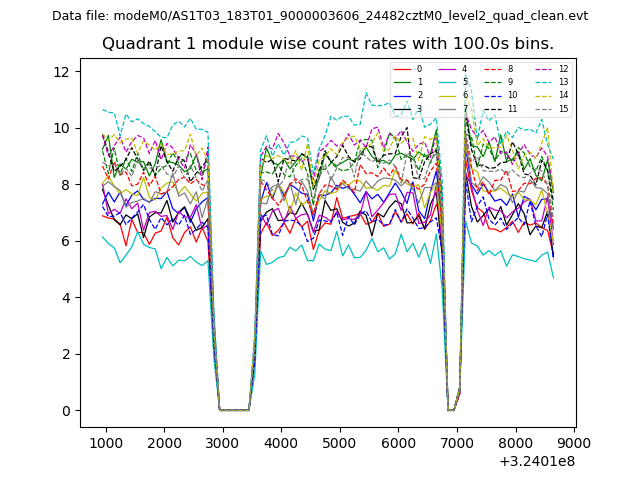
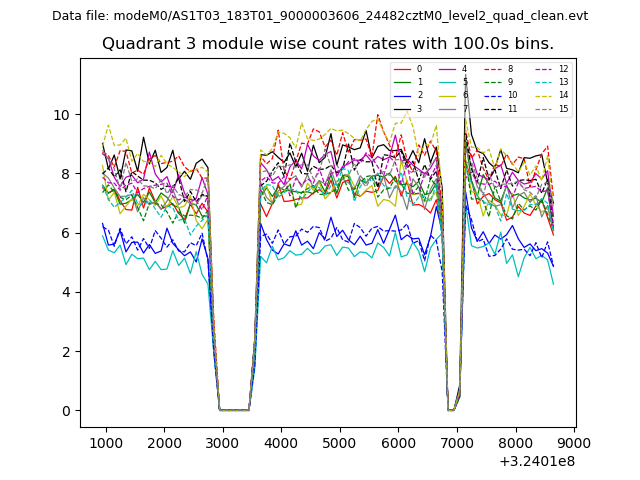
| Module-wise count rates for Quadrant A Data is divided into 100 sec bins |
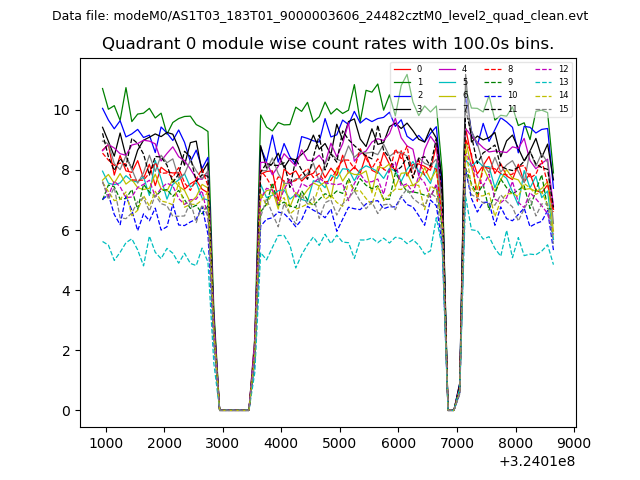 |
 |
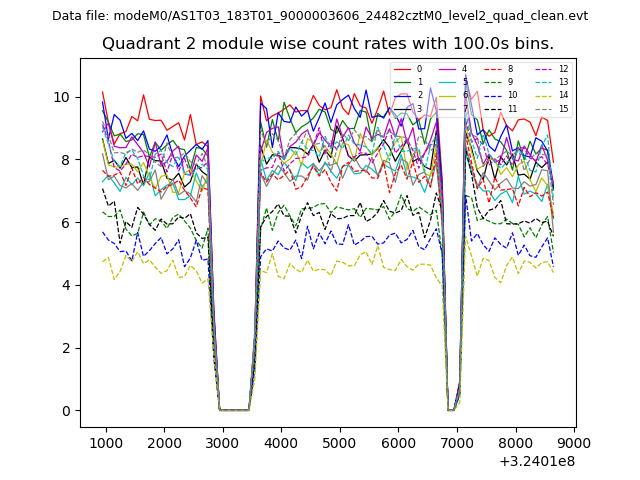
| Module-wise count rates for Quadrant B Data is divided into 100 sec bins |
 |
 |
| Module-wise count rates for Quadrant C Data is divided into 100 sec bins |
 |
 |
| Module-wise count rates for Quadrant D Data is divided into 100 sec bins |
 |
 |
| Parameter | Plot |
|---|---|
| CZT HV Monitor | 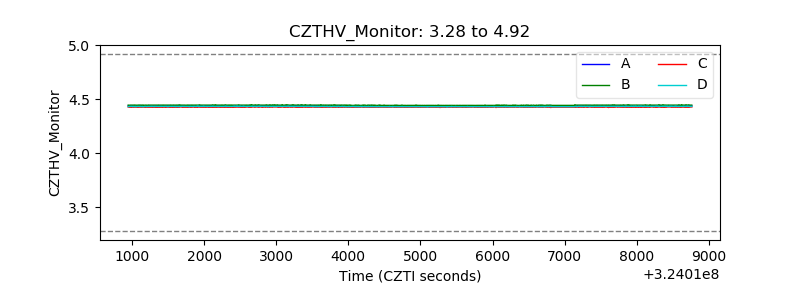 |
| D_VDD | 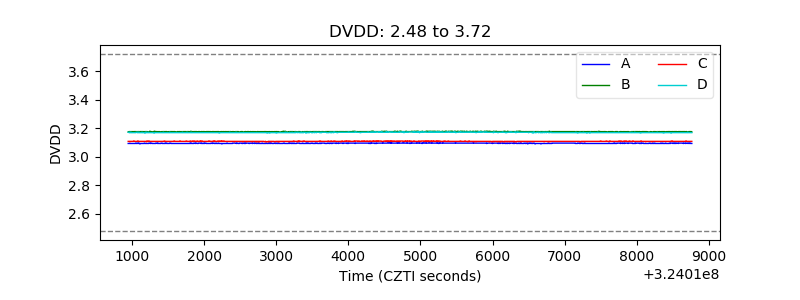 |
| Temperature 1 | 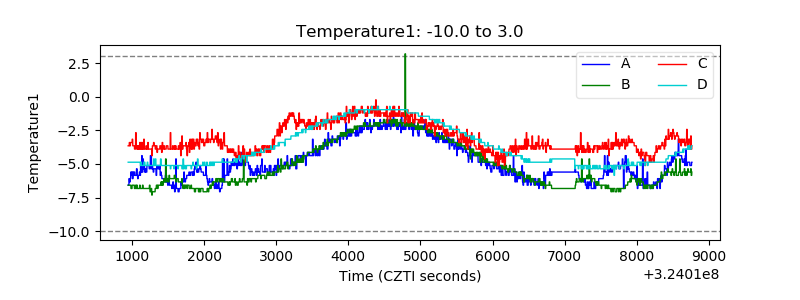 |
| Veto HV Monitor | 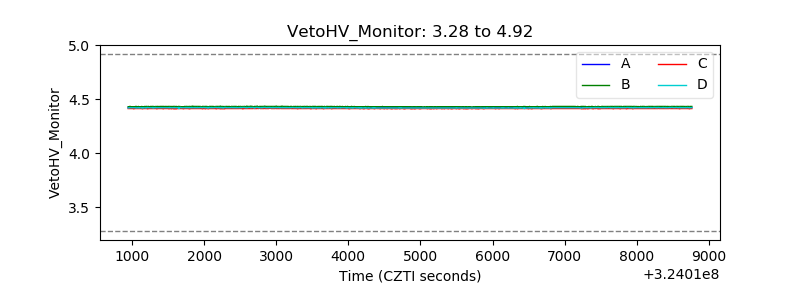 |
| Veto LLD | 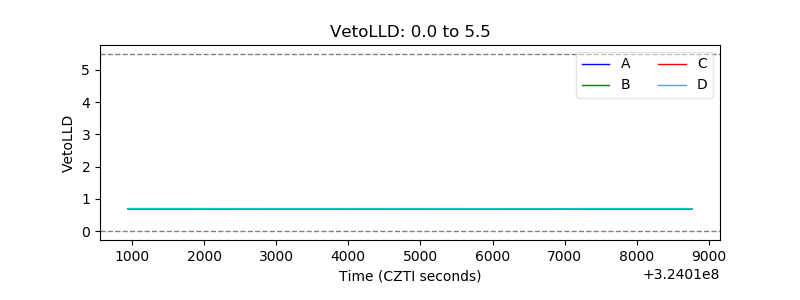 |
| Alpha Counter | 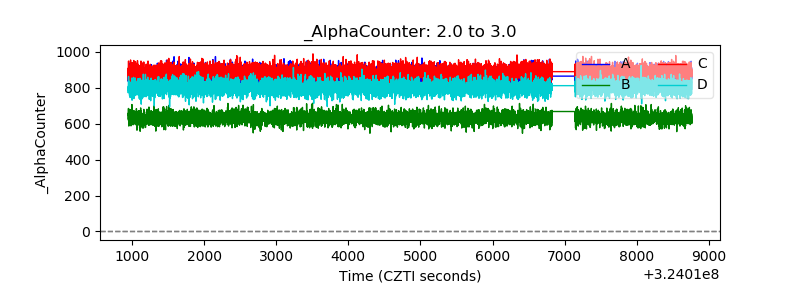 |
| _CPM_Rate | 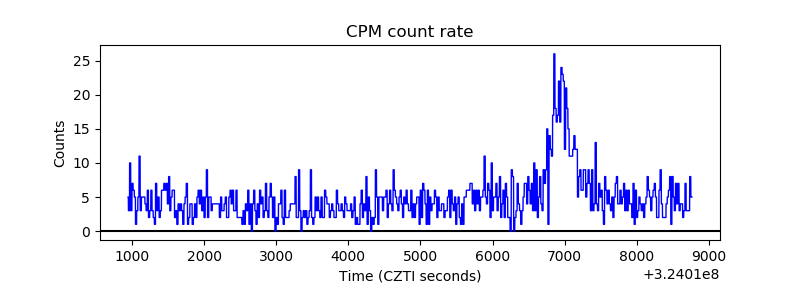 |
| CZT Counter | 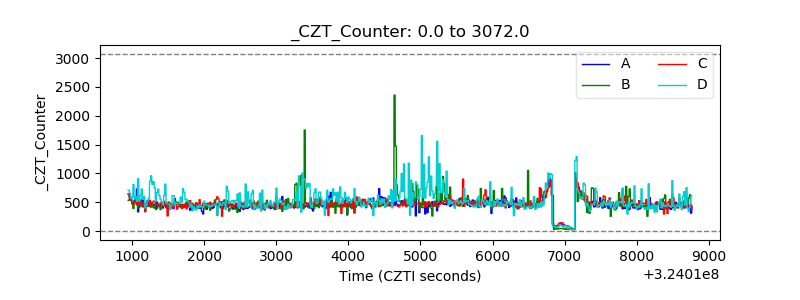 |
| +2.5 Volts monitor |  |
| +5 Volts monitor |  |
| _ROLL_ROT | 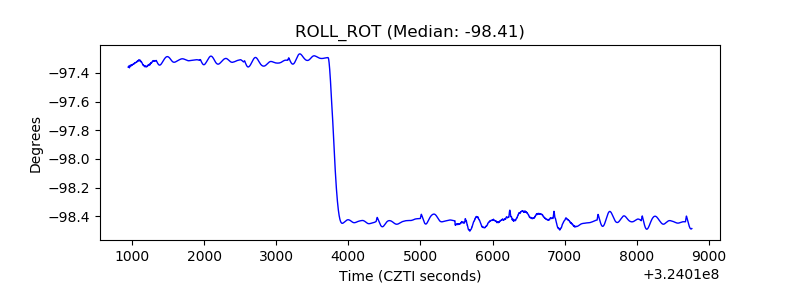 |
| _Roll_DEC | 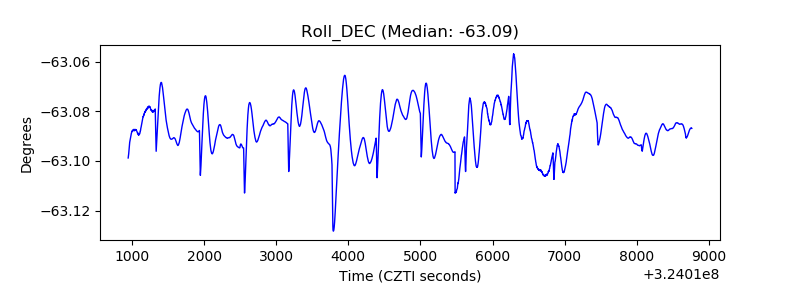 |
| _Roll_RA | 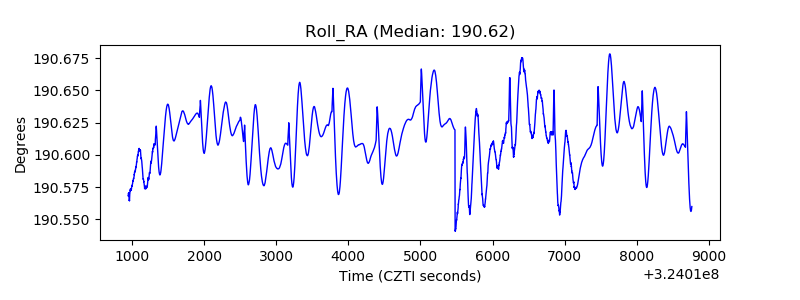 |
| Veto Counter | 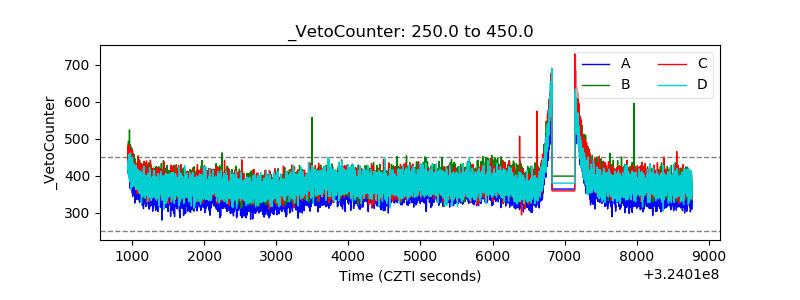 |