| Param | Original file | Final file |
|---|---|---|
| Filename | modeM0/AS1T03_183T01_9000003606_24486cztM0_level2.evt | modeM0/AS1T03_183T01_9000003606_24486cztM0_level2_quad_clean.evt |
| Size (bytes) | 906,793,920 | 205,418,880 |
| Size | 864.8 MB | 195.9 MB |
| Events in quadrant A | 6,299,491 | 1,352,668 |
| Events in quadrant B | 7,075,671 | 1,370,053 |
| Events in quadrant C | 6,304,847 | 1,316,856 |
| Events in quadrant D | 6,900,448 | 1,282,045 |
| Mode M0 | |||
|---|---|---|---|
| Quadrant | BADHDUFLAG | Total packets | Discarded packets |
| A | 0 | 26954 | 3 |
| B | 0 | 29460 | 3 |
| C | 0 | 26966 | 3 |
| D | 0 | 29393 | 3 |
| Mode SS | |||
|---|---|---|---|
| Quadrant | BADHDUFLAG | Total packets | Discarded packets |
| A | 0 | 268 | 0 |
| B | 0 | 268 | 0 |
| C | 0 | 268 | 0 |
| D | 0 | 268 | 0 |
| Mode M9 | |||
|---|---|---|---|
| Quadrant | BADHDUFLAG | Total packets | Discarded packets |
| A | 0 | 13 | 0 |
| B | 0 | 13 | 0 |
| C | 0 | 13 | 0 |
| D | 0 | 13 | 0 |
| Quadrant | Total seconds | Saturated seconds | Saturation percentage |
|---|---|---|---|
| A | 13019 | 200 | 1.536216% |
| B | 13019 | 382 | 2.934173% |
| C | 13019 | 297 | 2.281281% |
| D | 13020 | 342 | 2.626728% |
Noise dominated data is calculated using 1-second bins in cleaned event files. If a bin has >2000 counts, and if more than 50% of those come from <1% of pixels, then it is considered to be noise-dominated and hence unusable.
| Quadrant | # 1 sec bins | Bins with >0 counts | Bins with >2000 counts | High rate bins dominated by noise | Noise dominated (total time) | Noise dominated (detector-on time) | Marked lightcurve |
|---|---|---|---|---|---|---|---|
| A | 14414 | 13022 | 1 | 1 | 0.01% | 0.01% | 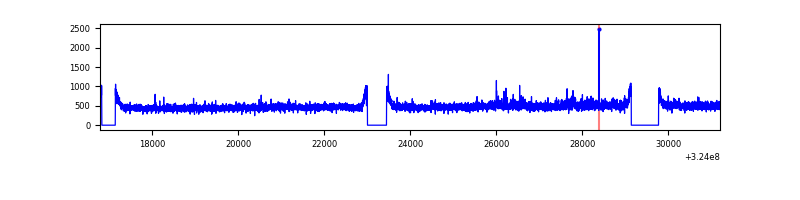 |
| B | 14414 | 13022 | 85 | 85 | 0.59% | 0.65% | 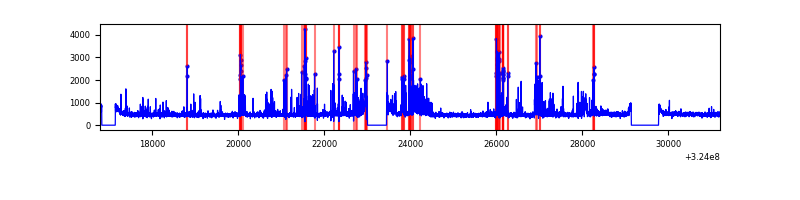 |
| C | 14414 | 13022 | 4 | 4 | 0.03% | 0.03% | 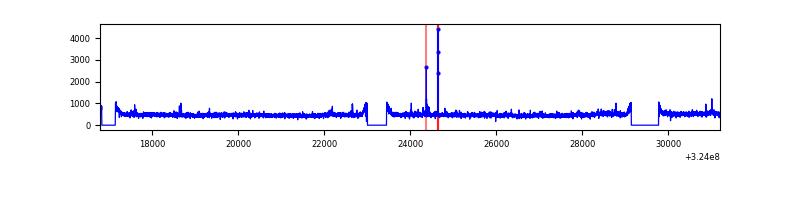 |
| D | 14415 | 13023 | 119 | 119 | 0.83% | 0.91% | 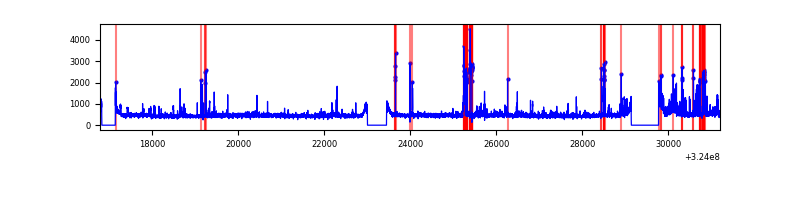 |
Top three noisy pixels from each quadrant. If the there are fewer than three noisy pixels in the level2.evt file, extra rows are filled as -1
| Pixel properties | Quadrant properties | ||||||
|---|---|---|---|---|---|---|---|
| Quadrant | DetID | PixID | Counts | Sigma | Mean | Median | Sigma |
| A | 14 | 111 | 323852 | 1039.92 | 1545 | 1510 | 310.0 |
| A | 13 | 254 | 19603 | 58.37 | 1545 | 1510 | 310.0 |
| A | 3 | 137 | 14313 | 41.3 | 1545 | 1510 | 310.0 |
| B | 3 | 64 | 992145 | 3388.47 | 1536 | 1495 | 292.4 |
| B | 12 | 111 | 36382 | 119.33 | 1536 | 1495 | 292.4 |
| B | 11 | 111 | 32778 | 107.0 | 1536 | 1495 | 292.4 |
| C | 14 | 238 | 236330 | 674.47 | 1492 | 1499 | 348.2 |
| C | 2 | 16 | 114042 | 323.24 | 1492 | 1499 | 348.2 |
| C | 7 | 247 | 73990 | 208.2 | 1492 | 1499 | 348.2 |
| D | 13 | 174 | 520658 | 1427.58 | 1505 | 1457 | 363.7 |
| D | 1 | 52 | 353922 | 969.13 | 1505 | 1457 | 363.7 |
| D | 8 | 195 | 126053 | 342.59 | 1505 | 1457 | 363.7 |
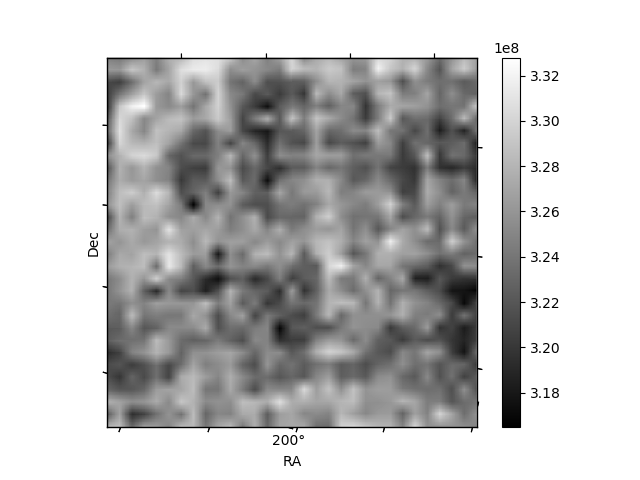
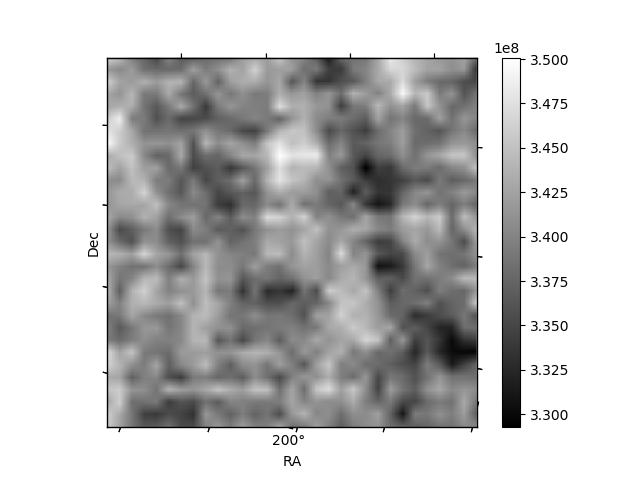
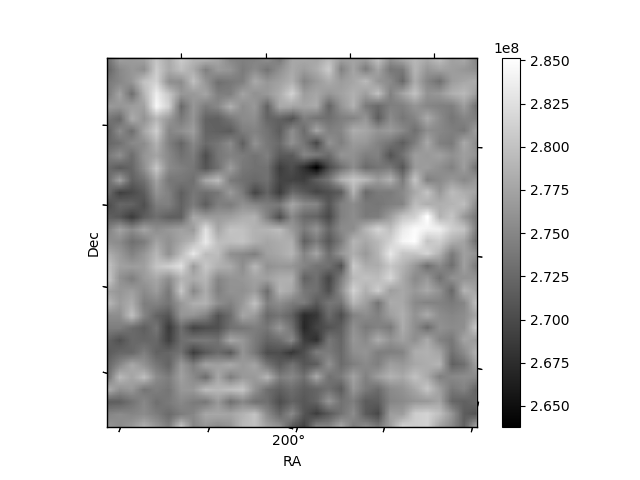
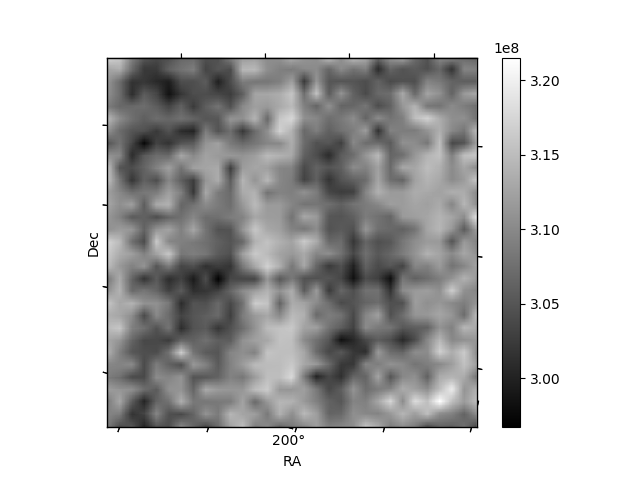
Histogram calculated using DETX and DETY for each event in the final _common_clean file
| Quadrant A | 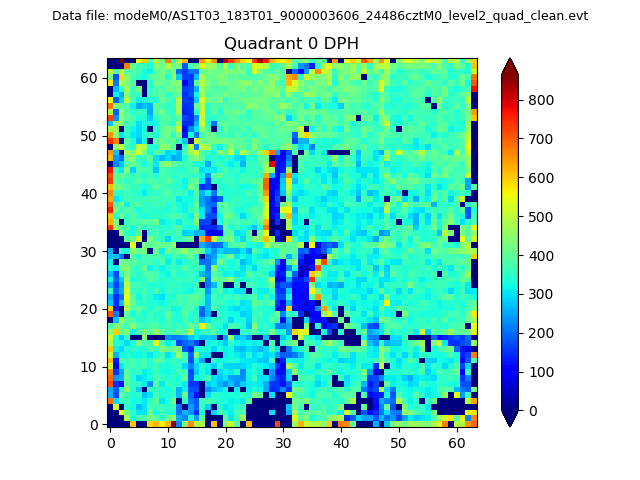 |
 |
Quadrant B |
|---|---|---|---|
| Quadrant D | 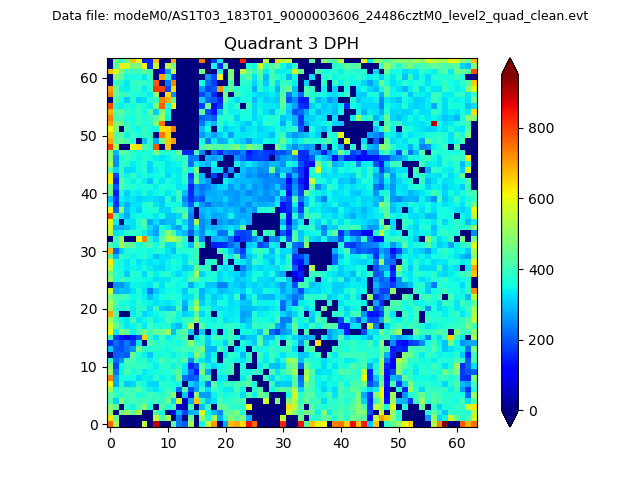 |
 |
Quadrant C |
| Plot type | Count rate plots | Images |
|---|---|---|
| Comparison with Poisson distribution Blue bars denote a histogram of data divided into 1 sec bins. Red curve is a Poisson curve with rate = median count rate of data. |
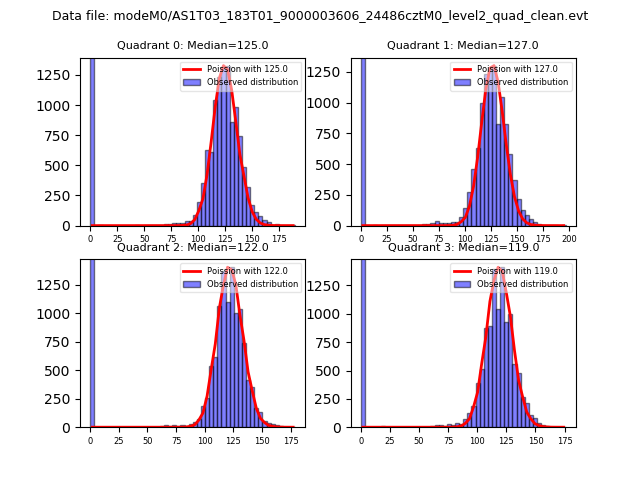 |
 |
| Quadrant-wise count rates Data is divided into 100 sec bins |
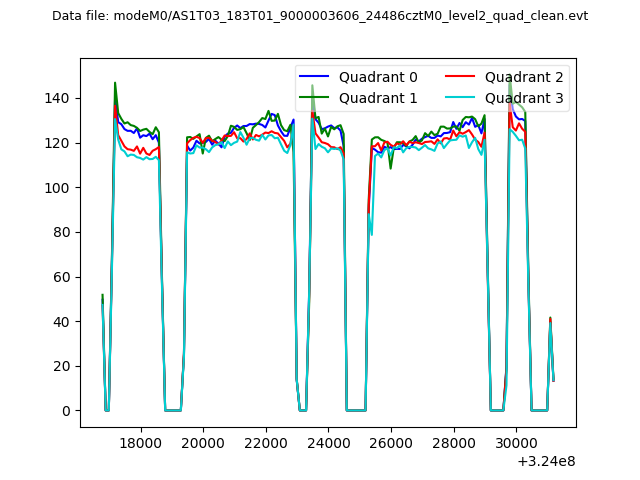 |
|
| Module-wise count rates for Quadrant A Data is divided into 100 sec bins |
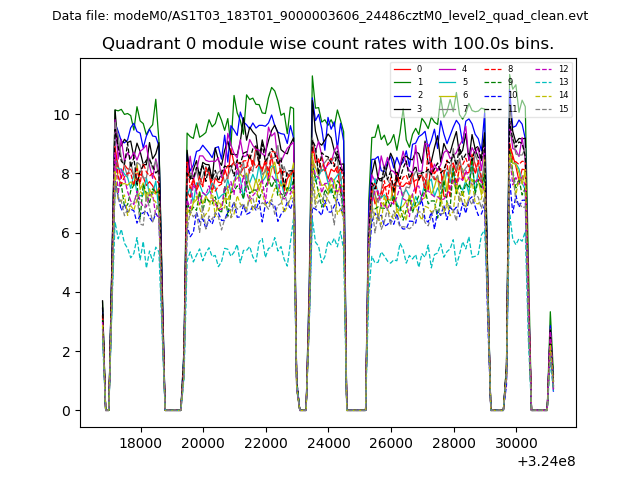 |
 |
| Module-wise count rates for Quadrant B Data is divided into 100 sec bins |
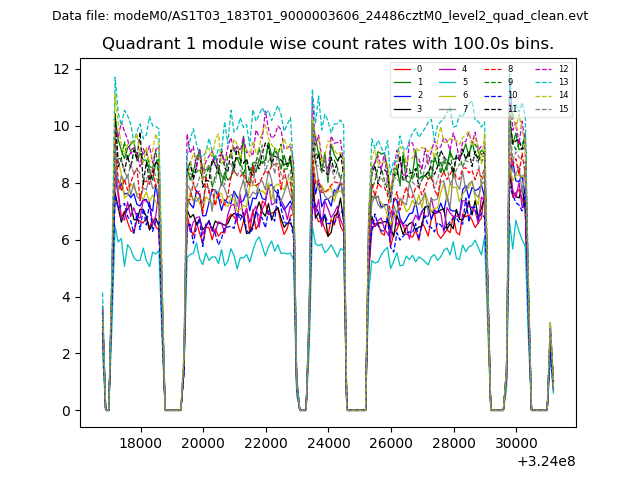 |
 |
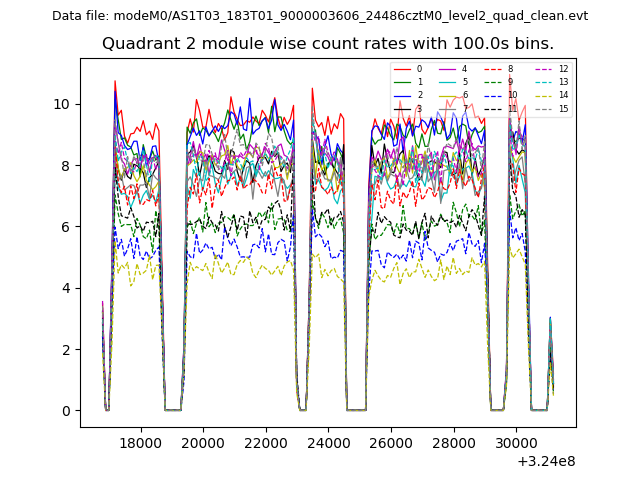
| Module-wise count rates for Quadrant C Data is divided into 100 sec bins |
 |
 |
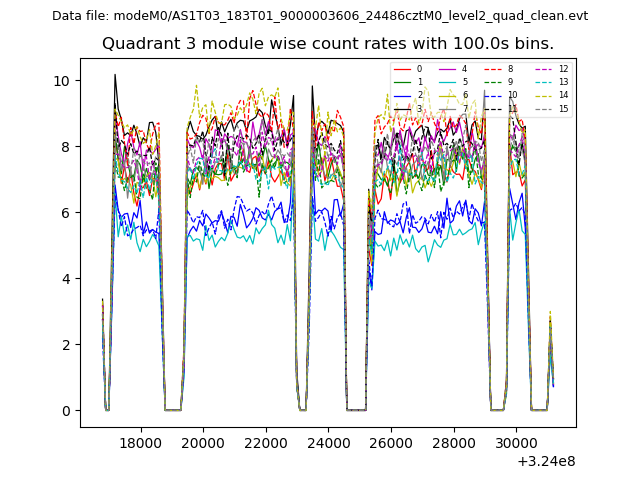
| Module-wise count rates for Quadrant D Data is divided into 100 sec bins |
 |
 |
| Parameter | Plot |
|---|---|
| CZT HV Monitor | 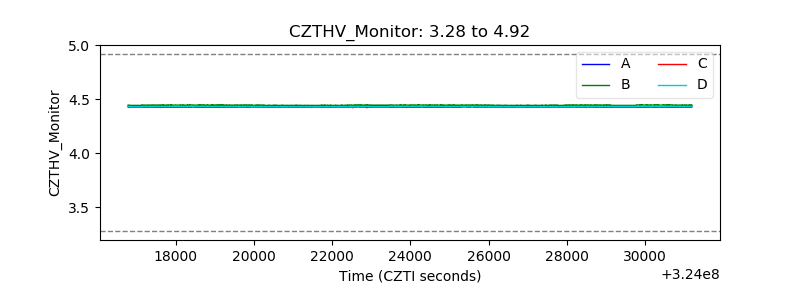 |
| D_VDD | 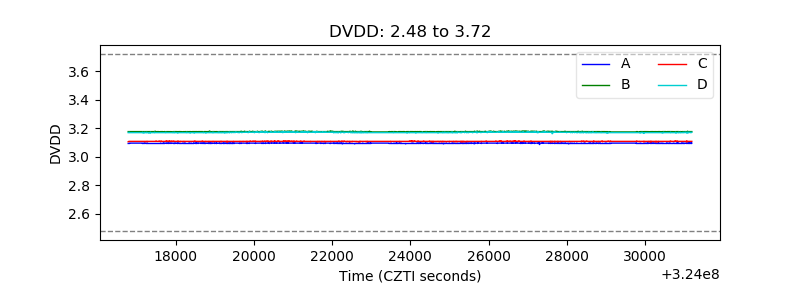 |
| Temperature 1 |  |
| Veto HV Monitor | 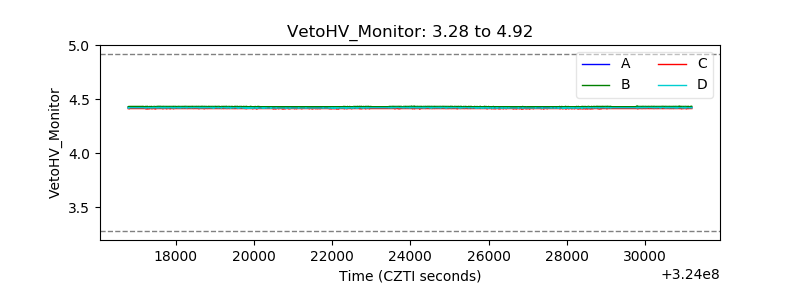 |
| Veto LLD | 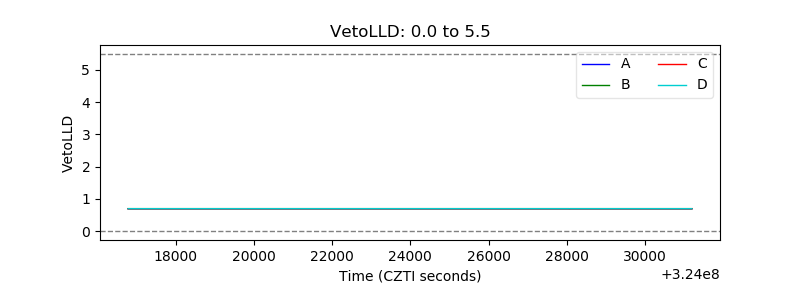 |
| Alpha Counter | 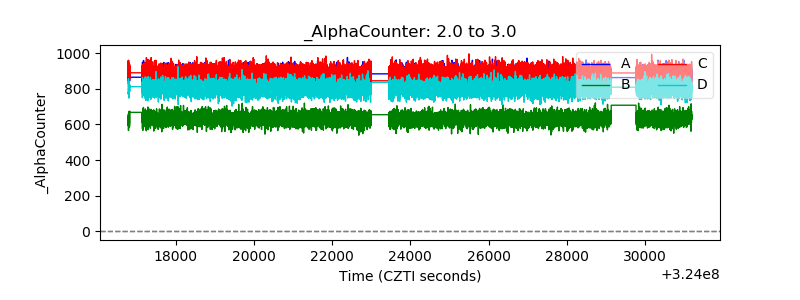 |
| _CPM_Rate | 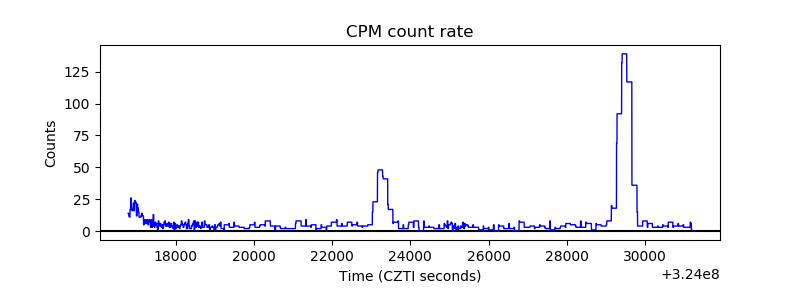 |
| CZT Counter | 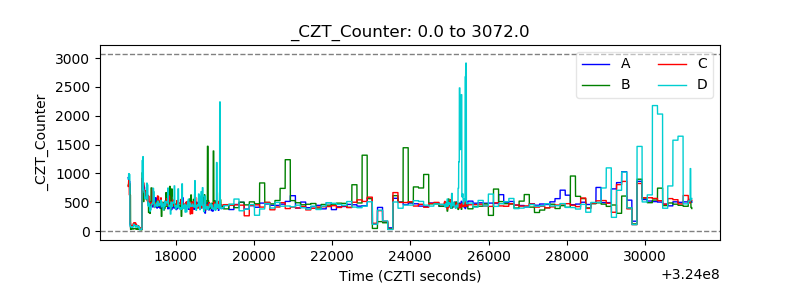 |
| +2.5 Volts monitor |  |
| +5 Volts monitor | 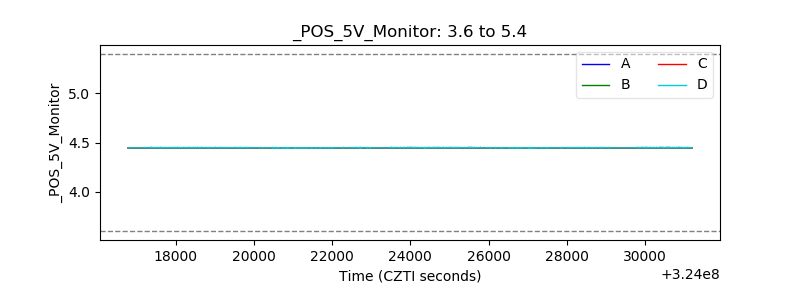 |
| _ROLL_ROT | 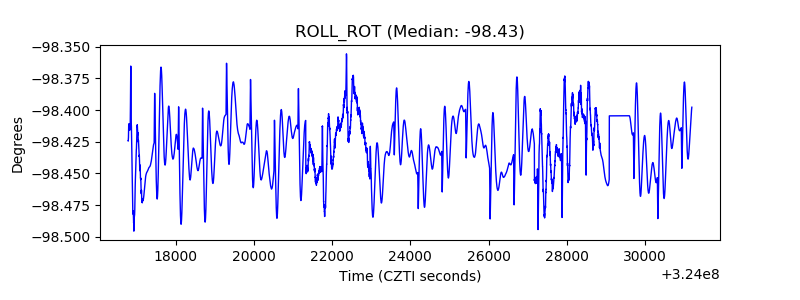 |
| _Roll_DEC | 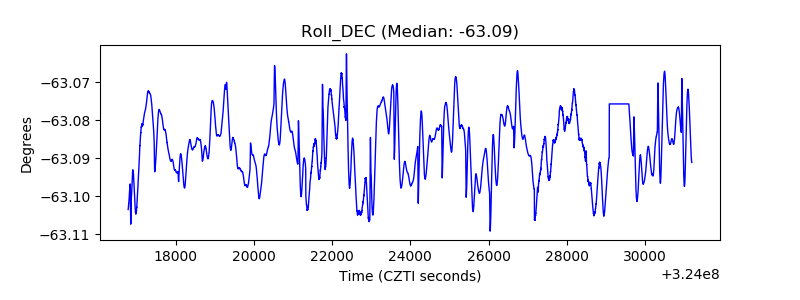 |
| _Roll_RA | 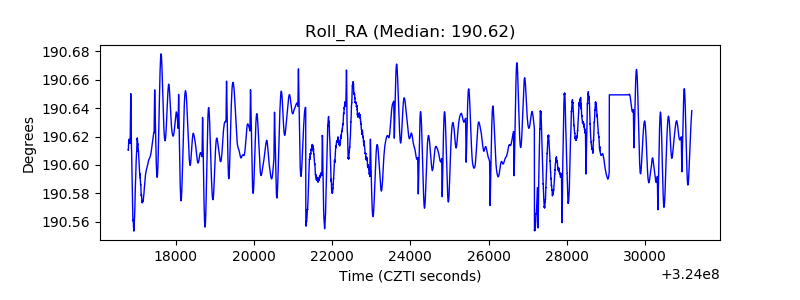 |
| Veto Counter | 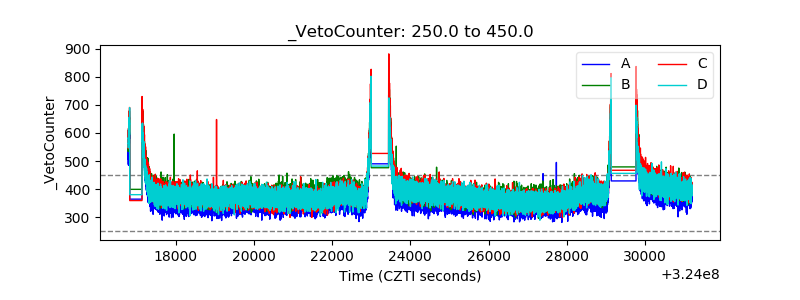 |