| Param | Original file | Final file |
|---|---|---|
| Filename | modeM0/AS1T03_183T01_9000003606_24488cztM0_level2.evt | modeM0/AS1T03_183T01_9000003606_24488cztM0_level2_quad_clean.evt |
| Size (bytes) | 1,235,286,720 | 291,735,360 |
| Size | 1.2 GB | 278.2 MB |
| Events in quadrant A | 10,056,770 | 1,922,480 |
| Events in quadrant B | 8,250,703 | 2,001,057 |
| Events in quadrant C | 8,192,676 | 1,911,934 |
| Events in quadrant D | 9,781,626 | 1,849,435 |
| Mode M0 | |||
|---|---|---|---|
| Quadrant | BADHDUFLAG | Total packets | Discarded packets |
| A | 0 | 40948 | 3 |
| B | 0 | 35609 | 3 |
| C | 0 | 35243 | 3 |
| D | 0 | 40710 | 3 |
| Mode SS | |||
|---|---|---|---|
| Quadrant | BADHDUFLAG | Total packets | Discarded packets |
| A | 0 | 338 | 0 |
| B | 0 | 338 | 0 |
| C | 0 | 338 | 0 |
| D | 0 | 338 | 0 |
| Mode M9 | |||
|---|---|---|---|
| Quadrant | BADHDUFLAG | Total packets | Discarded packets |
| A | 0 | 29 | 0 |
| B | 0 | 29 | 0 |
| C | 0 | 29 | 0 |
| D | 0 | 29 | 0 |
| Quadrant | Total seconds | Saturated seconds | Saturation percentage |
|---|---|---|---|
| A | 16707 | 795 | 4.758484% |
| B | 16708 | 218 | 1.304764% |
| C | 16708 | 256 | 1.532200% |
| D | 16708 | 684 | 4.093847% |
Noise dominated data is calculated using 1-second bins in cleaned event files. If a bin has >2000 counts, and if more than 50% of those come from <1% of pixels, then it is considered to be noise-dominated and hence unusable.
| Quadrant | # 1 sec bins | Bins with >0 counts | Bins with >2000 counts | High rate bins dominated by noise | Noise dominated (total time) | Noise dominated (detector-on time) | Marked lightcurve |
|---|---|---|---|---|---|---|---|
| A | 19582 | 16710 | 344 | 344 | 1.76% | 2.06% | 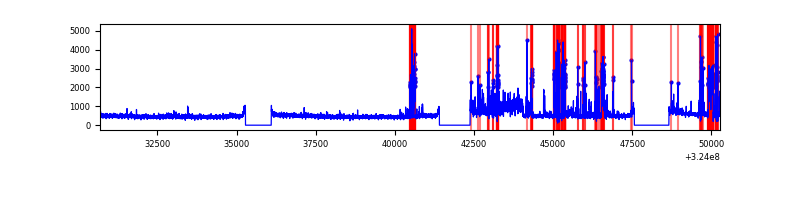 |
| B | 19583 | 16711 | 30 | 30 | 0.15% | 0.18% | 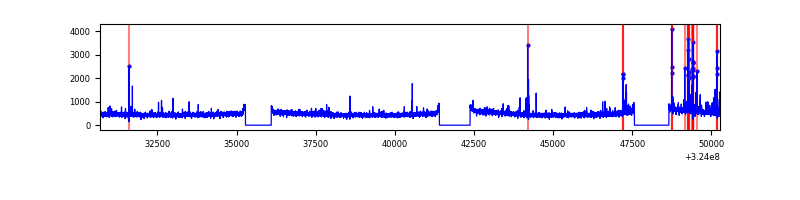 |
| C | 19583 | 16710 | 2 | 2 | 0.01% | 0.01% | 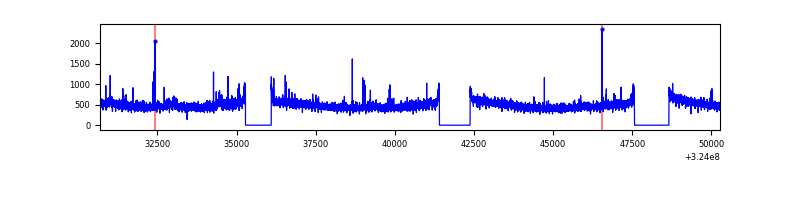 |
| D | 19583 | 16711 | 392 | 392 | 2.00% | 2.35% | 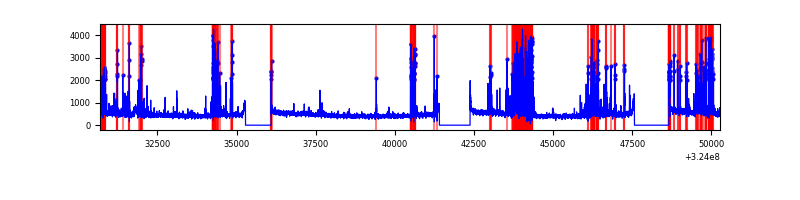 |
Top three noisy pixels from each quadrant. If the there are fewer than three noisy pixels in the level2.evt file, extra rows are filled as -1
| Pixel properties | Quadrant properties | ||||||
|---|---|---|---|---|---|---|---|
| Quadrant | DetID | PixID | Counts | Sigma | Mean | Median | Sigma |
| A | 14 | 111 | 2152969 | 5380.59 | 2005 | 1961 | 399.8 |
| A | 4 | 2 | 162868 | 402.5 | 2005 | 1961 | 399.8 |
| A | 13 | 254 | 26068 | 60.3 | 2005 | 1961 | 399.8 |
| B | 3 | 64 | 267844 | 706.09 | 2019 | 1969 | 376.5 |
| B | 12 | 111 | 46358 | 117.88 | 2019 | 1969 | 376.5 |
| B | 11 | 111 | 41135 | 104.01 | 2019 | 1969 | 376.5 |
| C | 14 | 238 | 311912 | 694.6 | 1940 | 1953 | 446.2 |
| C | 3 | 233 | 141507 | 312.73 | 1940 | 1953 | 446.2 |
| C | 2 | 16 | 102044 | 224.3 | 1940 | 1953 | 446.2 |
| D | 12 | 218 | 1732890 | 3673.32 | 1947 | 1889 | 471.2 |
| D | 1 | 52 | 266524 | 561.58 | 1947 | 1889 | 471.2 |
| D | 13 | 174 | 139394 | 291.8 | 1947 | 1889 | 471.2 |
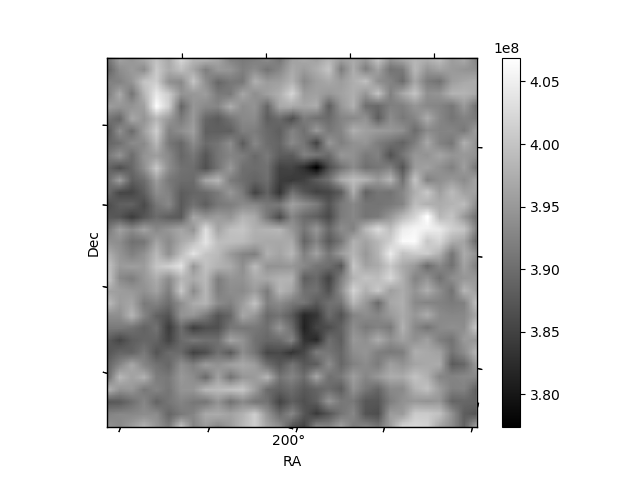
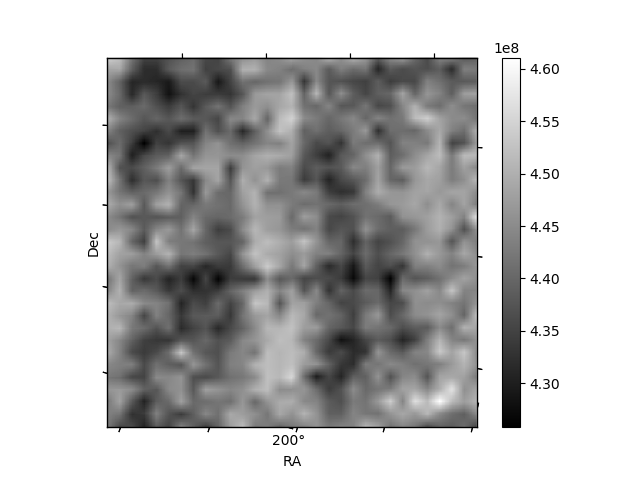
Histogram calculated using DETX and DETY for each event in the final _common_clean file
| Quadrant A |  |
 |
Quadrant B |
|---|---|---|---|
| Quadrant D |  |
 |
Quadrant C |
| Plot type | Count rate plots | Images |
|---|---|---|
| Comparison with Poisson distribution Blue bars denote a histogram of data divided into 1 sec bins. Red curve is a Poisson curve with rate = median count rate of data. |
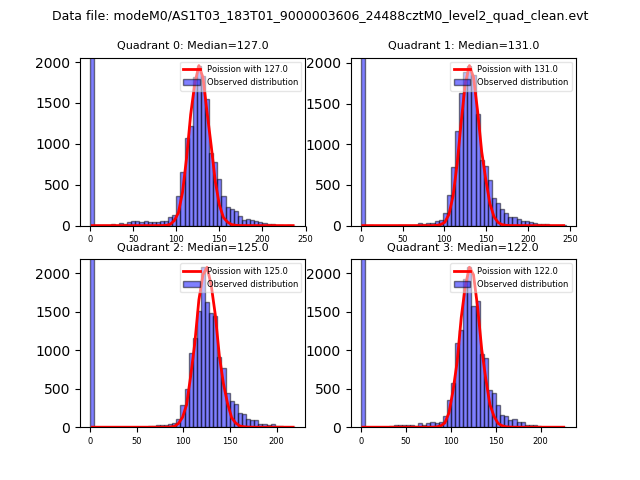 |
 |
| Quadrant-wise count rates Data is divided into 100 sec bins |
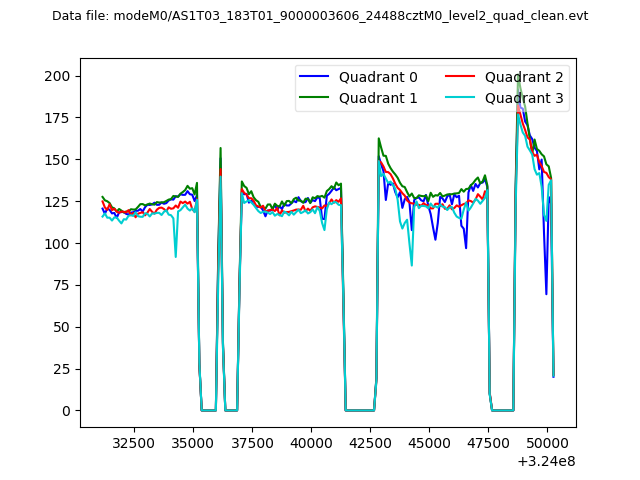 |
|
| Module-wise count rates for Quadrant A Data is divided into 100 sec bins |
 |
 |
| Module-wise count rates for Quadrant B Data is divided into 100 sec bins |
 |
 |
| Module-wise count rates for Quadrant C Data is divided into 100 sec bins |
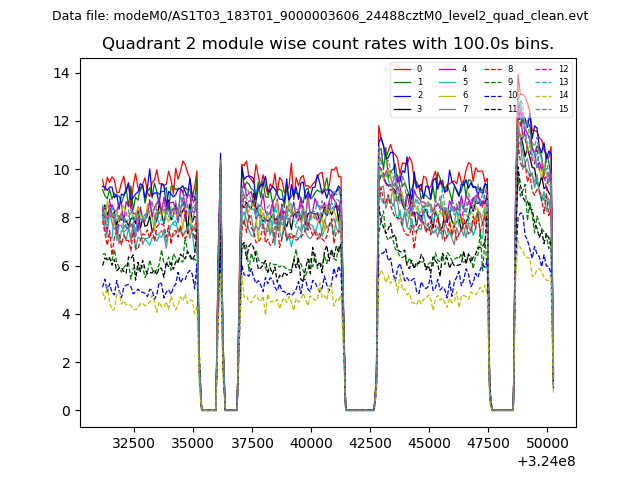 |
 |
| Module-wise count rates for Quadrant D Data is divided into 100 sec bins |
 |
 |
| Parameter | Plot |
|---|---|
| CZT HV Monitor |  |
| D_VDD |  |
| Temperature 1 |  |
| Veto HV Monitor |  |
| Veto LLD |  |
| Alpha Counter | 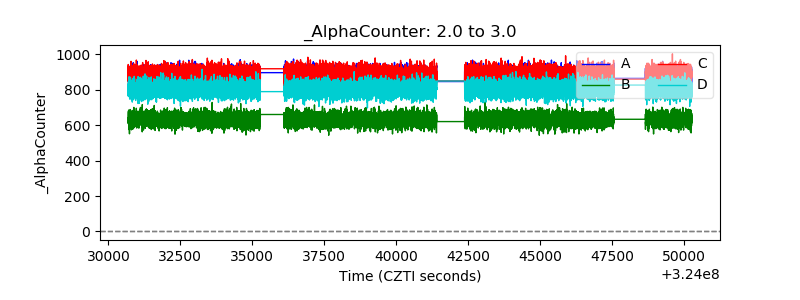 |
| _CPM_Rate | 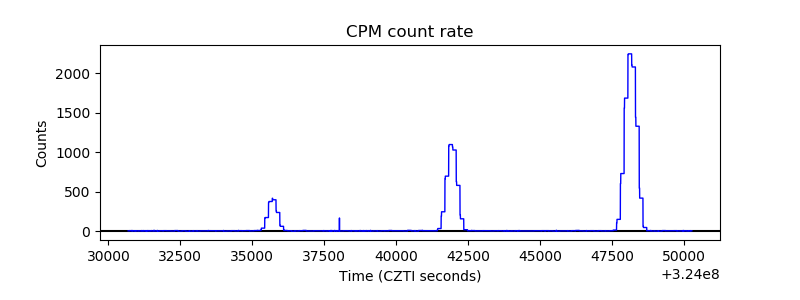 |
| CZT Counter |  |
| +2.5 Volts monitor |  |
| +5 Volts monitor |  |
| _ROLL_ROT |  |
| _Roll_DEC |  |
| _Roll_RA |  |
| Veto Counter |  |