| Param | Original file | Final file |
|---|---|---|
| Filename | modeM0/AS1T03_183T01_9000003606_24490cztM0_level2.evt | modeM0/AS1T03_183T01_9000003606_24490cztM0_level2_quad_clean.evt |
| Size (bytes) | 517,011,840 | 134,982,720 |
| Size | 493.1 MB | 128.7 MB |
| Events in quadrant A | 3,899,462 | 936,098 |
| Events in quadrant B | 4,751,249 | 937,292 |
| Events in quadrant C | 3,278,277 | 895,578 |
| Events in quadrant D | 3,300,639 | 878,966 |
| Mode M0 | |||
|---|---|---|---|
| Quadrant | BADHDUFLAG | Total packets | Discarded packets |
| A | 0 | 15883 | 1 |
| B | 0 | 18380 | 1 |
| C | 0 | 13739 | 1 |
| D | 0 | 14098 | 1 |
| Mode SS | |||
|---|---|---|---|
| Quadrant | BADHDUFLAG | Total packets | Discarded packets |
| A | 0 | 126 | 0 |
| B | 0 | 126 | 0 |
| C | 0 | 126 | 0 |
| D | 0 | 126 | 0 |
| Mode M9 | |||
|---|---|---|---|
| Quadrant | BADHDUFLAG | Total packets | Discarded packets |
| A | 0 | 14 | 0 |
| B | 0 | 14 | 0 |
| C | 0 | 14 | 0 |
| D | 0 | 14 | 0 |
| Quadrant | Total seconds | Saturated seconds | Saturation percentage |
|---|---|---|---|
| A | 6320 | 261 | 4.129747% |
| B | 6320 | 405 | 6.408228% |
| C | 6321 | 94 | 1.487106% |
| D | 6321 | 84 | 1.328904% |
Noise dominated data is calculated using 1-second bins in cleaned event files. If a bin has >2000 counts, and if more than 50% of those come from <1% of pixels, then it is considered to be noise-dominated and hence unusable.
| Quadrant | # 1 sec bins | Bins with >0 counts | Bins with >2000 counts | High rate bins dominated by noise | Noise dominated (total time) | Noise dominated (detector-on time) | Marked lightcurve |
|---|---|---|---|---|---|---|---|
| A | 7625 | 6321 | 94 | 94 | 1.23% | 1.49% | 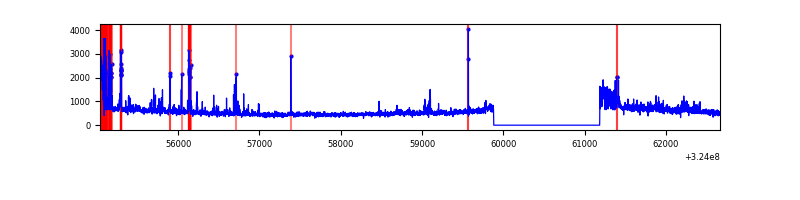 |
| B | 7625 | 6321 | 198 | 198 | 2.60% | 3.13% | 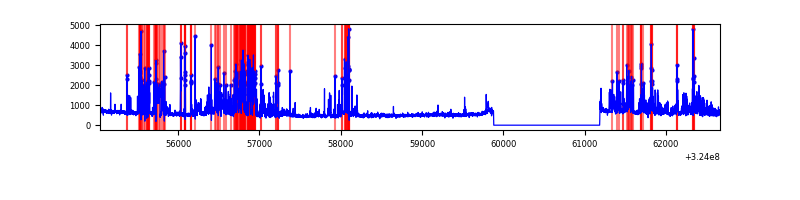 |
| C | 7626 | 6322 | 1 | 1 | 0.01% | 0.02% | 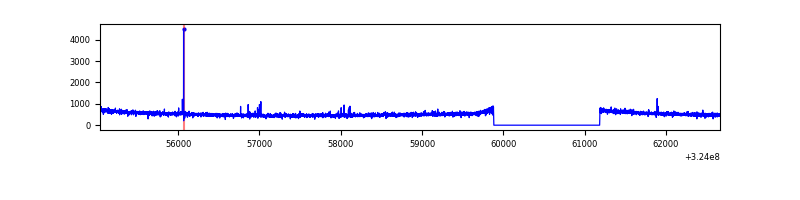 |
| D | 7626 | 6322 | 32 | 32 | 0.42% | 0.51% | 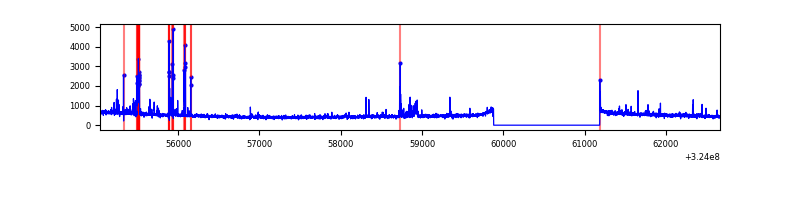 |
Top three noisy pixels from each quadrant. If the there are fewer than three noisy pixels in the level2.evt file, extra rows are filled as -1
| Pixel properties | Quadrant properties | ||||||
|---|---|---|---|---|---|---|---|
| Quadrant | DetID | PixID | Counts | Sigma | Mean | Median | Sigma |
| A | 14 | 111 | 647021 | 3927.57 | 829 | 816 | 164.5 |
| A | 6 | 16 | 21764 | 127.32 | 829 | 816 | 164.5 |
| A | 4 | 2 | 21693 | 126.89 | 829 | 816 | 164.5 |
| B | 3 | 64 | 1506726 | 9973.38 | 816 | 798 | 151.0 |
| B | 5 | 172 | 32083 | 207.19 | 816 | 798 | 151.0 |
| B | 12 | 111 | 17277 | 109.13 | 816 | 798 | 151.0 |
| C | 14 | 238 | 128753 | 714.67 | 786 | 792 | 179.0 |
| C | 7 | 247 | 47803 | 262.56 | 786 | 792 | 179.0 |
| C | 2 | 16 | 31686 | 172.54 | 786 | 792 | 179.0 |
| D | 1 | 52 | 103013 | 539.33 | 797 | 777 | 189.6 |
| D | 12 | 218 | 86691 | 453.22 | 797 | 777 | 189.6 |
| D | 9 | 1 | 54304 | 282.37 | 797 | 777 | 189.6 |
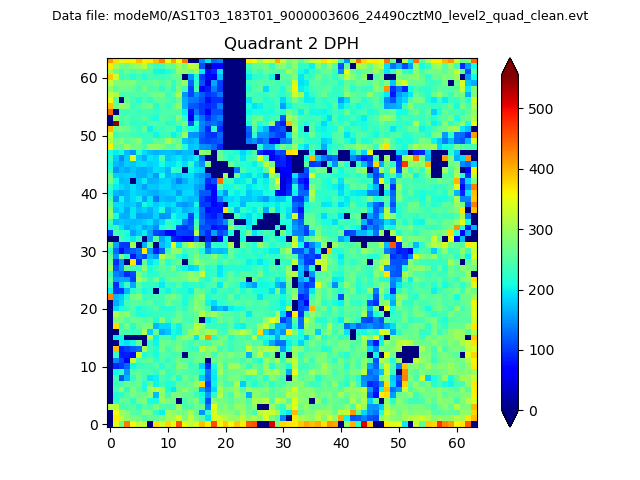
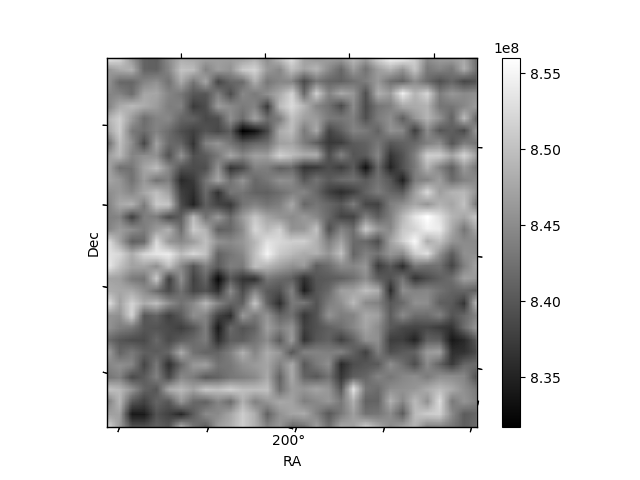
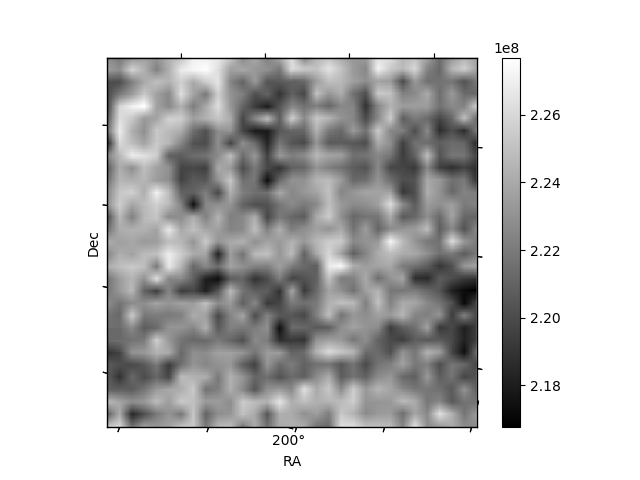
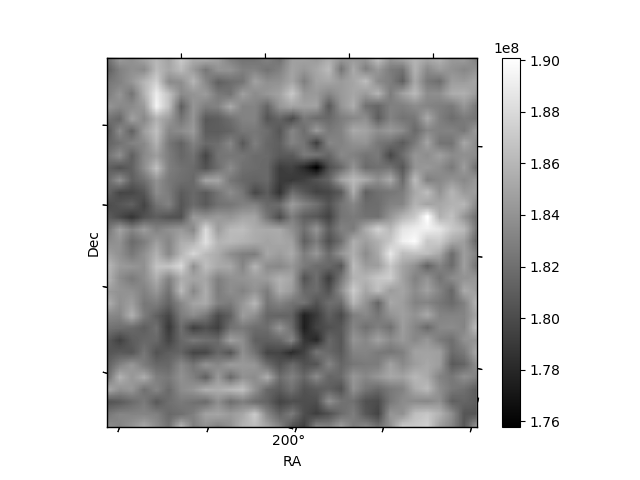
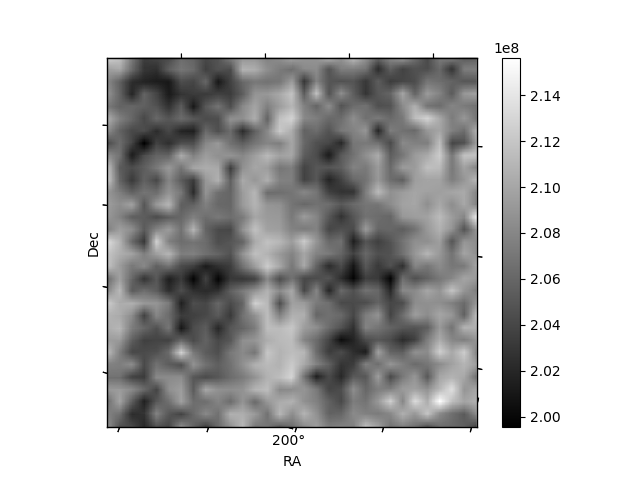
Histogram calculated using DETX and DETY for each event in the final _common_clean file
| Quadrant A | 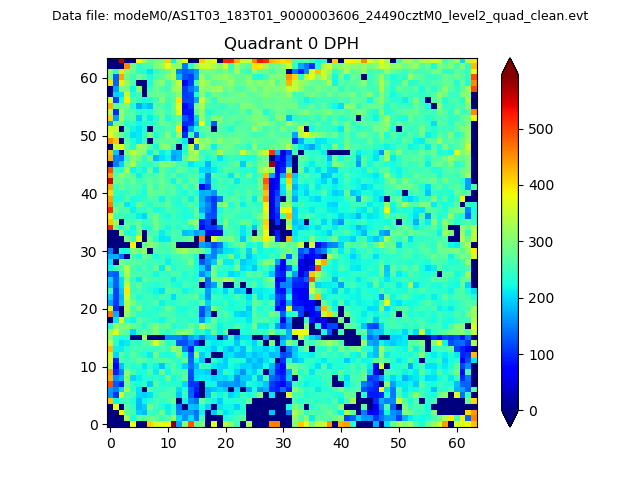 |
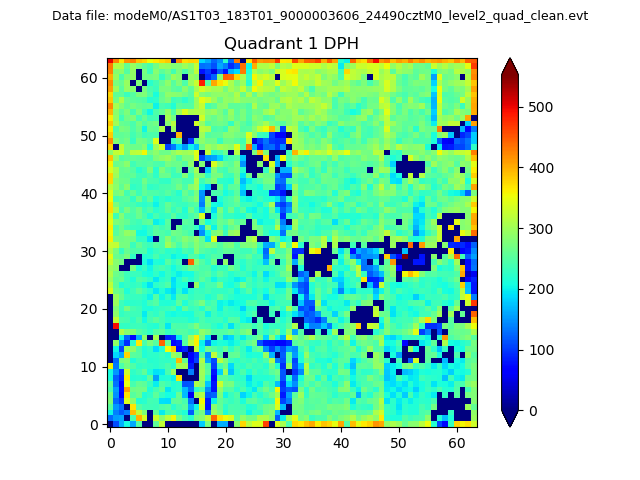 |
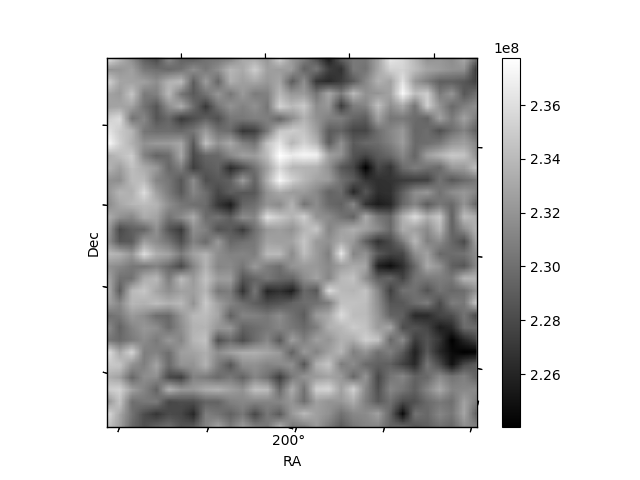
Quadrant B |
|---|---|---|---|
| Quadrant D | 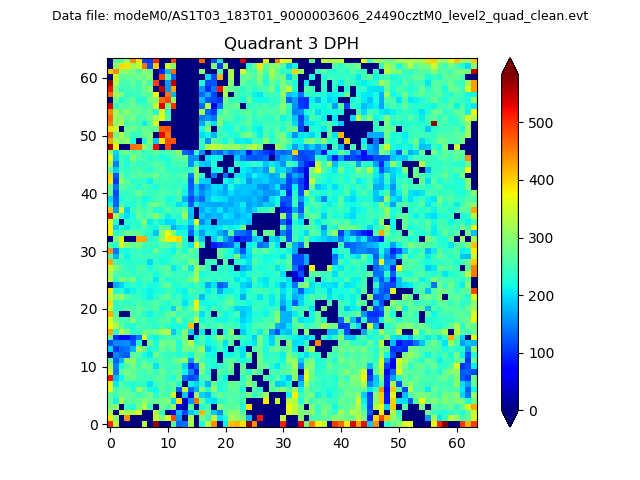 |
 |
Quadrant C |
| Plot type | Count rate plots | Images |
|---|---|---|
| Comparison with Poisson distribution Blue bars denote a histogram of data divided into 1 sec bins. Red curve is a Poisson curve with rate = median count rate of data. |
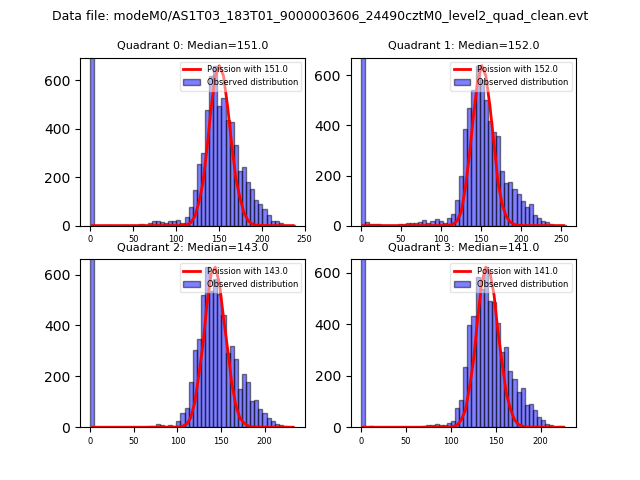 |
 |
| Quadrant-wise count rates Data is divided into 100 sec bins |
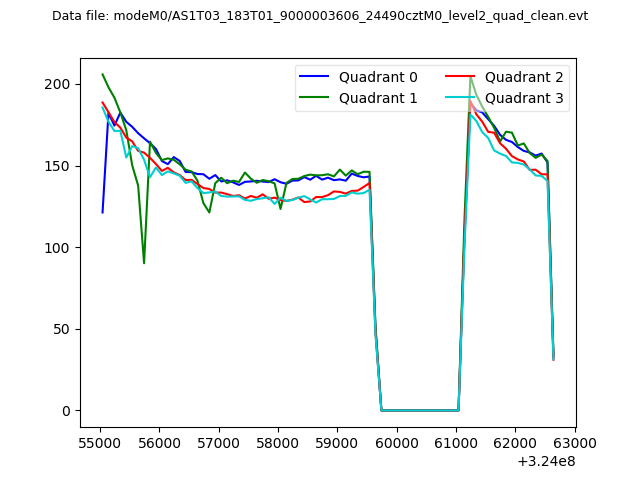 |
|
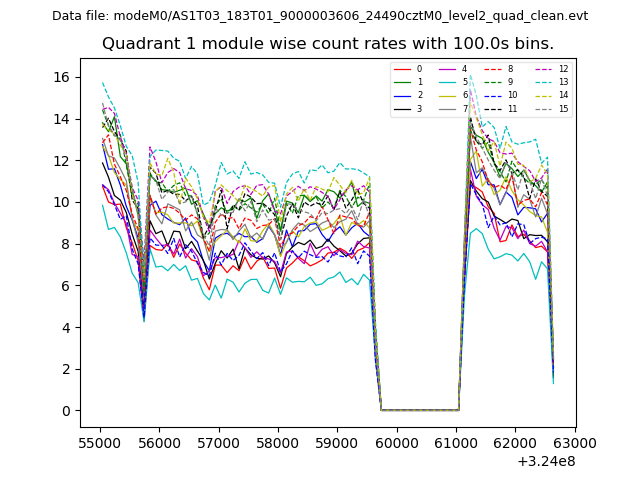
| Module-wise count rates for Quadrant A Data is divided into 100 sec bins |
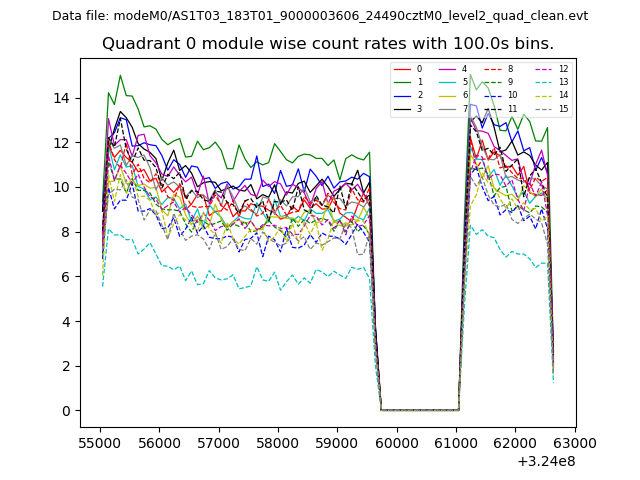 |
 |
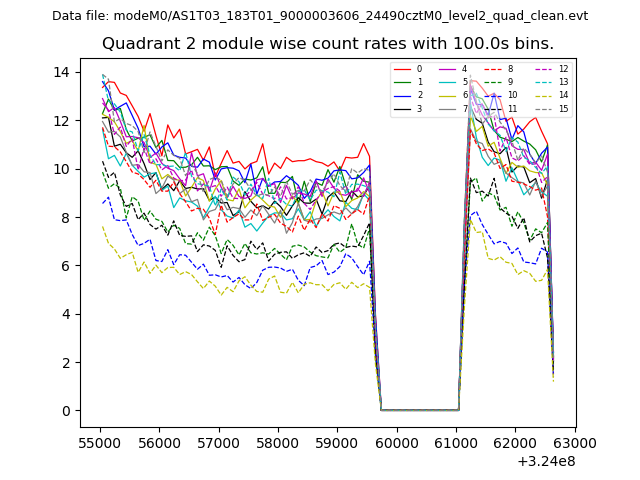
| Module-wise count rates for Quadrant B Data is divided into 100 sec bins |
 |
 |
| Module-wise count rates for Quadrant C Data is divided into 100 sec bins |
 |
 |
| Module-wise count rates for Quadrant D Data is divided into 100 sec bins |
 |
 |
| Parameter | Plot |
|---|---|
| CZT HV Monitor | 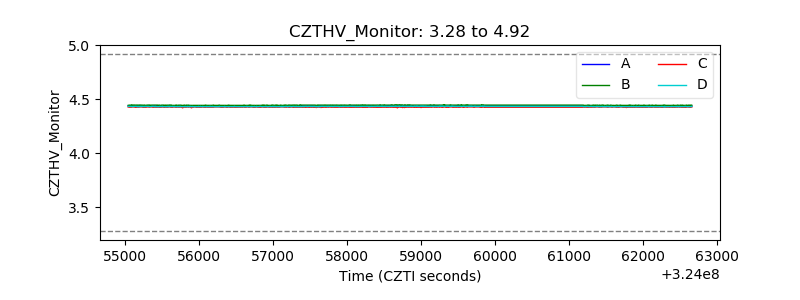 |
| D_VDD | 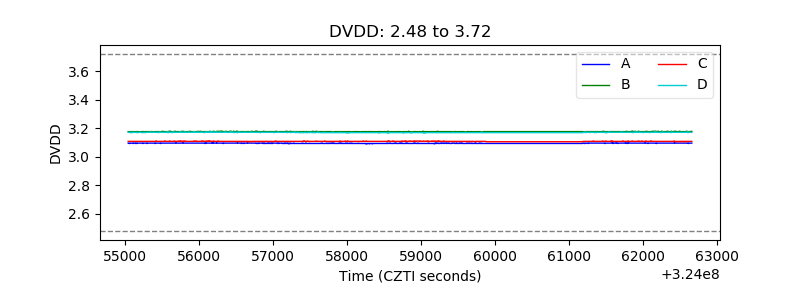 |
| Temperature 1 | 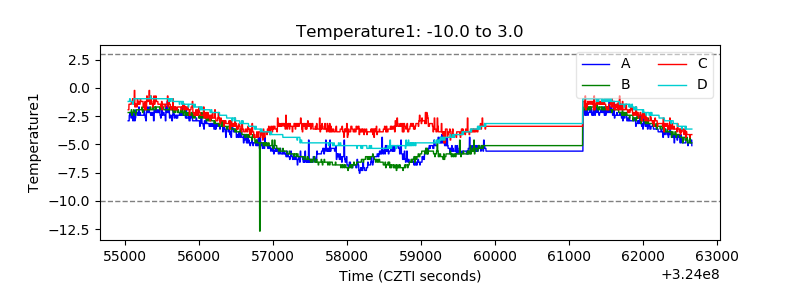 |
| Veto HV Monitor | 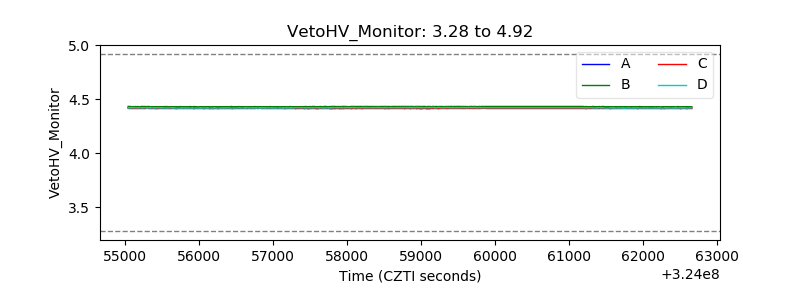 |
| Veto LLD |  |
| Alpha Counter | 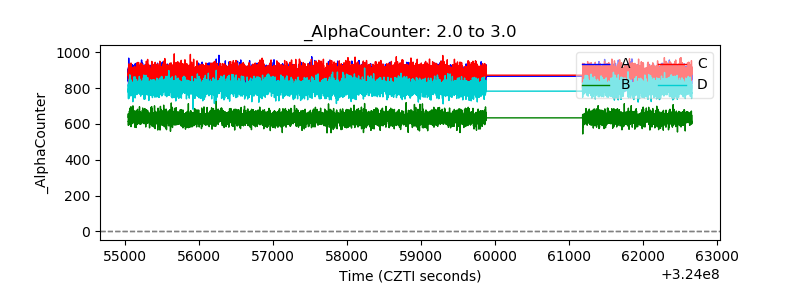 |
| _CPM_Rate | 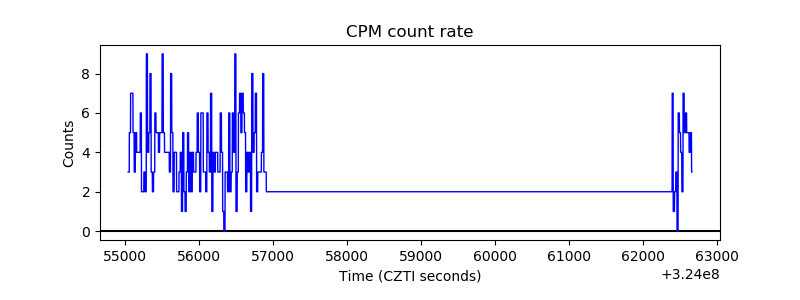 |
| CZT Counter | 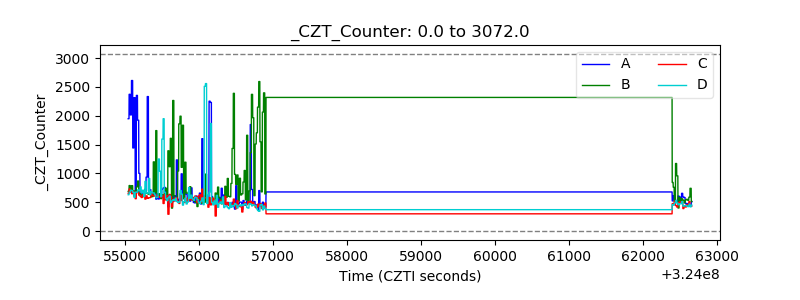 |
| +2.5 Volts monitor |  |
| +5 Volts monitor | 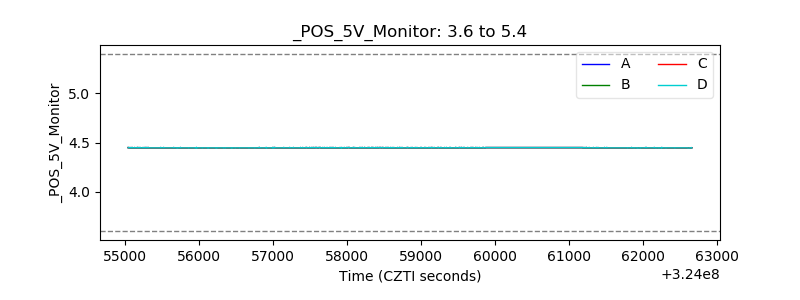 |
| _ROLL_ROT | 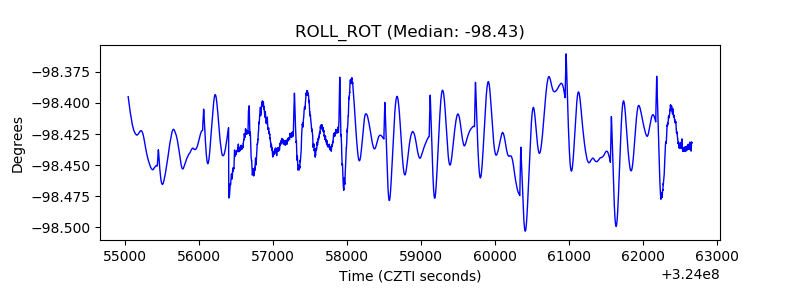 |
| _Roll_DEC | 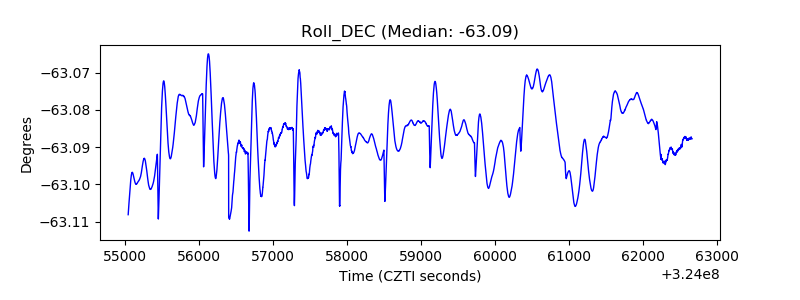 |
| _Roll_RA | 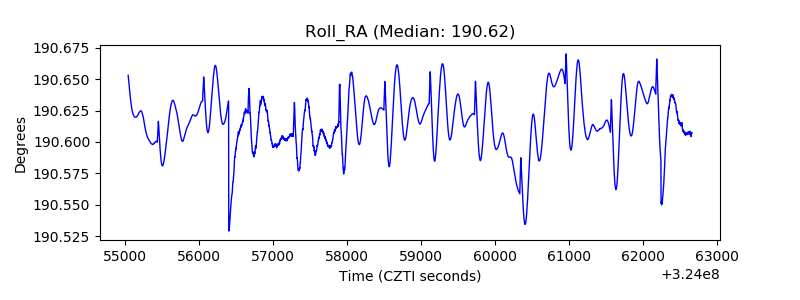 |
| Veto Counter | 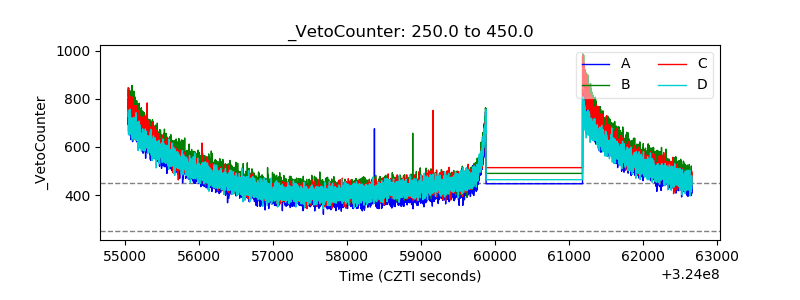 |