| Param | Original file | Final file |
|---|---|---|
| Filename | modeM0/AS1T03_183T01_9000003606_24491cztM0_level2.evt | modeM0/AS1T03_183T01_9000003606_24491cztM0_level2_quad_clean.evt |
| Size (bytes) | 253,494,720 | 126,789,120 |
| Size | 241.8 MB | 120.9 MB |
| Events in quadrant A | 3,827,607 | 870,091 |
| Events in quadrant B | 3,853,296 | 894,310 |
| Events in quadrant C | 3,348,333 | 829,331 |
| Events in quadrant D | 3,226,812 | 810,792 |
| Mode M0 | |||
|---|---|---|---|
| Quadrant | BADHDUFLAG | Total packets | Discarded packets |
| A | 0 | 15541 | 2 |
| B | 0 | 15466 | 2 |
| C | 0 | 13835 | 2 |
| D | 0 | 13746 | 2 |
| Mode SS | |||
|---|---|---|---|
| Quadrant | BADHDUFLAG | Total packets | Discarded packets |
| A | 0 | 126 | 0 |
| B | 0 | 126 | 0 |
| C | 0 | 126 | 0 |
| D | 0 | 126 | 0 |
| Mode M9 | |||
|---|---|---|---|
| Quadrant | BADHDUFLAG | Total packets | Discarded packets |
| A | 0 | 14 | 0 |
| B | 0 | 15 | 0 |
| C | 0 | 15 | 0 |
| D | 0 | 15 | 0 |
| Quadrant | Total seconds | Saturated seconds | Saturation percentage |
|---|---|---|---|
| A | 6254 | 187 | 2.990086% |
| B | 6254 | 172 | 2.750240% |
| C | 6253 | 104 | 1.663202% |
| D | 6253 | 50 | 0.799616% |
Noise dominated data is calculated using 1-second bins in cleaned event files. If a bin has >2000 counts, and if more than 50% of those come from <1% of pixels, then it is considered to be noise-dominated and hence unusable.
| Quadrant | # 1 sec bins | Bins with >0 counts | Bins with >2000 counts | High rate bins dominated by noise | Noise dominated (total time) | Noise dominated (detector-on time) | Marked lightcurve |
|---|---|---|---|---|---|---|---|
| A | 7574 | 6256 | 27 | 27 | 0.36% | 0.43% | 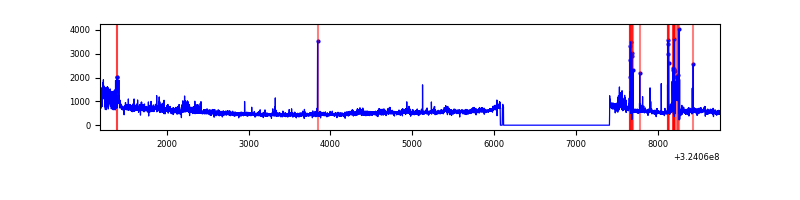 |
| B | 7574 | 6256 | 53 | 53 | 0.70% | 0.85% | 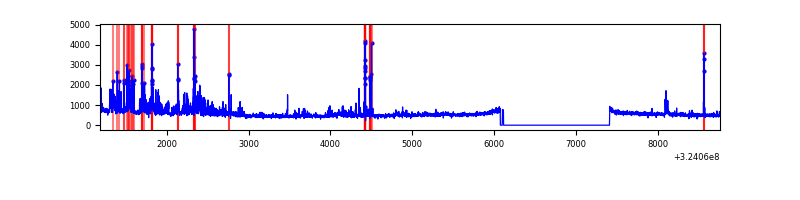 |
| C | 7573 | 6255 | 16 | 16 | 0.21% | 0.26% |  |
| D | 7573 | 6255 | 7 | 7 | 0.09% | 0.11% | 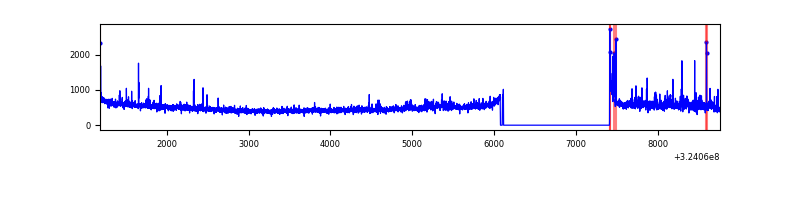 |
Top three noisy pixels from each quadrant. If the there are fewer than three noisy pixels in the level2.evt file, extra rows are filled as -1
| Pixel properties | Quadrant properties | ||||||
|---|---|---|---|---|---|---|---|
| Quadrant | DetID | PixID | Counts | Sigma | Mean | Median | Sigma |
| A | 14 | 111 | 640550 | 3954.21 | 817 | 805 | 161.8 |
| A | 6 | 16 | 18135 | 107.12 | 817 | 805 | 161.8 |
| A | 3 | 1 | 11159 | 64.0 | 817 | 805 | 161.8 |
| B | 3 | 64 | 587637 | 3859.99 | 821 | 803 | 152.0 |
| B | 5 | 172 | 36824 | 236.93 | 821 | 803 | 152.0 |
| B | 15 | 33 | 20865 | 131.96 | 821 | 803 | 152.0 |
| C | 2 | 16 | 152370 | 853.4 | 773 | 779 | 177.6 |
| C | 14 | 238 | 128083 | 716.67 | 773 | 779 | 177.6 |
| C | 7 | 247 | 35022 | 192.78 | 773 | 779 | 177.6 |
| D | 1 | 52 | 109083 | 576.8 | 779 | 757 | 187.8 |
| D | 12 | 218 | 100917 | 533.31 | 779 | 757 | 187.8 |
| D | 8 | 195 | 31461 | 163.49 | 779 | 757 | 187.8 |
Histogram calculated using DETX and DETY for each event in the final _common_clean file
| Quadrant A |  |
 |
Quadrant B |
|---|---|---|---|
| Quadrant D |  |
 |
Quadrant C |
| Plot type | Count rate plots | Images |
|---|---|---|
| Comparison with Poisson distribution Blue bars denote a histogram of data divided into 1 sec bins. Red curve is a Poisson curve with rate = median count rate of data. |
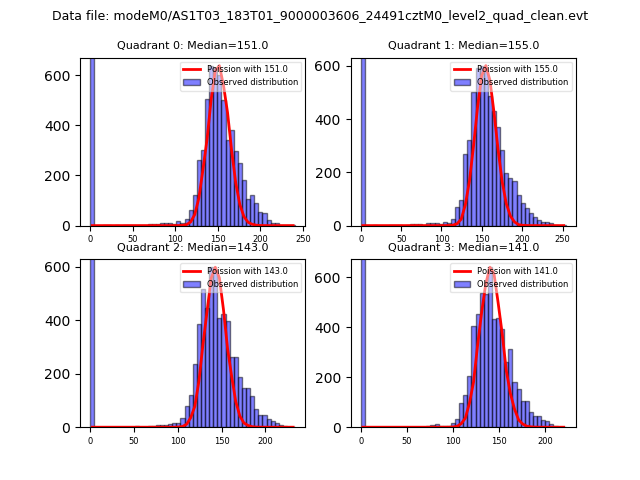 |
 |
| Quadrant-wise count rates Data is divided into 100 sec bins |
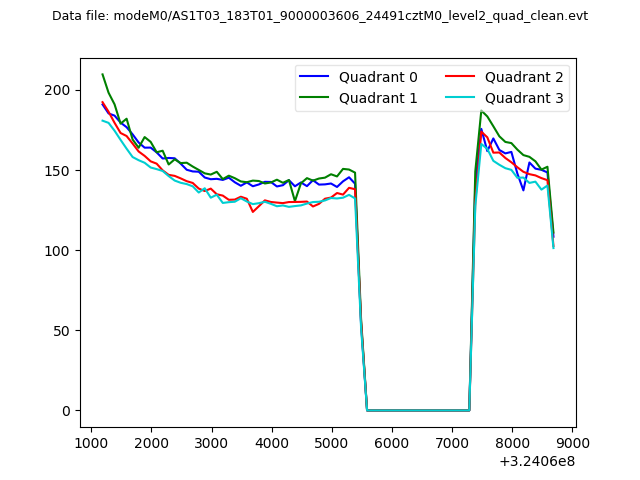 |
|
| Module-wise count rates for Quadrant A Data is divided into 100 sec bins |
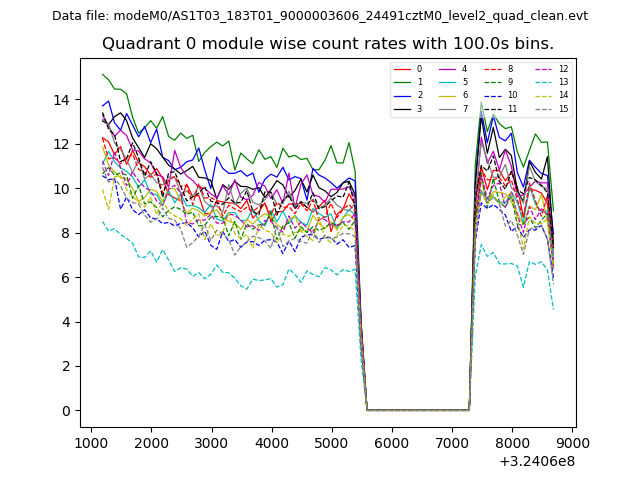 |
 |
| Module-wise count rates for Quadrant B Data is divided into 100 sec bins |
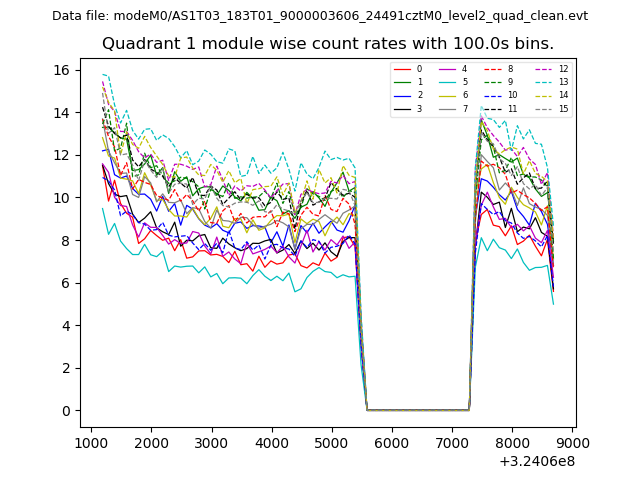 |
 |
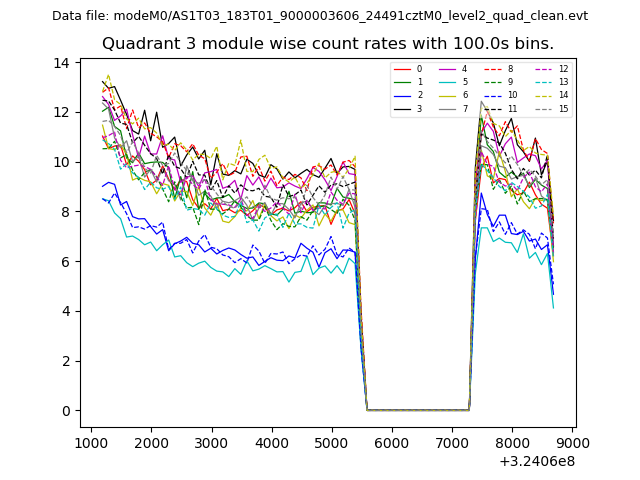
| Module-wise count rates for Quadrant C Data is divided into 100 sec bins |
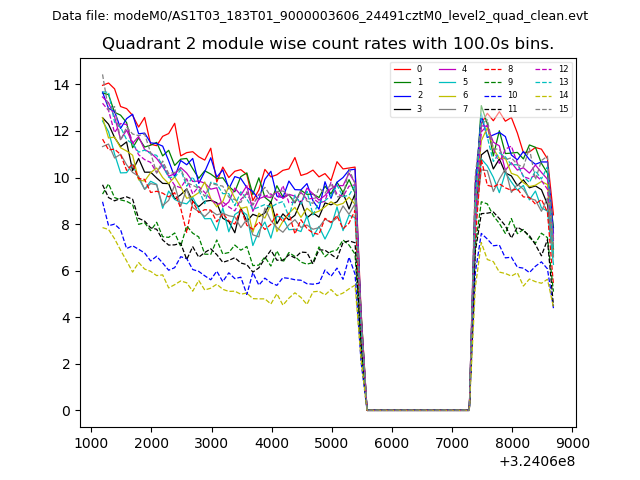 |
 |
| Module-wise count rates for Quadrant D Data is divided into 100 sec bins |
 |
 |
| Parameter | Plot |
|---|---|
| CZT HV Monitor | 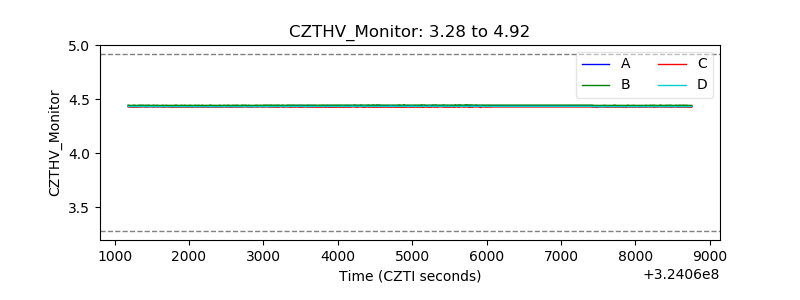 |
| D_VDD |  |
| Temperature 1 |  |
| Veto HV Monitor |  |
| Veto LLD |  |
| Alpha Counter | 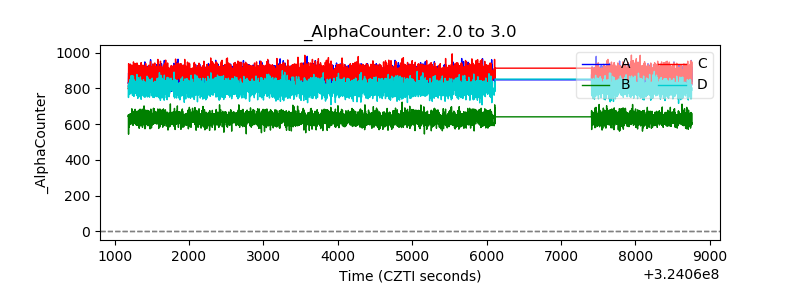 |
| _CPM_Rate | 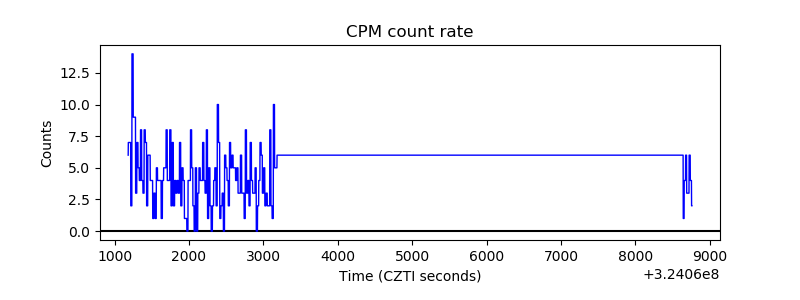 |
| CZT Counter |  |
| +2.5 Volts monitor |  |
| +5 Volts monitor |  |
| _ROLL_ROT |  |
| _Roll_DEC |  |
| _Roll_RA |  |
| Veto Counter | 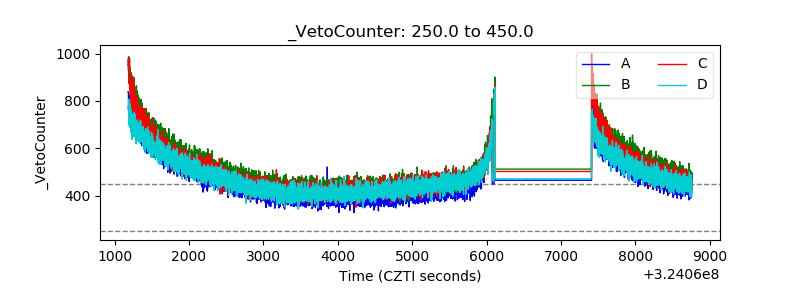 |