| Param | Original file | Final file |
|---|---|---|
| Filename | modeM0/AS1T03_183T01_9000003606_24492cztM0_level2.evt | modeM0/AS1T03_183T01_9000003606_24492cztM0_level2_quad_clean.evt |
| Size (bytes) | 532,209,600 | 114,600,960 |
| Size | 507.6 MB | 109.3 MB |
| Events in quadrant A | 5,424,860 | 722,166 |
| Events in quadrant B | 3,592,976 | 820,968 |
| Events in quadrant C | 3,081,910 | 763,511 |
| Events in quadrant D | 3,602,305 | 735,915 |
| Mode M0 | |||
|---|---|---|---|
| Quadrant | BADHDUFLAG | Total packets | Discarded packets |
| A | 0 | 20227 | 2 |
| B | 0 | 14651 | 2 |
| C | 0 | 12990 | 2 |
| D | 0 | 14840 | 2 |
| Mode SS | |||
|---|---|---|---|
| Quadrant | BADHDUFLAG | Total packets | Discarded packets |
| A | 0 | 124 | 0 |
| B | 0 | 124 | 0 |
| C | 0 | 124 | 0 |
| D | 0 | 124 | 0 |
| Mode M9 | |||
|---|---|---|---|
| Quadrant | BADHDUFLAG | Total packets | Discarded packets |
| A | 0 | 14 | 0 |
| B | 0 | 15 | 0 |
| C | 0 | 15 | 0 |
| D | 0 | 15 | 0 |
| Quadrant | Total seconds | Saturated seconds | Saturation percentage |
|---|---|---|---|
| A | 6132 | 1011 | 16.487280% |
| B | 6132 | 160 | 2.609263% |
| C | 6132 | 86 | 1.402479% |
| D | 6132 | 124 | 2.022179% |
Noise dominated data is calculated using 1-second bins in cleaned event files. If a bin has >2000 counts, and if more than 50% of those come from <1% of pixels, then it is considered to be noise-dominated and hence unusable.
| Quadrant | # 1 sec bins | Bins with >0 counts | Bins with >2000 counts | High rate bins dominated by noise | Noise dominated (total time) | Noise dominated (detector-on time) | Marked lightcurve |
|---|---|---|---|---|---|---|---|
| A | 7448 | 6134 | 531 | 531 | 7.13% | 8.66% | 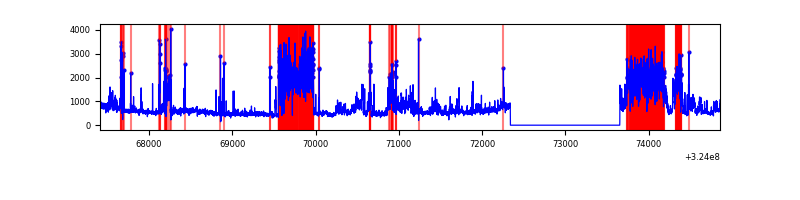 |
| B | 7448 | 6134 | 46 | 46 | 0.62% | 0.75% | 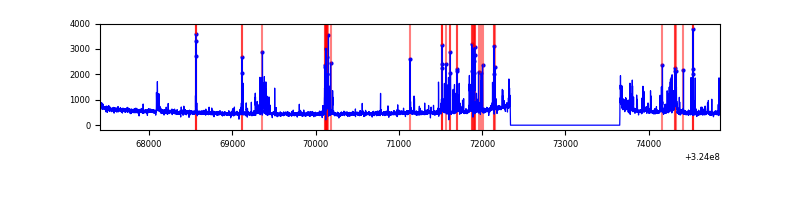 |
| C | 7448 | 6134 | 9 | 9 | 0.12% | 0.15% | 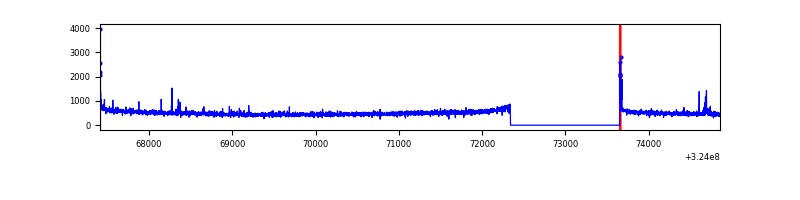 |
| D | 7448 | 6134 | 93 | 93 | 1.25% | 1.52% | 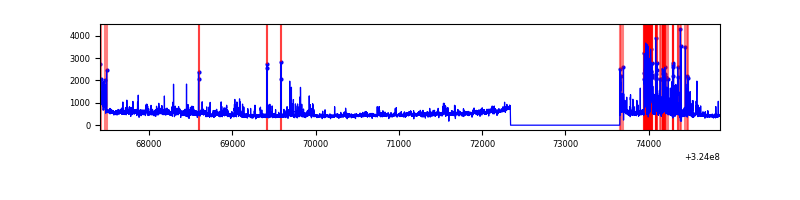 |
Top three noisy pixels from each quadrant. If the there are fewer than three noisy pixels in the level2.evt file, extra rows are filled as -1
| Pixel properties | Quadrant properties | ||||||
|---|---|---|---|---|---|---|---|
| Quadrant | DetID | PixID | Counts | Sigma | Mean | Median | Sigma |
| A | 14 | 111 | 2630797 | 18504.25 | 717 | 705 | 142.1 |
| A | 4 | 2 | 17954 | 121.36 | 717 | 705 | 142.1 |
| A | 13 | 254 | 9168 | 59.54 | 717 | 705 | 142.1 |
| B | 3 | 64 | 524987 | 3640.39 | 776 | 758 | 144.0 |
| B | 15 | 33 | 17423 | 115.73 | 776 | 758 | 144.0 |
| B | 12 | 111 | 17072 | 113.29 | 776 | 758 | 144.0 |
| C | 14 | 238 | 121771 | 713.73 | 736 | 741 | 169.6 |
| C | 2 | 16 | 41988 | 243.24 | 736 | 741 | 169.6 |
| C | 0 | 10 | 34860 | 201.2 | 736 | 741 | 169.6 |
| D | 12 | 218 | 545598 | 3062.92 | 734 | 712 | 177.9 |
| D | 1 | 52 | 190854 | 1068.83 | 734 | 712 | 177.9 |
| D | 8 | 195 | 49389 | 273.62 | 734 | 712 | 177.9 |
Histogram calculated using DETX and DETY for each event in the final _common_clean file
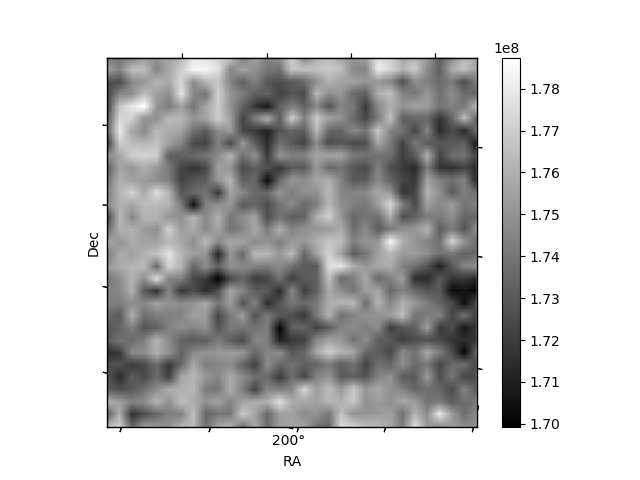
| Quadrant A | 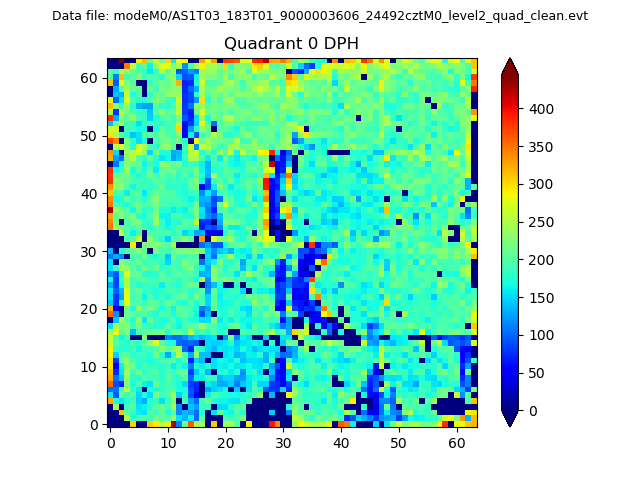 |
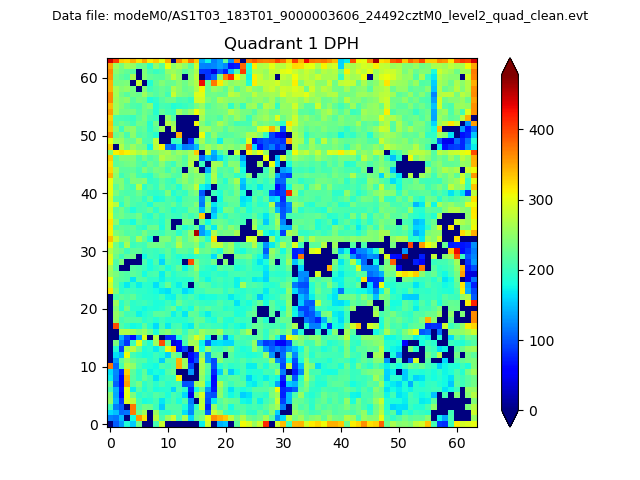 |
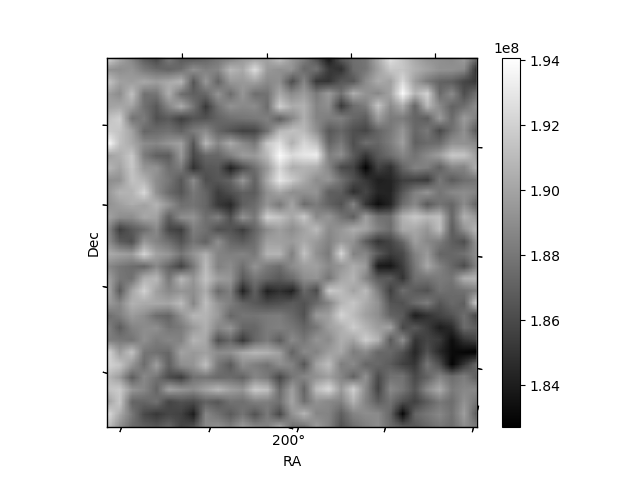
Quadrant B |
|---|---|---|---|
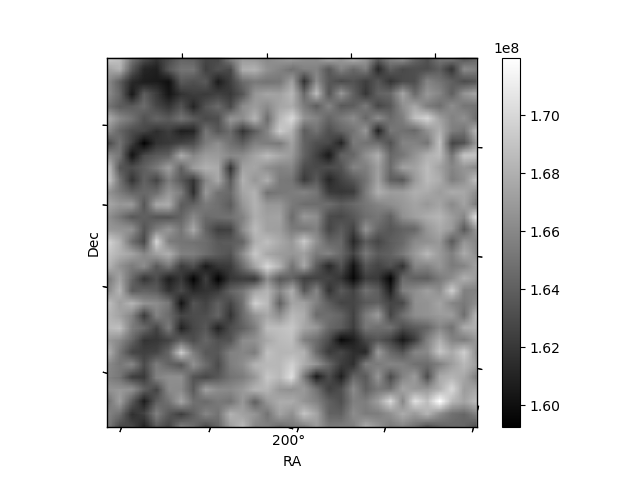
| Quadrant D | 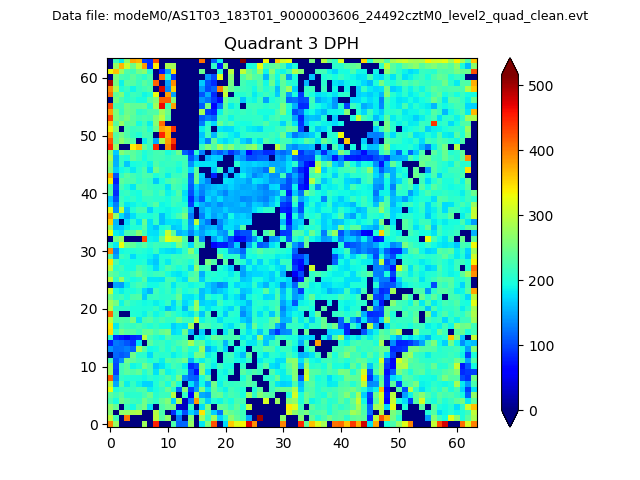 |
 |
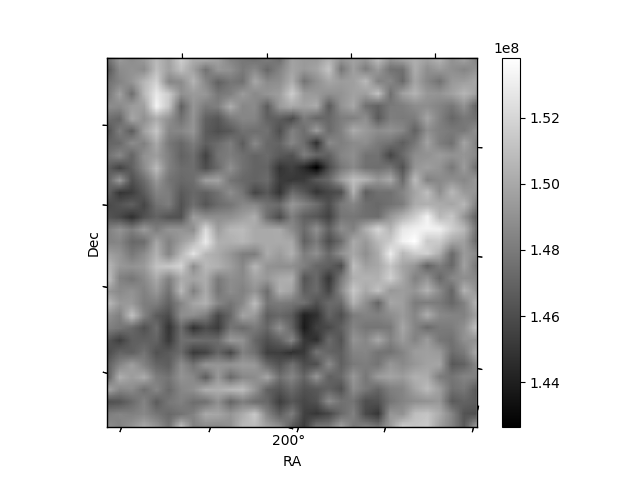
Quadrant C |
| Plot type | Count rate plots | Images |
|---|---|---|
| Comparison with Poisson distribution Blue bars denote a histogram of data divided into 1 sec bins. Red curve is a Poisson curve with rate = median count rate of data. |
 |
 |
| Quadrant-wise count rates Data is divided into 100 sec bins |
 |
|
| Module-wise count rates for Quadrant A Data is divided into 100 sec bins |
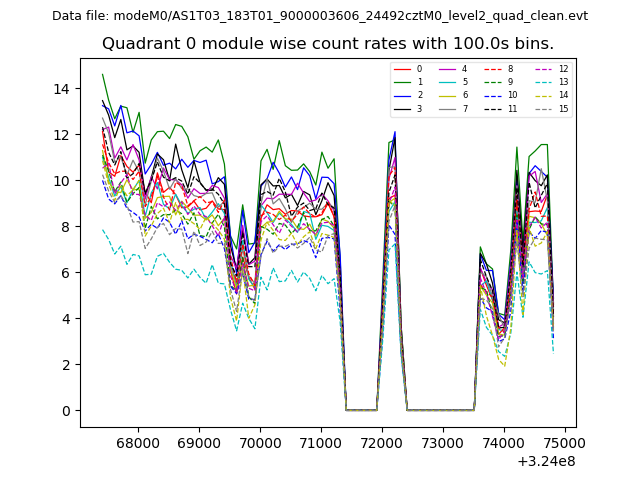 |
 |
| Module-wise count rates for Quadrant B Data is divided into 100 sec bins |
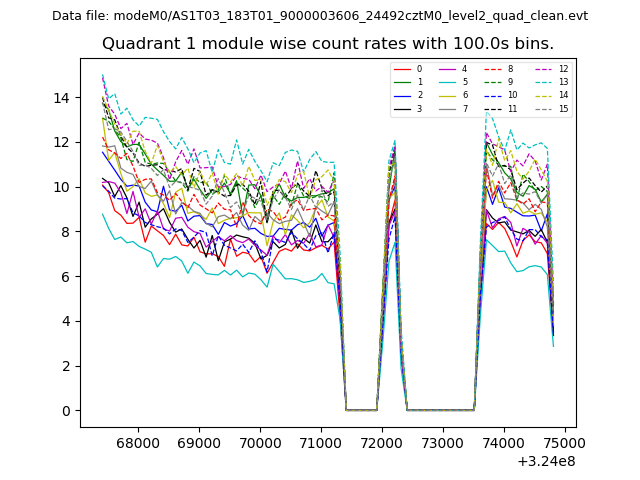 |
 |
| Module-wise count rates for Quadrant C Data is divided into 100 sec bins |
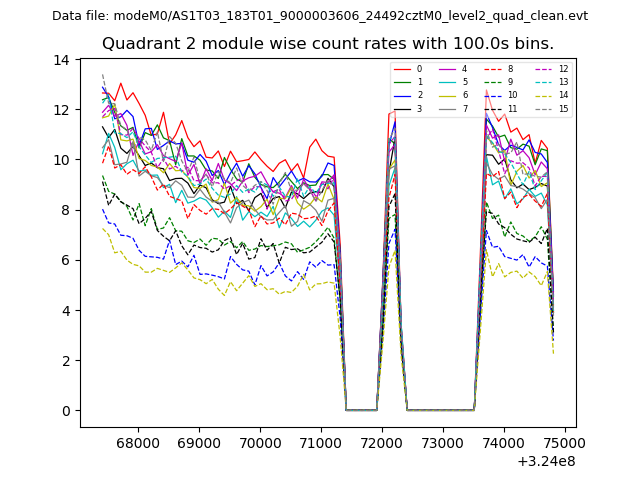 |
 |
| Module-wise count rates for Quadrant D Data is divided into 100 sec bins |
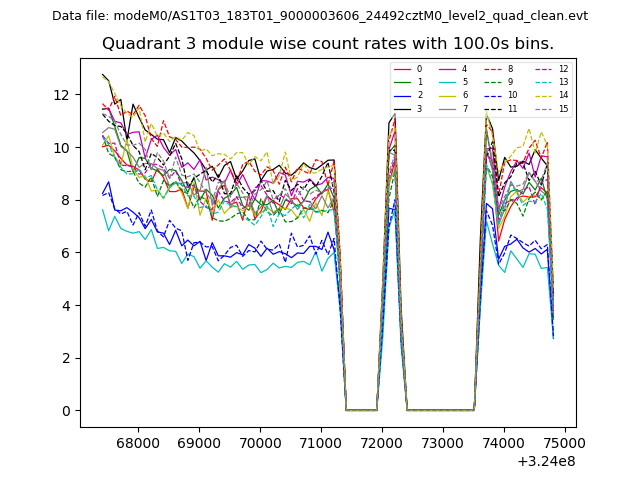 |
 |
| Parameter | Plot |
|---|---|
| CZT HV Monitor | 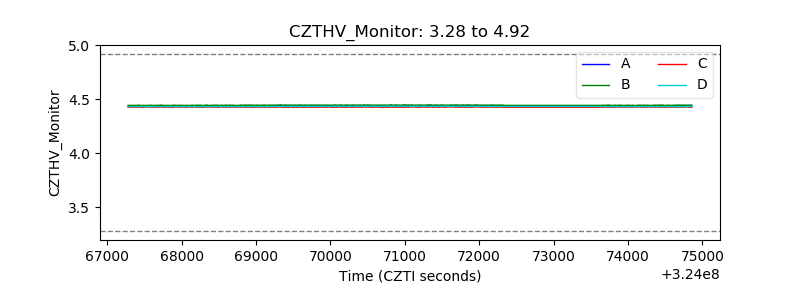 |
| D_VDD | 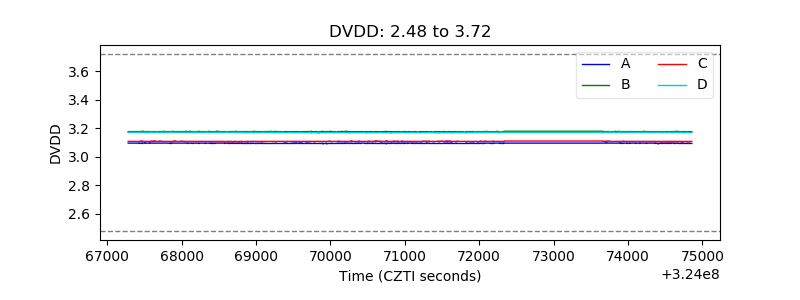 |
| Temperature 1 | 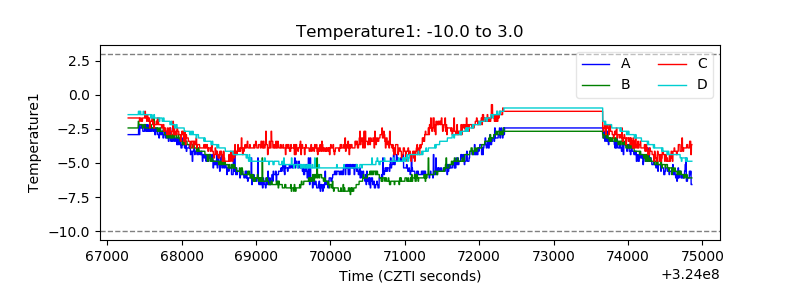 |
| Veto HV Monitor | 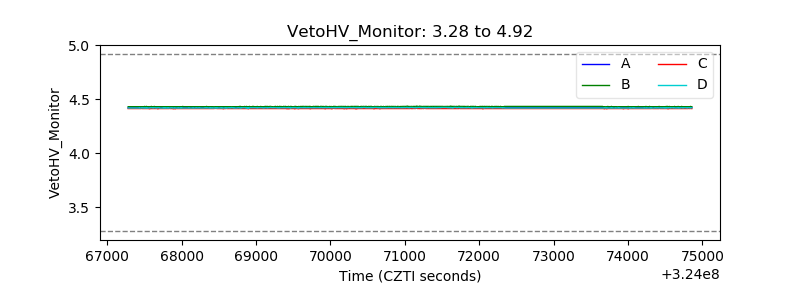 |
| Veto LLD | 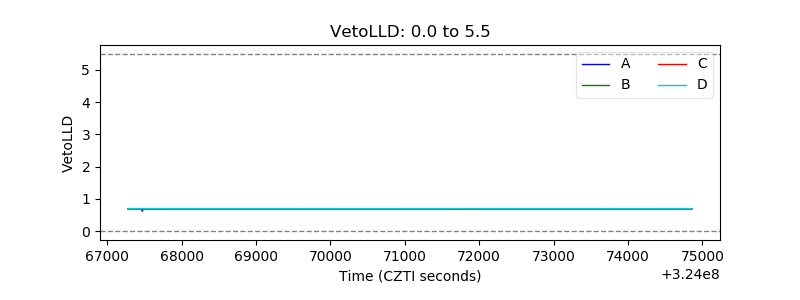 |
| Alpha Counter |  |
| _CPM_Rate | 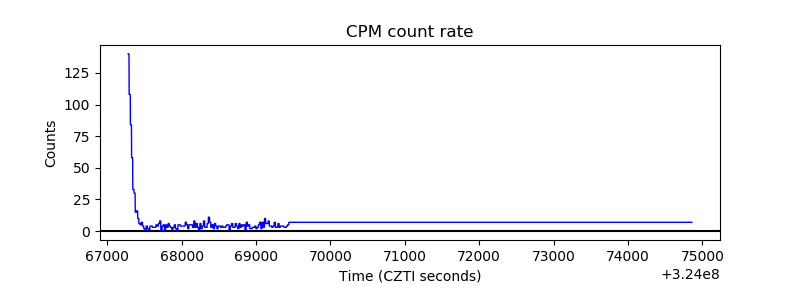 |
| CZT Counter | 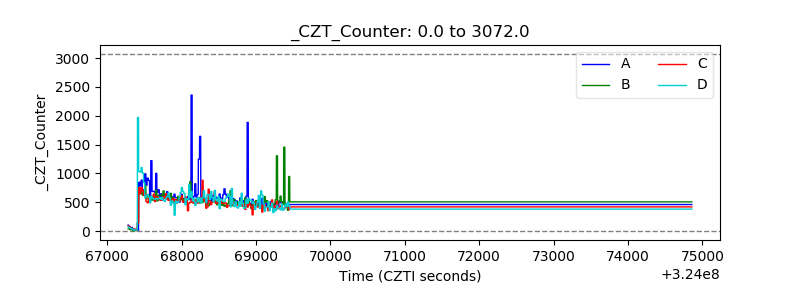 |
| +2.5 Volts monitor |  |
| +5 Volts monitor |  |
| _ROLL_ROT | 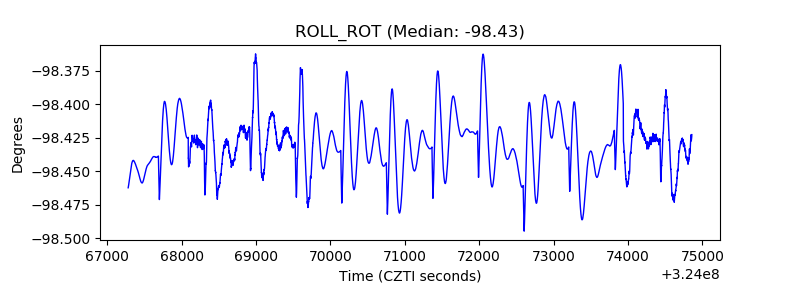 |
| _Roll_DEC | 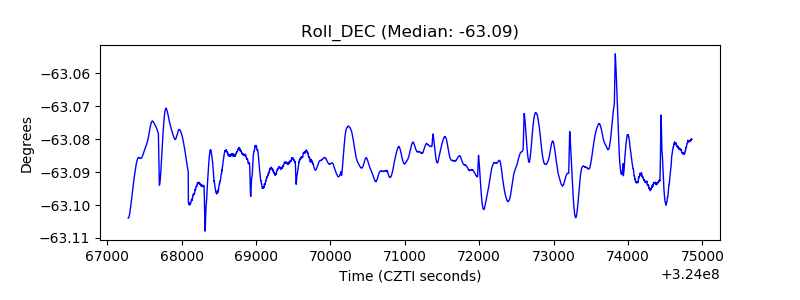 |
| _Roll_RA | 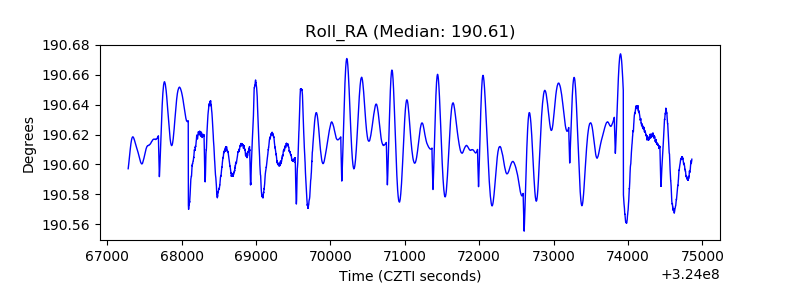 |
| Veto Counter | 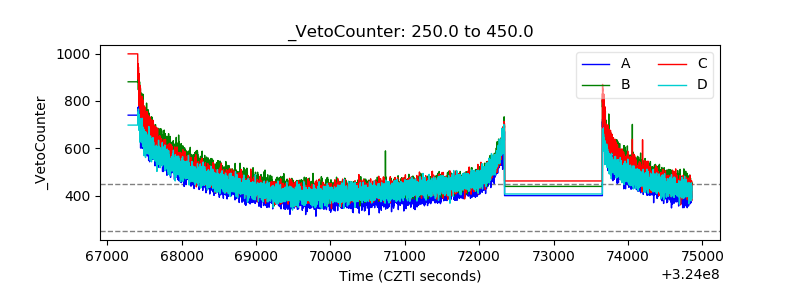 |