| Param | Original file | Final file |
|---|---|---|
| Filename | modeM0/AS1T03_183T01_9000003606_24494cztM0_level2.evt | modeM0/AS1T03_183T01_9000003606_24494cztM0_level2_quad_clean.evt |
| Size (bytes) | 591,105,600 | 122,964,480 |
| Size | 563.7 MB | 117.3 MB |
| Events in quadrant A | 6,220,087 | 797,164 |
| Events in quadrant B | 3,809,374 | 851,785 |
| Events in quadrant C | 3,278,858 | 807,603 |
| Events in quadrant D | 4,114,278 | 774,883 |
| Mode M0 | |||
|---|---|---|---|
| Quadrant | BADHDUFLAG | Total packets | Discarded packets |
| A | 0 | 23429 | 2 |
| B | 0 | 16028 | 2 |
| C | 0 | 14395 | 2 |
| D | 0 | 17027 | 2 |
| Mode SS | |||
|---|---|---|---|
| Quadrant | BADHDUFLAG | Total packets | Discarded packets |
| A | 0 | 142 | 0 |
| B | 0 | 142 | 0 |
| C | 0 | 142 | 0 |
| D | 0 | 142 | 0 |
| Mode M9 | |||
|---|---|---|---|
| Quadrant | BADHDUFLAG | Total packets | Discarded packets |
| A | 0 | 15 | 0 |
| B | 0 | 16 | 0 |
| C | 0 | 16 | 0 |
| D | 0 | 16 | 0 |
| Quadrant | Total seconds | Saturated seconds | Saturation percentage |
|---|---|---|---|
| A | 7077 | 548 | 7.743394% |
| B | 7077 | 133 | 1.879327% |
| C | 7077 | 62 | 0.876077% |
| D | 7076 | 188 | 2.656868% |
Noise dominated data is calculated using 1-second bins in cleaned event files. If a bin has >2000 counts, and if more than 50% of those come from <1% of pixels, then it is considered to be noise-dominated and hence unusable.
| Quadrant | # 1 sec bins | Bins with >0 counts | Bins with >2000 counts | High rate bins dominated by noise | Noise dominated (total time) | Noise dominated (detector-on time) | Marked lightcurve |
|---|---|---|---|---|---|---|---|
| A | 7807 | 7078 | 246 | 246 | 3.15% | 3.48% | 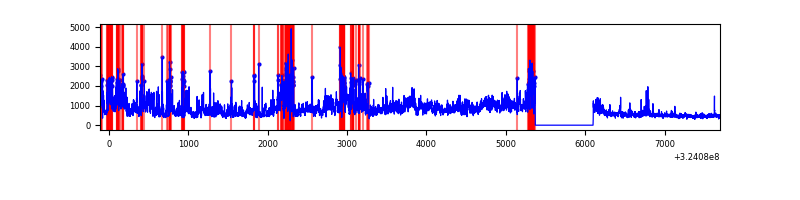 |
| B | 7807 | 7078 | 26 | 26 | 0.33% | 0.37% | 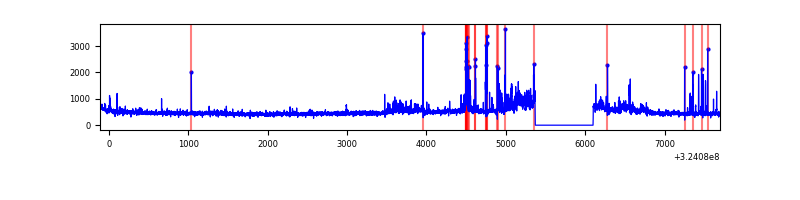 |
| C | 7807 | 7078 | 1 | 1 | 0.01% | 0.01% | 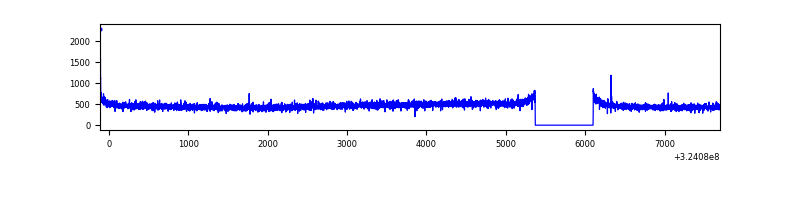 |
| D | 7806 | 7077 | 107 | 107 | 1.37% | 1.51% | 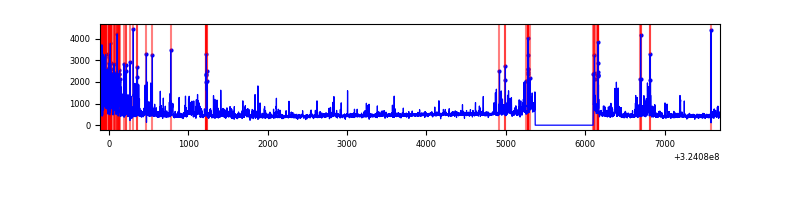 |
Top three noisy pixels from each quadrant. If the there are fewer than three noisy pixels in the level2.evt file, extra rows are filled as -1
| Pixel properties | Quadrant properties | ||||||
|---|---|---|---|---|---|---|---|
| Quadrant | DetID | PixID | Counts | Sigma | Mean | Median | Sigma |
| A | 14 | 111 | 3096198 | 19132.48 | 804 | 786 | 161.8 |
| A | 4 | 2 | 18720 | 110.85 | 804 | 786 | 161.8 |
| A | 13 | 254 | 11093 | 63.71 | 804 | 786 | 161.8 |
| B | 3 | 64 | 523187 | 3326.89 | 835 | 815 | 157.0 |
| B | 12 | 111 | 19203 | 117.11 | 835 | 815 | 157.0 |
| B | 11 | 111 | 16761 | 101.56 | 835 | 815 | 157.0 |
| C | 14 | 238 | 130782 | 694.96 | 802 | 806 | 187.0 |
| C | 2 | 16 | 15646 | 79.35 | 802 | 806 | 187.0 |
| C | 0 | 10 | 7446 | 35.5 | 802 | 806 | 187.0 |
| D | 12 | 218 | 563244 | 2915.47 | 794 | 768 | 192.9 |
| D | 1 | 52 | 360906 | 1866.7 | 794 | 768 | 192.9 |
| D | 8 | 195 | 134616 | 693.77 | 794 | 768 | 192.9 |
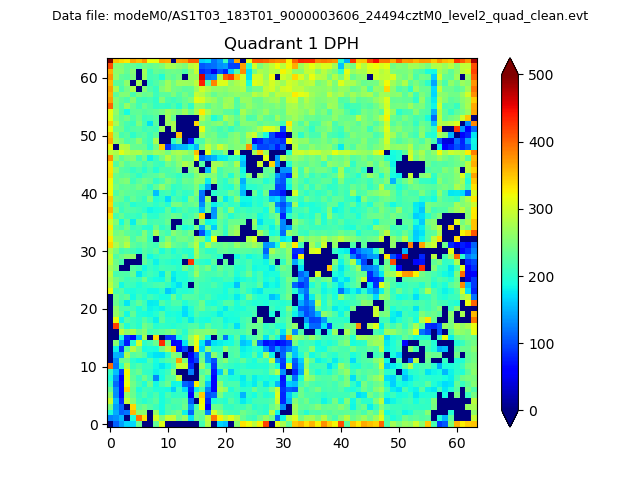
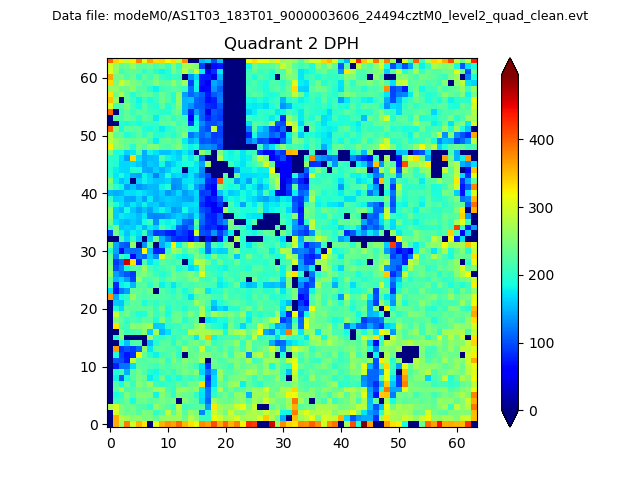
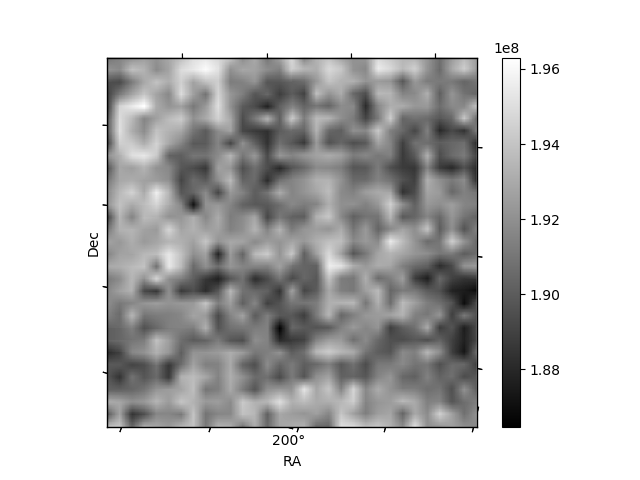
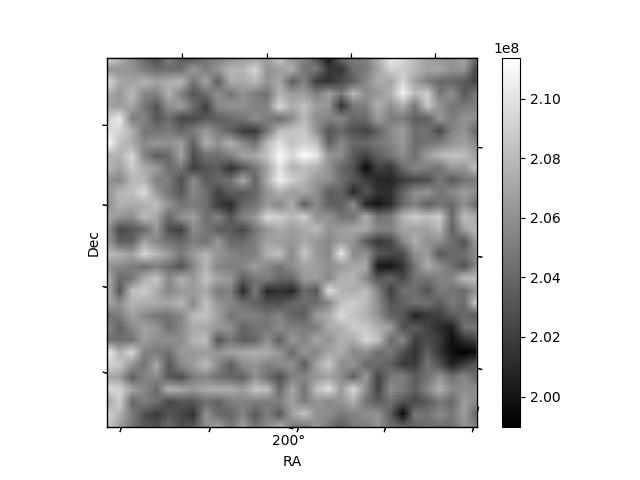
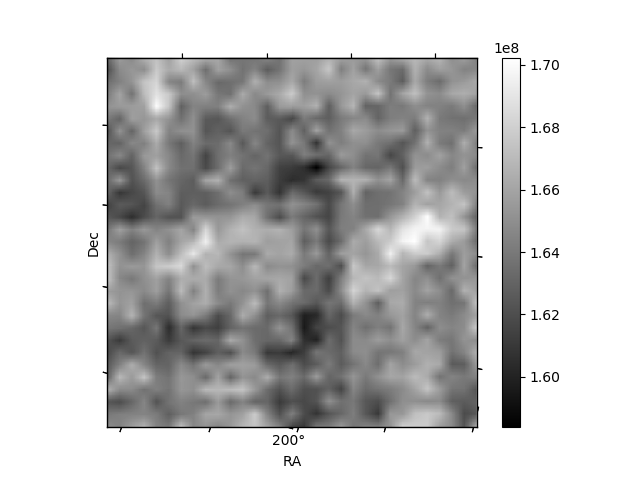
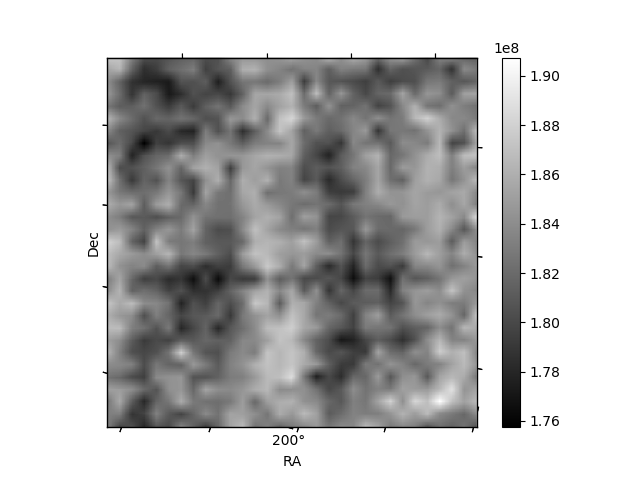
Histogram calculated using DETX and DETY for each event in the final _common_clean file
| Quadrant A |  |
 |
Quadrant B |
|---|---|---|---|
| Quadrant D | 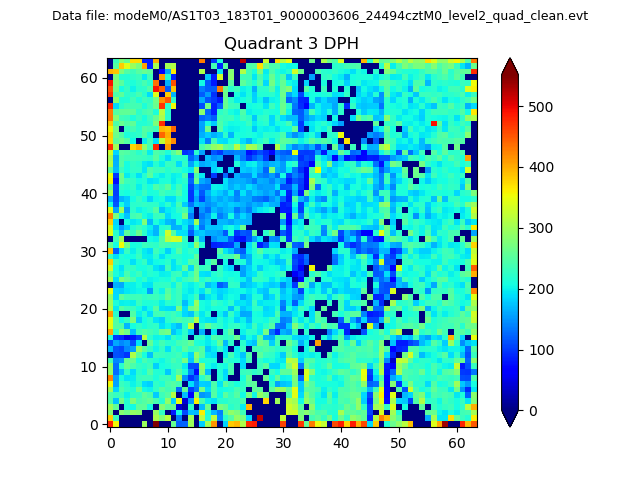 |
 |
Quadrant C |
| Plot type | Count rate plots | Images |
|---|---|---|
| Comparison with Poisson distribution Blue bars denote a histogram of data divided into 1 sec bins. Red curve is a Poisson curve with rate = median count rate of data. |
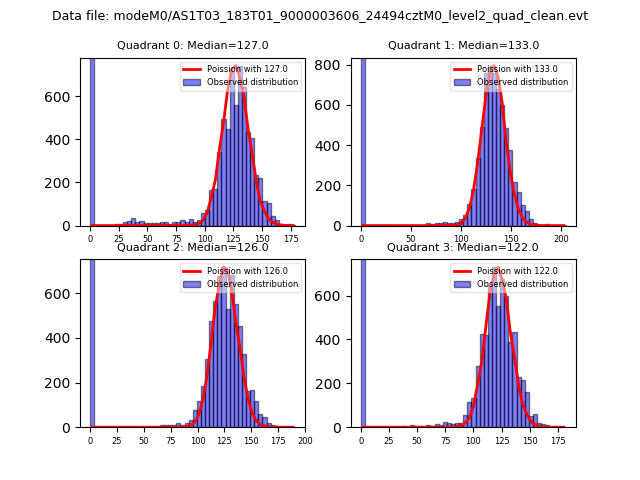 |
 |
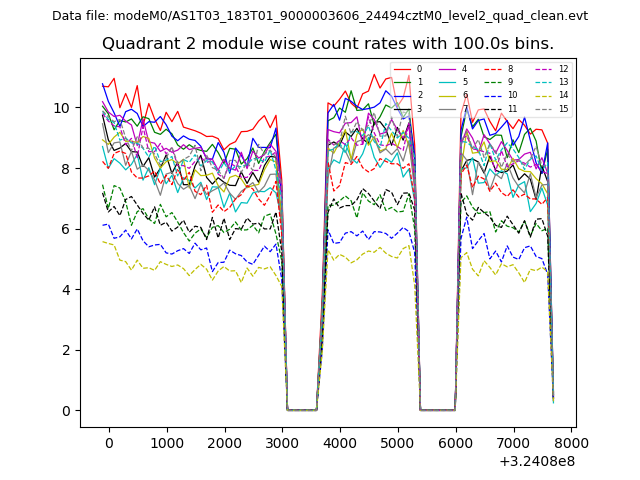
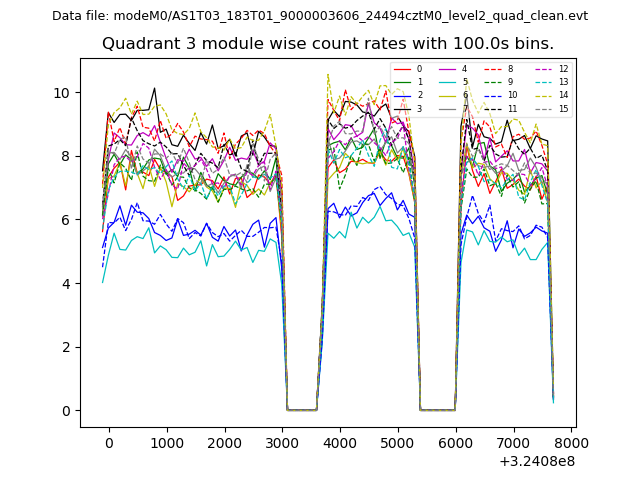
| Quadrant-wise count rates Data is divided into 100 sec bins |
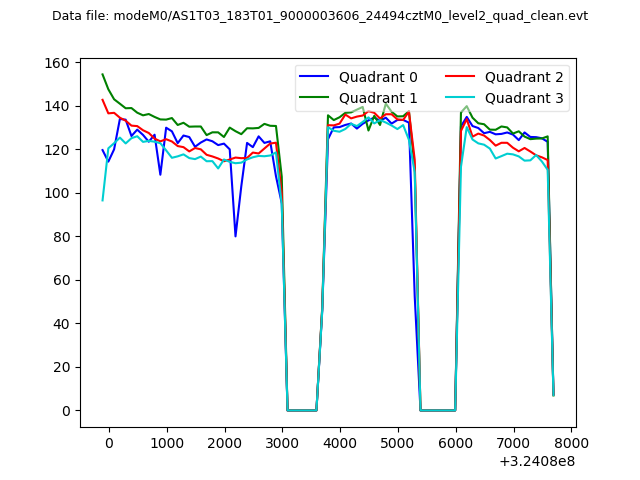 |
|
| Module-wise count rates for Quadrant A Data is divided into 100 sec bins |
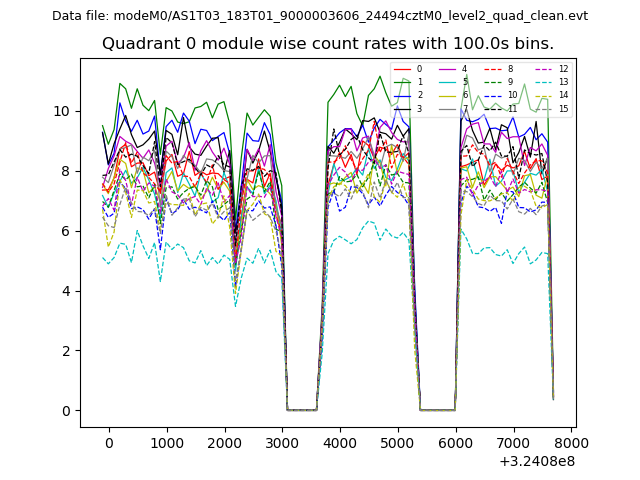 |
 |
| Module-wise count rates for Quadrant B Data is divided into 100 sec bins |
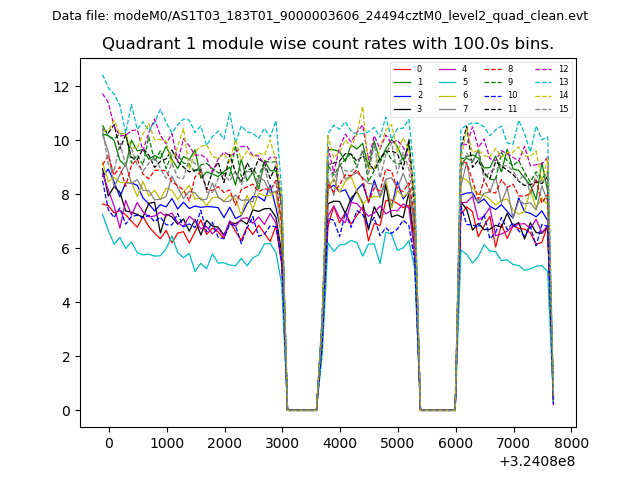 |
 |
| Module-wise count rates for Quadrant C Data is divided into 100 sec bins |
 |
 |
| Module-wise count rates for Quadrant D Data is divided into 100 sec bins |
 |
 |
| Parameter | Plot |
|---|---|
| CZT HV Monitor | 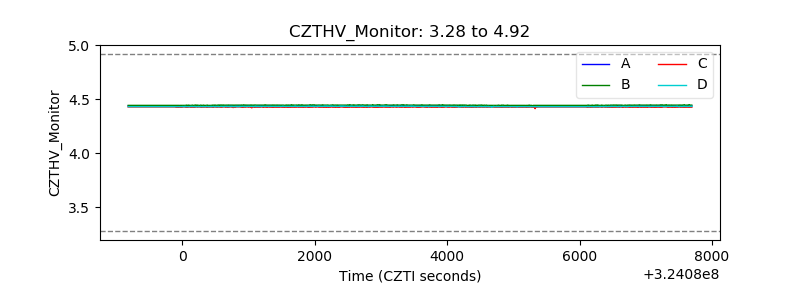 |
| D_VDD | 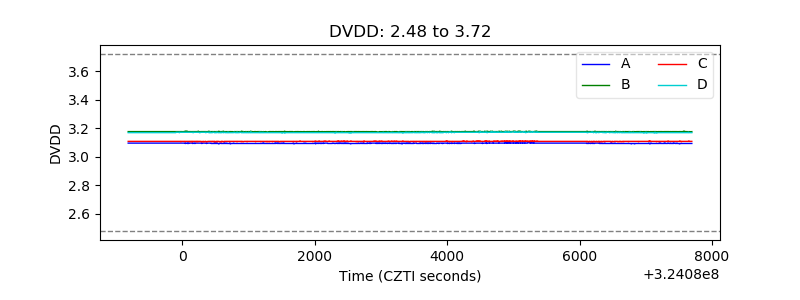 |
| Temperature 1 | 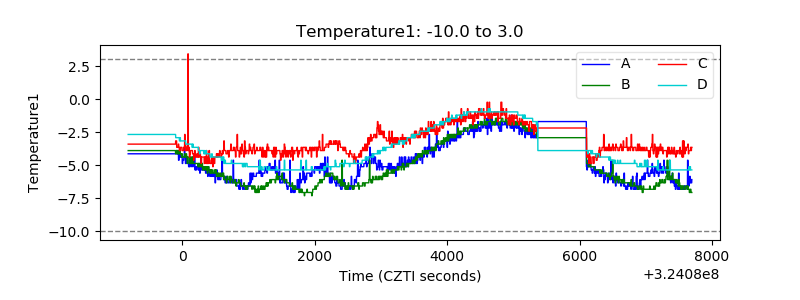 |
| Veto HV Monitor | 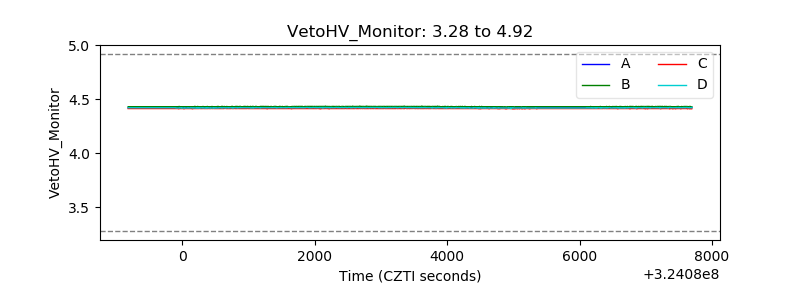 |
| Veto LLD | 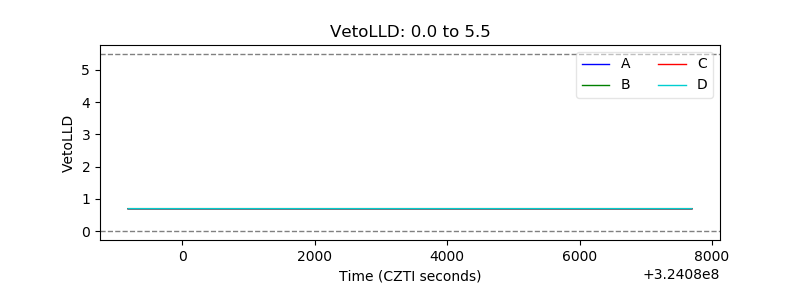 |
| Alpha Counter | 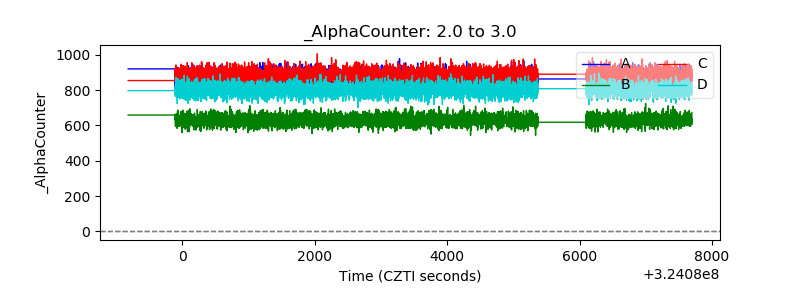 |
| _CPM_Rate | 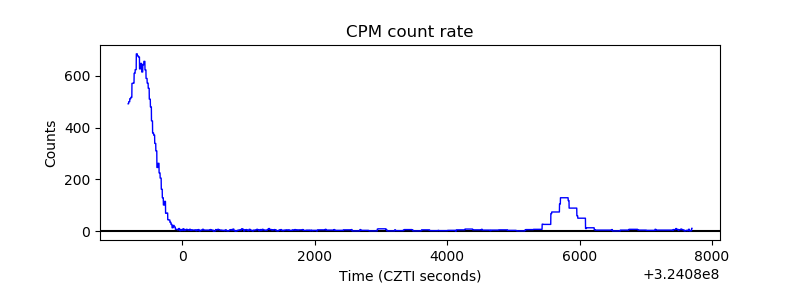 |
| CZT Counter | 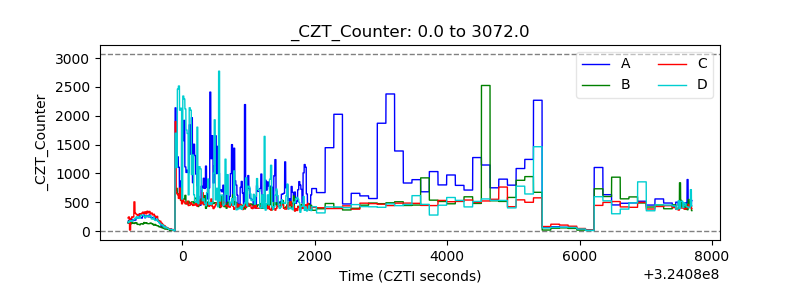 |
| +2.5 Volts monitor | 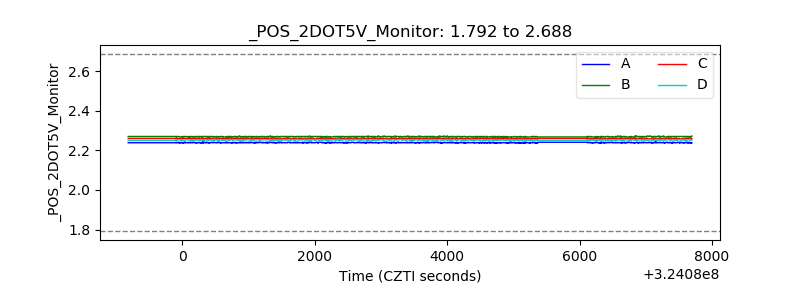 |
| +5 Volts monitor |  |
| _ROLL_ROT | 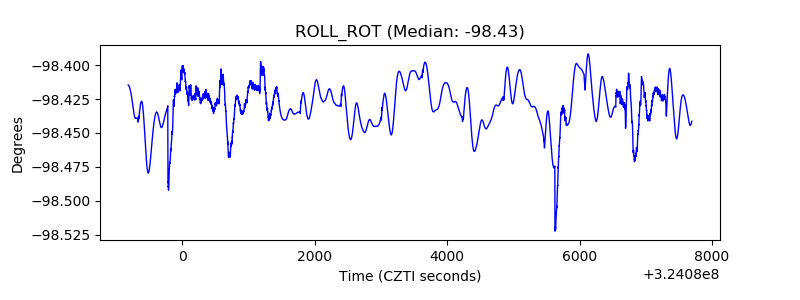 |
| _Roll_DEC | 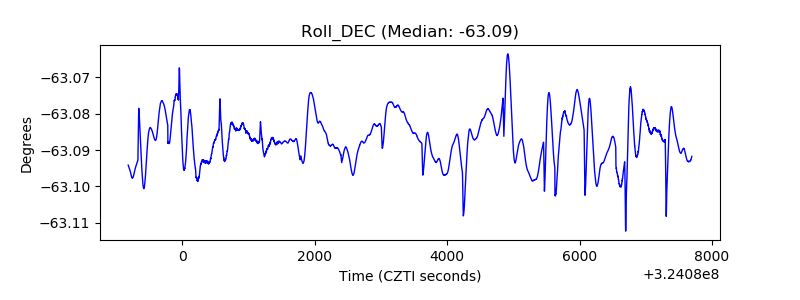 |
| _Roll_RA | 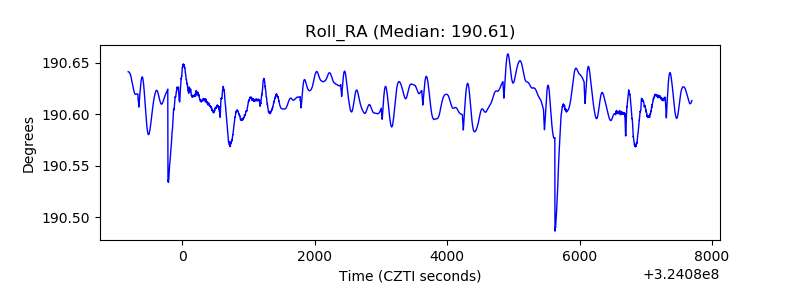 |
| Veto Counter | 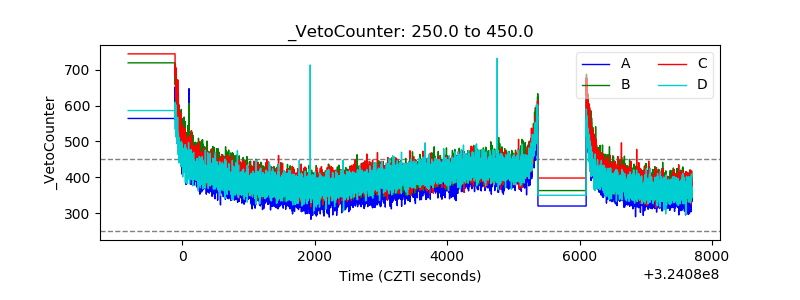 |