| Param | Original file | Final file |
|---|---|---|
| Filename | modeM0/AS1T03_183T01_9000003606_24495cztM0_level2.evt | modeM0/AS1T03_183T01_9000003606_24495cztM0_level2_quad_clean.evt |
| Size (bytes) | 622,929,600 | 135,590,400 |
| Size | 594.1 MB | 129.3 MB |
| Events in quadrant A | 5,558,758 | 882,873 |
| Events in quadrant B | 4,375,814 | 931,656 |
| Events in quadrant C | 3,710,190 | 888,415 |
| Events in quadrant D | 4,688,392 | 857,471 |
| Mode M0 | |||
|---|---|---|---|
| Quadrant | BADHDUFLAG | Total packets | Discarded packets |
| A | 0 | 21791 | 3 |
| B | 0 | 18158 | 3 |
| C | 0 | 16195 | 3 |
| D | 0 | 19257 | 3 |
| Mode SS | |||
|---|---|---|---|
| Quadrant | BADHDUFLAG | Total packets | Discarded packets |
| A | 0 | 160 | 0 |
| B | 0 | 160 | 0 |
| C | 0 | 160 | 0 |
| D | 0 | 160 | 0 |
| Mode M9 | |||
|---|---|---|---|
| Quadrant | BADHDUFLAG | Total packets | Discarded packets |
| A | 0 | 11 | 0 |
| B | 0 | 11 | 0 |
| C | 0 | 11 | 0 |
| D | 0 | 11 | 0 |
| Quadrant | Total seconds | Saturated seconds | Saturation percentage |
|---|---|---|---|
| A | 7854 | 699 | 8.899924% |
| B | 7854 | 239 | 3.043035% |
| C | 7855 | 126 | 1.604074% |
| D | 7855 | 227 | 2.889879% |
Noise dominated data is calculated using 1-second bins in cleaned event files. If a bin has >2000 counts, and if more than 50% of those come from <1% of pixels, then it is considered to be noise-dominated and hence unusable.
| Quadrant | # 1 sec bins | Bins with >0 counts | Bins with >2000 counts | High rate bins dominated by noise | Noise dominated (total time) | Noise dominated (detector-on time) | Marked lightcurve |
|---|---|---|---|---|---|---|---|
| A | 8929 | 7857 | 308 | 308 | 3.45% | 3.92% | 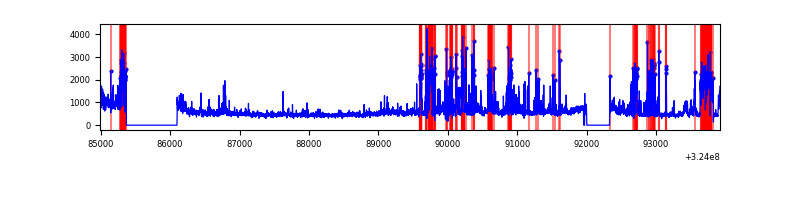 |
| B | 8929 | 7857 | 58 | 58 | 0.65% | 0.74% | 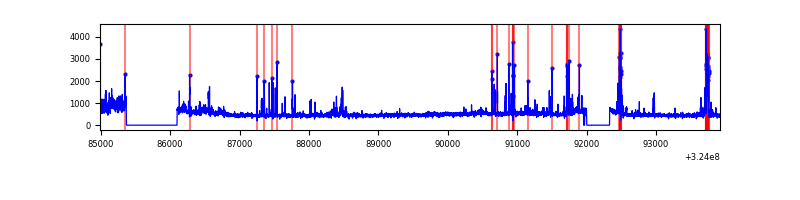 |
| C | 8930 | 7858 | 2 | 2 | 0.02% | 0.03% | 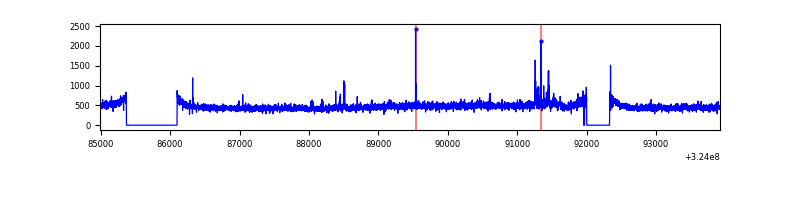 |
| D | 8930 | 7858 | 129 | 129 | 1.44% | 1.64% | 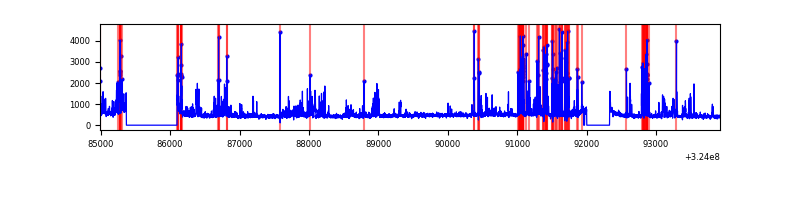 |
Top three noisy pixels from each quadrant. If the there are fewer than three noisy pixels in the level2.evt file, extra rows are filled as -1
| Pixel properties | Quadrant properties | ||||||
|---|---|---|---|---|---|---|---|
| Quadrant | DetID | PixID | Counts | Sigma | Mean | Median | Sigma |
| A | 14 | 111 | 2088232 | 11629.95 | 897 | 878 | 179.5 |
| A | 13 | 254 | 11620 | 59.85 | 897 | 878 | 179.5 |
| A | 4 | 2 | 8232 | 40.97 | 897 | 878 | 179.5 |
| B | 3 | 64 | 613680 | 3498.5 | 928 | 904 | 175.2 |
| B | 5 | 172 | 79702 | 449.88 | 928 | 904 | 175.2 |
| B | 6 | 36 | 37454 | 208.67 | 928 | 904 | 175.2 |
| C | 14 | 238 | 144603 | 691.08 | 892 | 895 | 207.9 |
| C | 2 | 16 | 79995 | 380.38 | 892 | 895 | 207.9 |
| C | 3 | 233 | 8422 | 36.2 | 892 | 895 | 207.9 |
| D | 12 | 218 | 675904 | 3119.88 | 889 | 860 | 216.4 |
| D | 1 | 52 | 388739 | 1792.68 | 889 | 860 | 216.4 |
| D | 9 | 1 | 141773 | 651.26 | 889 | 860 | 216.4 |
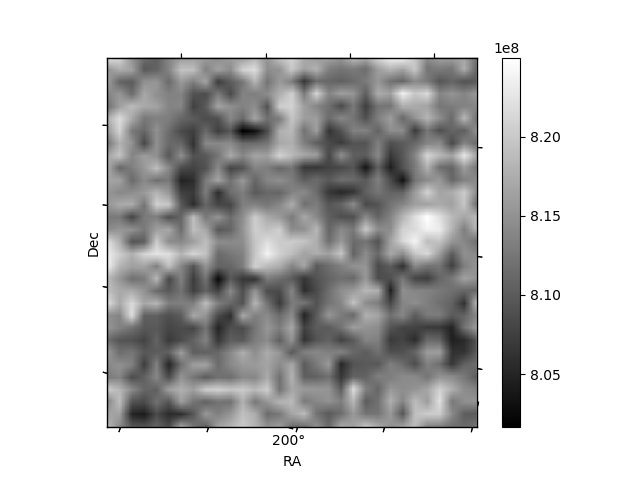
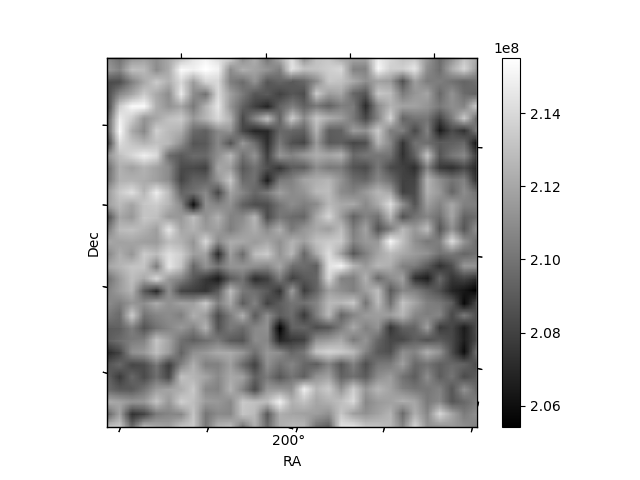
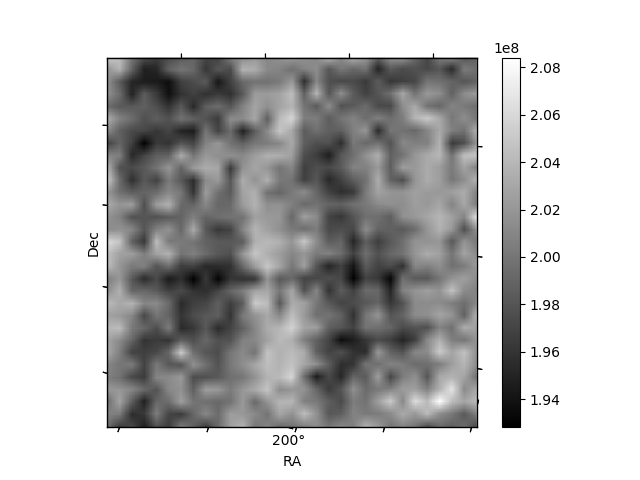
Histogram calculated using DETX and DETY for each event in the final _common_clean file
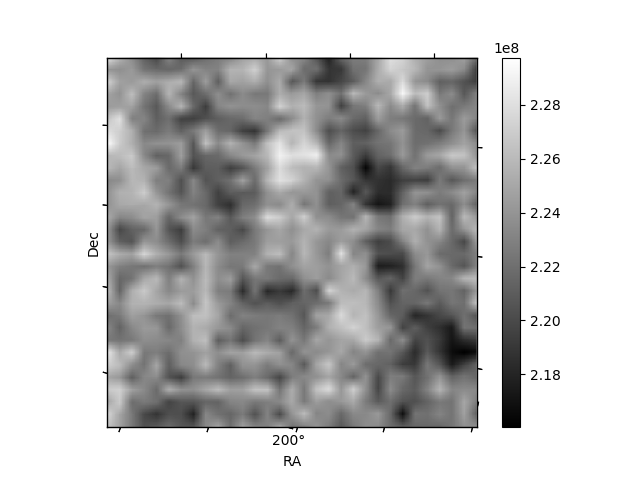
| Quadrant A | 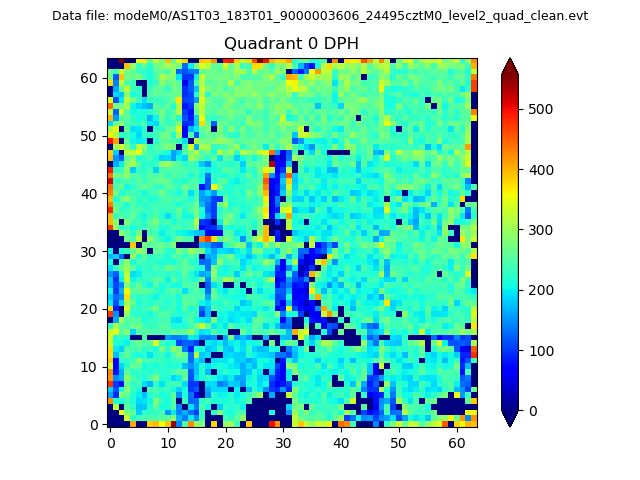 |
 |
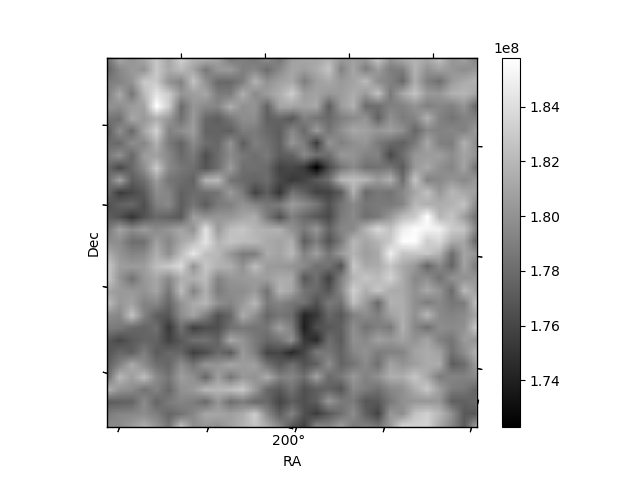
Quadrant B |
|---|---|---|---|
| Quadrant D | 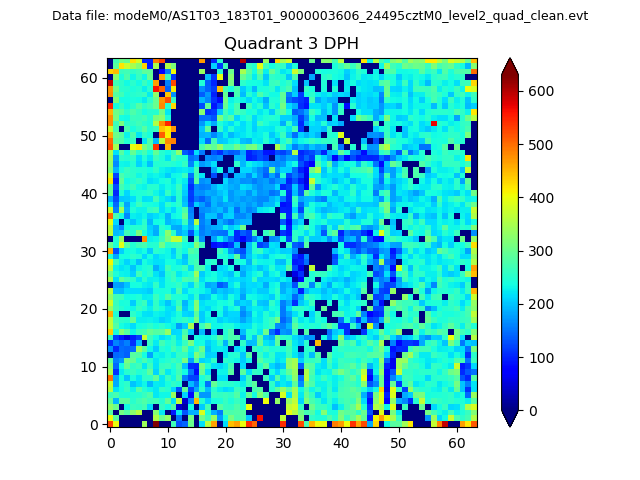 |
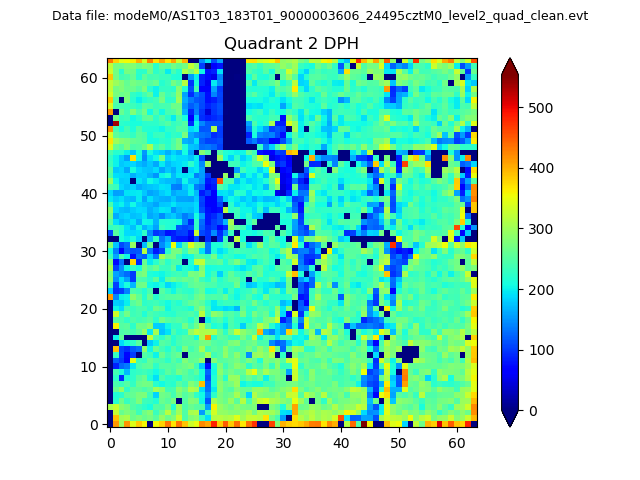 |
Quadrant C |
| Plot type | Count rate plots | Images |
|---|---|---|
| Comparison with Poisson distribution Blue bars denote a histogram of data divided into 1 sec bins. Red curve is a Poisson curve with rate = median count rate of data. |
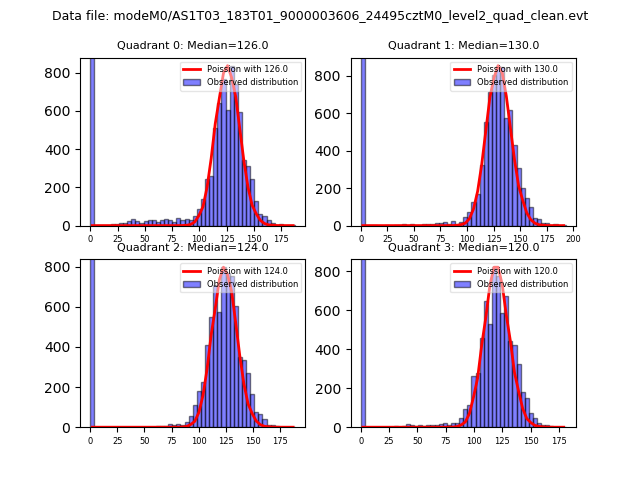 |
 |
| Quadrant-wise count rates Data is divided into 100 sec bins |
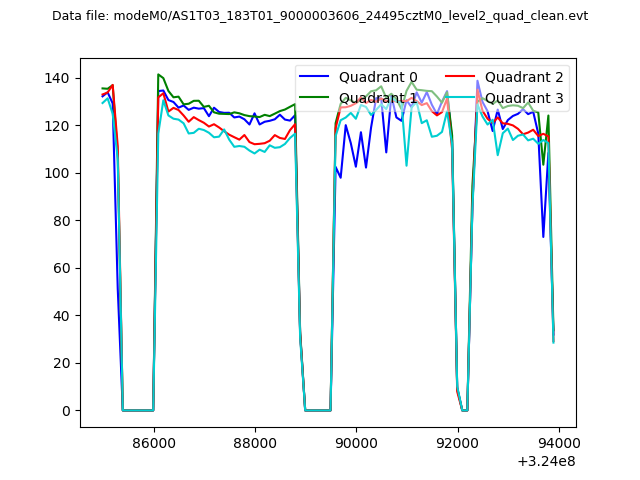 |
|
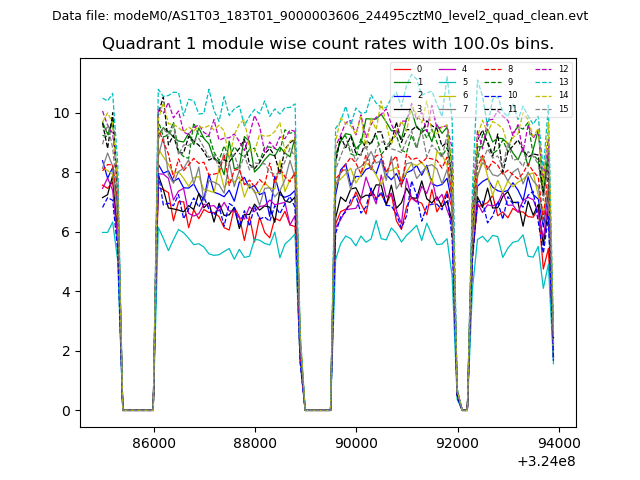
| Module-wise count rates for Quadrant A Data is divided into 100 sec bins |
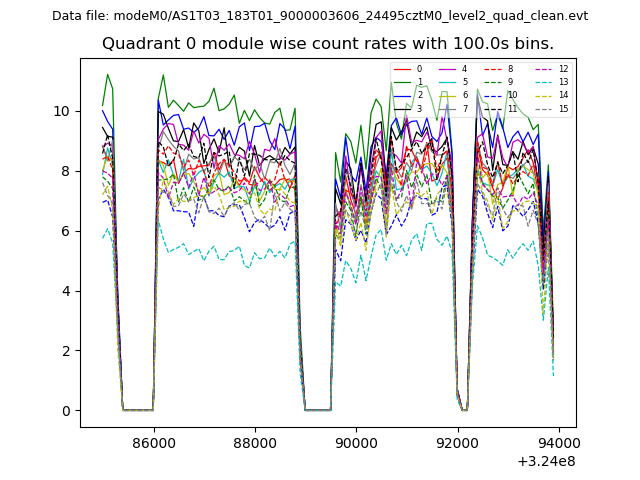 |
 |
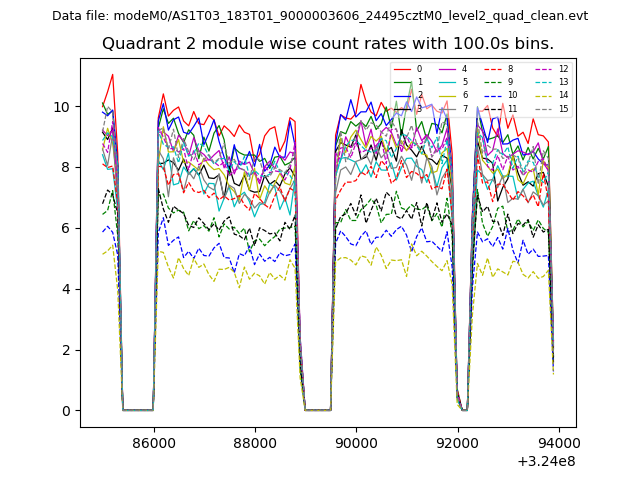
| Module-wise count rates for Quadrant B Data is divided into 100 sec bins |
 |
 |
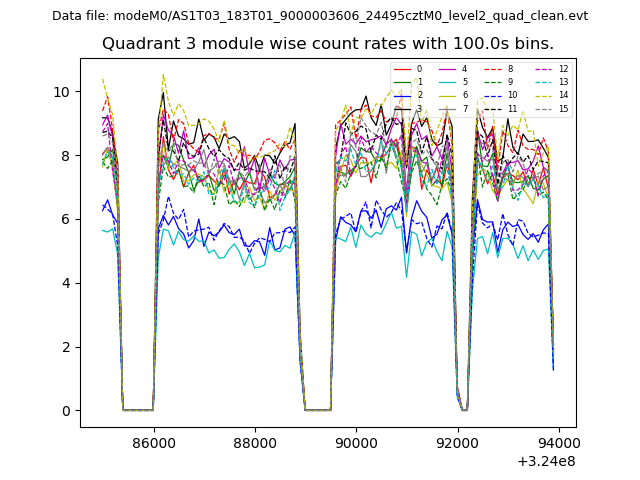
| Module-wise count rates for Quadrant C Data is divided into 100 sec bins |
 |
 |
| Module-wise count rates for Quadrant D Data is divided into 100 sec bins |
 |
 |
| Parameter | Plot |
|---|---|
| CZT HV Monitor | 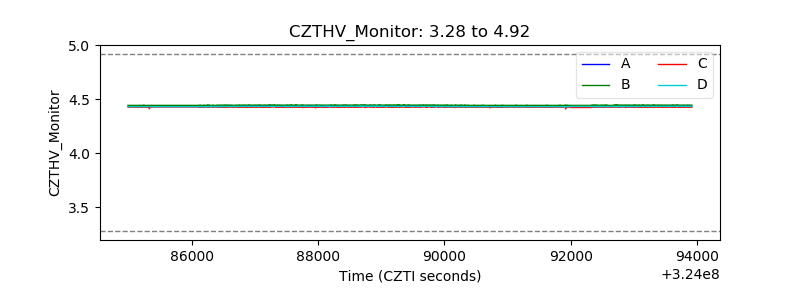 |
| D_VDD | 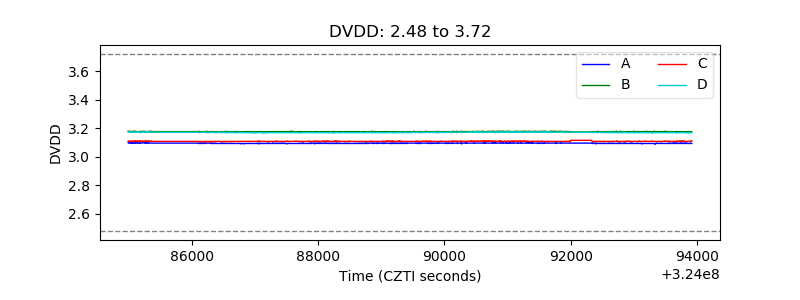 |
| Temperature 1 |  |
| Veto HV Monitor | 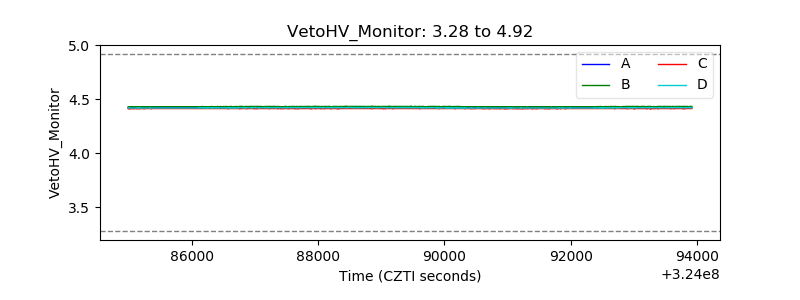 |
| Veto LLD |  |
| Alpha Counter | 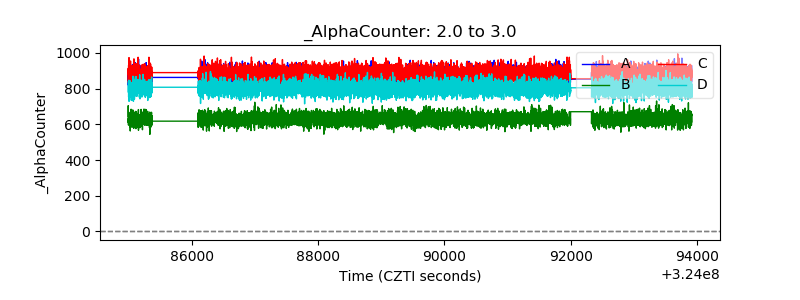 |
| _CPM_Rate | 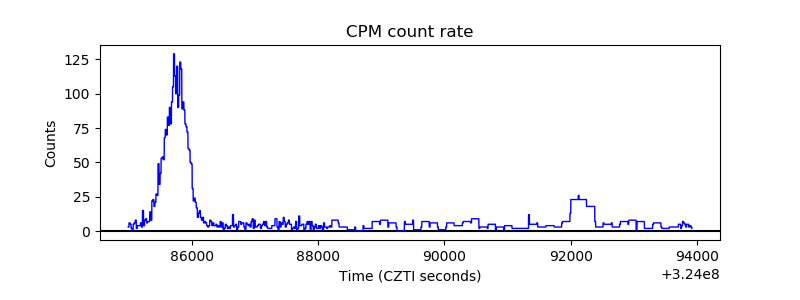 |
| CZT Counter | 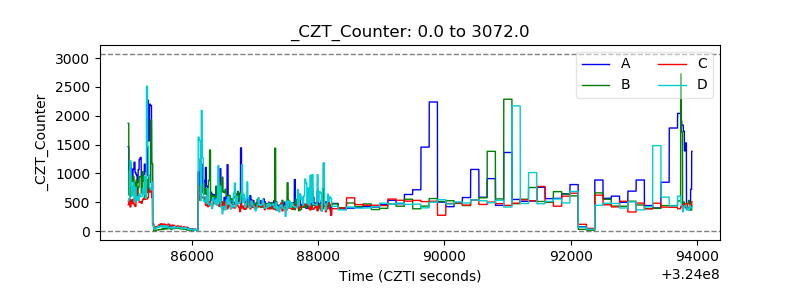 |
| +2.5 Volts monitor |  |
| +5 Volts monitor | 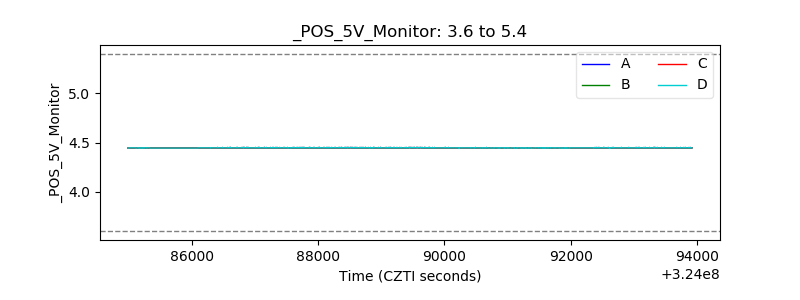 |
| _ROLL_ROT | 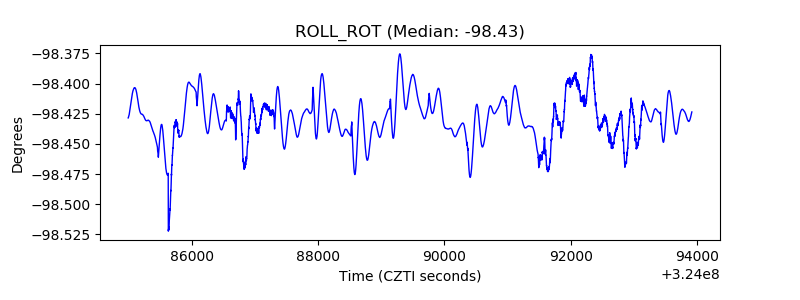 |
| _Roll_DEC | 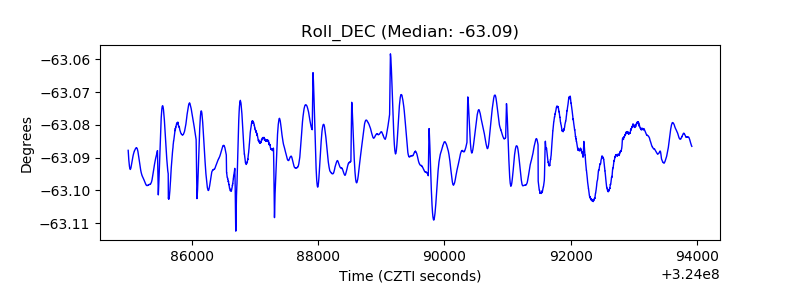 |
| _Roll_RA |  |
| Veto Counter | 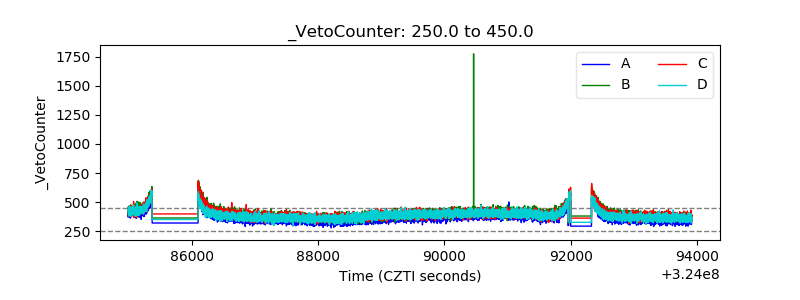 |