| Param | Original file | Final file |
|---|---|---|
| Filename | modeM0/AS1T03_183T01_9000003606_24496cztM0_level2.evt | modeM0/AS1T03_183T01_9000003606_24496cztM0_level2_quad_clean.evt |
| Size (bytes) | 564,402,240 | 127,840,320 |
| Size | 538.3 MB | 121.9 MB |
| Events in quadrant A | 5,074,180 | 832,924 |
| Events in quadrant B | 4,157,838 | 871,770 |
| Events in quadrant C | 3,477,365 | 832,096 |
| Events in quadrant D | 3,873,379 | 811,813 |
| Mode M0 | |||
|---|---|---|---|
| Quadrant | BADHDUFLAG | Total packets | Discarded packets |
| A | 0 | 19988 | 1 |
| B | 0 | 17271 | 1 |
| C | 0 | 15337 | 1 |
| D | 0 | 16794 | 1 |
| Mode SS | |||
|---|---|---|---|
| Quadrant | BADHDUFLAG | Total packets | Discarded packets |
| A | 0 | 154 | 0 |
| B | 0 | 154 | 0 |
| C | 0 | 154 | 0 |
| D | 0 | 154 | 0 |
| Mode M9 | |||
|---|---|---|---|
| Quadrant | BADHDUFLAG | Total packets | Discarded packets |
| A | 0 | 2 | 0 |
| B | 0 | 2 | 0 |
| C | 0 | 2 | 0 |
| D | 0 | 2 | 0 |
| Quadrant | Total seconds | Saturated seconds | Saturation percentage |
|---|---|---|---|
| A | 7515 | 658 | 8.755822% |
| B | 7515 | 331 | 4.404524% |
| C | 7515 | 161 | 2.142382% |
| D | 7516 | 132 | 1.756253% |
Noise dominated data is calculated using 1-second bins in cleaned event files. If a bin has >2000 counts, and if more than 50% of those come from <1% of pixels, then it is considered to be noise-dominated and hence unusable.
| Quadrant | # 1 sec bins | Bins with >0 counts | Bins with >2000 counts | High rate bins dominated by noise | Noise dominated (total time) | Noise dominated (detector-on time) | Marked lightcurve |
|---|---|---|---|---|---|---|---|
| A | 7695 | 7517 | 245 | 245 | 3.18% | 3.26% | 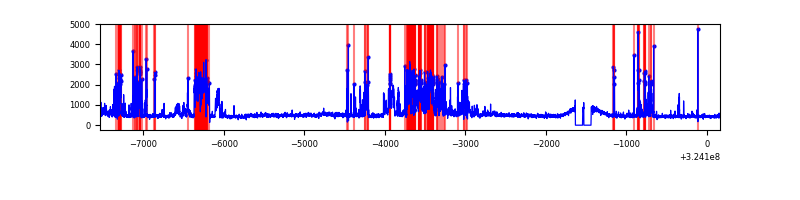 |
| B | 7695 | 7517 | 138 | 138 | 1.79% | 1.84% | 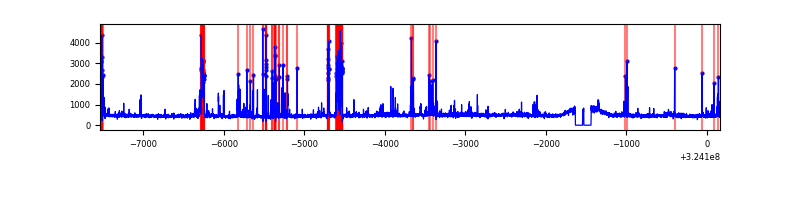 |
| C | 7695 | 7517 | 0 | 0 | 0.00% | 0.00% | 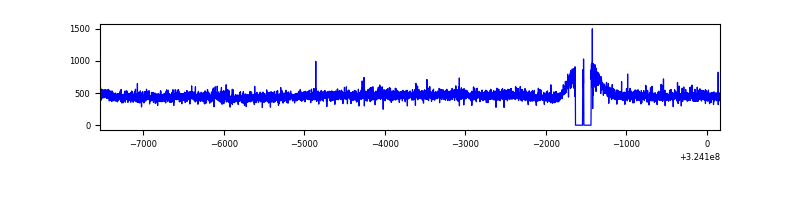 |
| D | 7696 | 7518 | 58 | 58 | 0.75% | 0.77% | 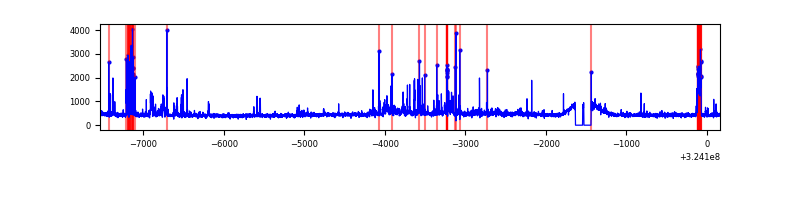 |
Top three noisy pixels from each quadrant. If the there are fewer than three noisy pixels in the level2.evt file, extra rows are filled as -1
| Pixel properties | Quadrant properties | ||||||
|---|---|---|---|---|---|---|---|
| Quadrant | DetID | PixID | Counts | Sigma | Mean | Median | Sigma |
| A | 14 | 111 | 1638394 | 9388.06 | 862 | 844 | 174.4 |
| A | 4 | 2 | 112801 | 641.85 | 862 | 844 | 174.4 |
| A | 13 | 254 | 10753 | 56.81 | 862 | 844 | 174.4 |
| B | 3 | 64 | 384909 | 2294.25 | 875 | 851 | 167.4 |
| B | 5 | 172 | 321155 | 1913.4 | 875 | 851 | 167.4 |
| B | 12 | 111 | 20795 | 119.14 | 875 | 851 | 167.4 |
| C | 14 | 238 | 136784 | 687.64 | 850 | 854 | 197.7 |
| C | 2 | 16 | 22963 | 111.84 | 850 | 854 | 197.7 |
| C | 13 | 61 | 6050 | 26.29 | 850 | 854 | 197.7 |
| D | 12 | 218 | 353014 | 1696.04 | 856 | 829 | 207.7 |
| D | 1 | 52 | 135718 | 649.59 | 856 | 829 | 207.7 |
| D | 8 | 195 | 96947 | 462.88 | 856 | 829 | 207.7 |
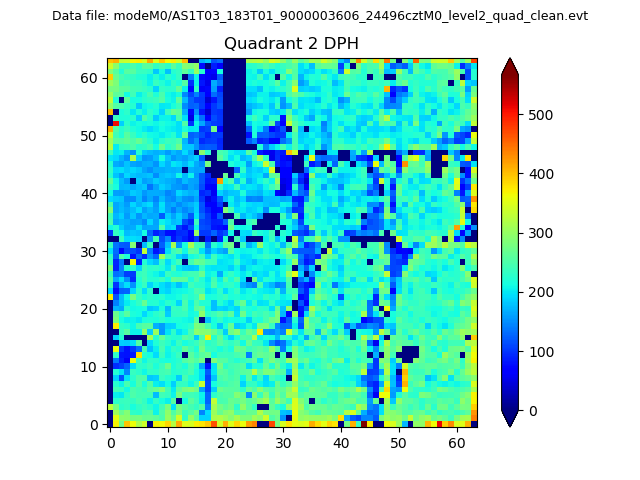
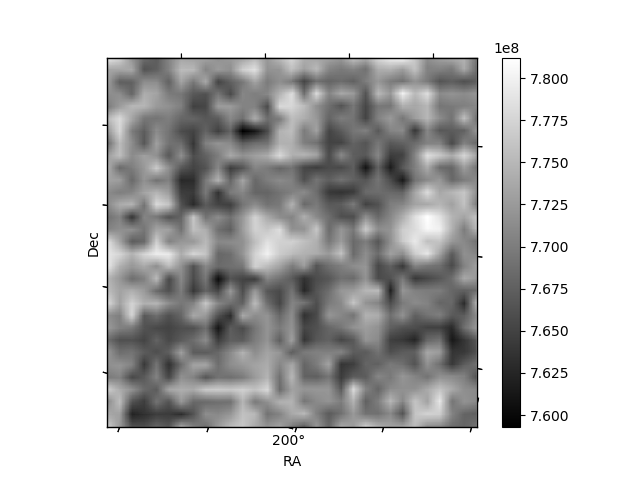
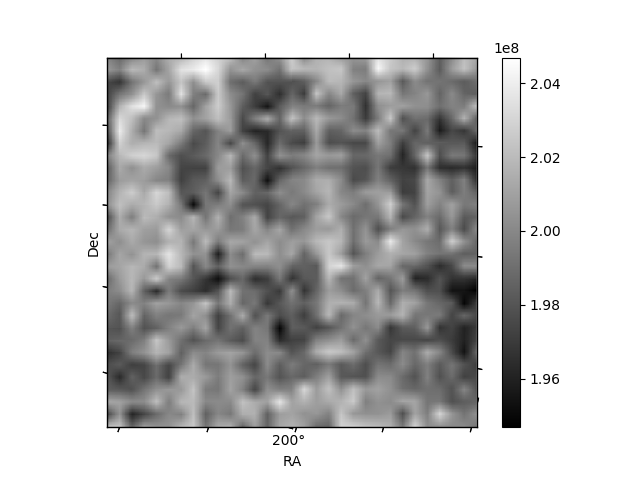
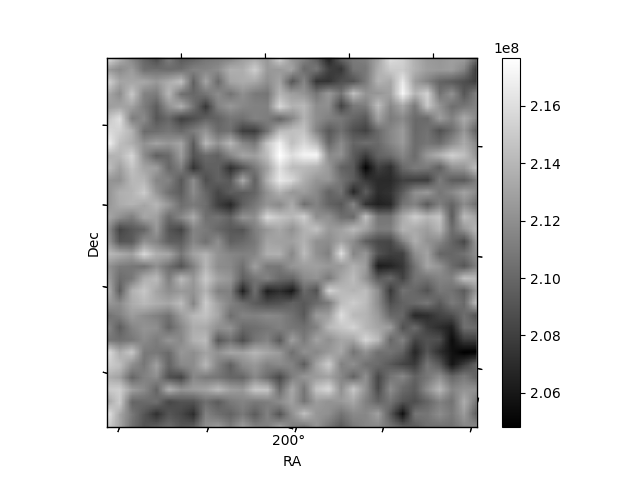
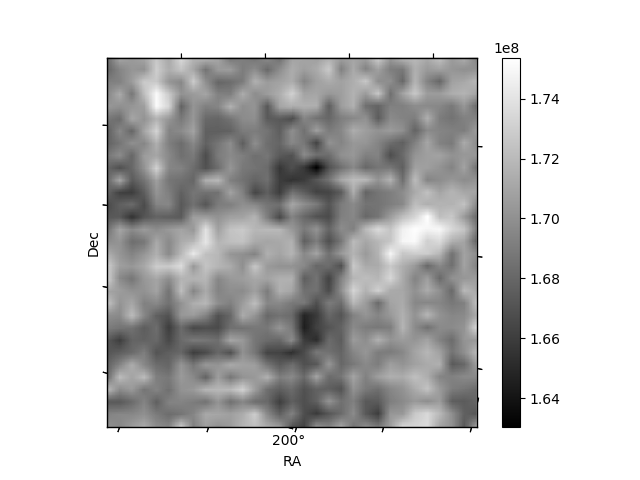
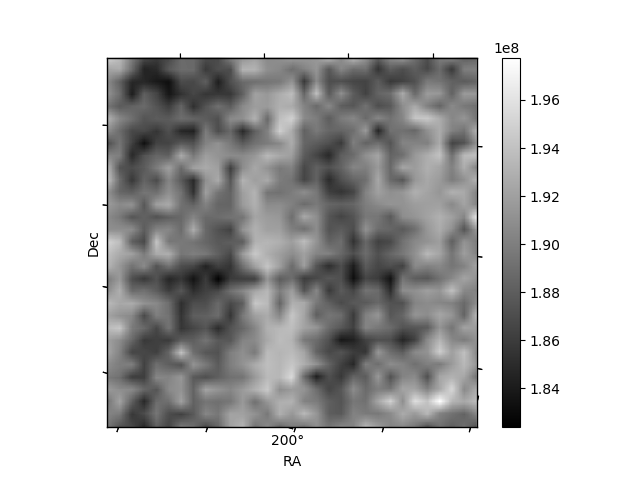
Histogram calculated using DETX and DETY for each event in the final _common_clean file
| Quadrant A | 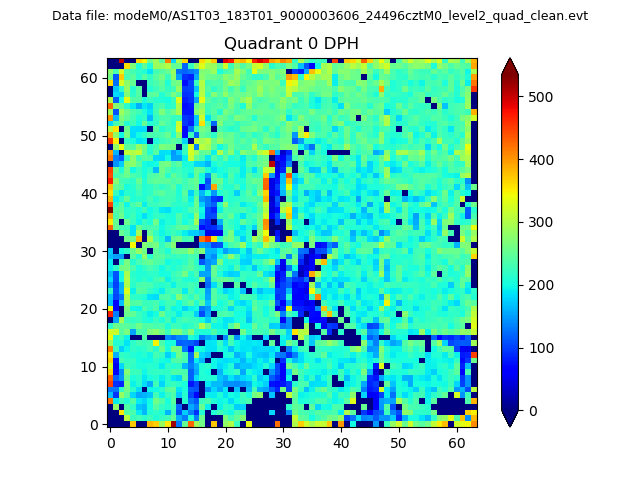 |
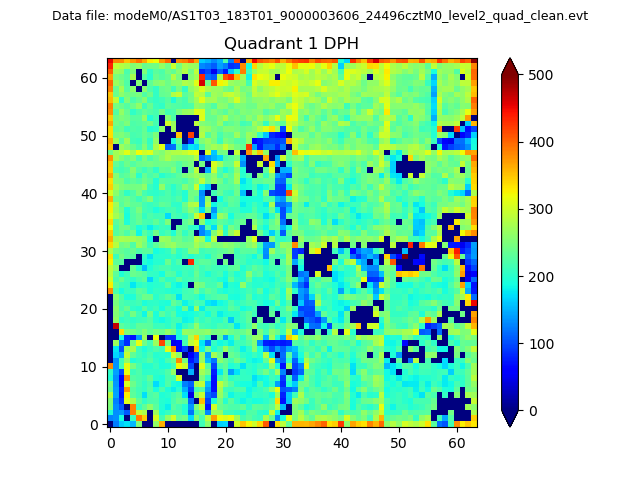 |
Quadrant B |
|---|---|---|---|
| Quadrant D | 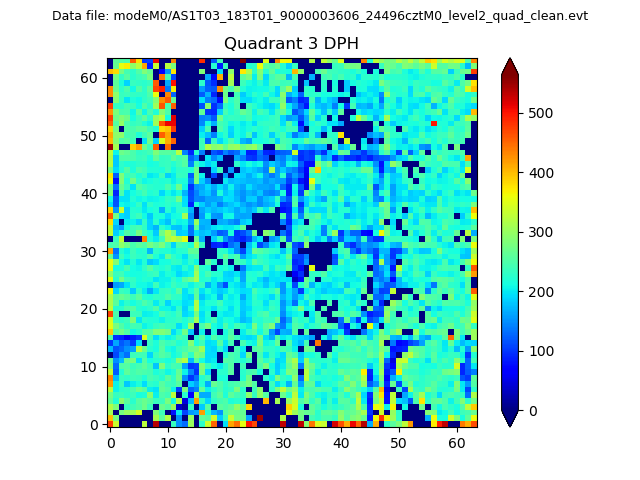 |
 |
Quadrant C |
| Plot type | Count rate plots | Images |
|---|---|---|
| Comparison with Poisson distribution Blue bars denote a histogram of data divided into 1 sec bins. Red curve is a Poisson curve with rate = median count rate of data. |
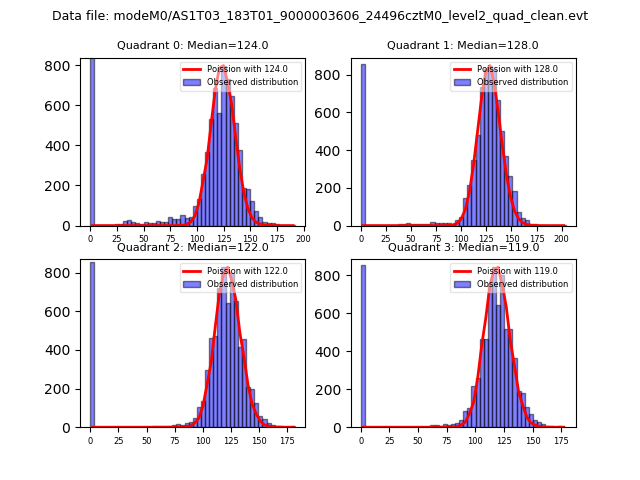 |
 |
| Quadrant-wise count rates Data is divided into 100 sec bins |
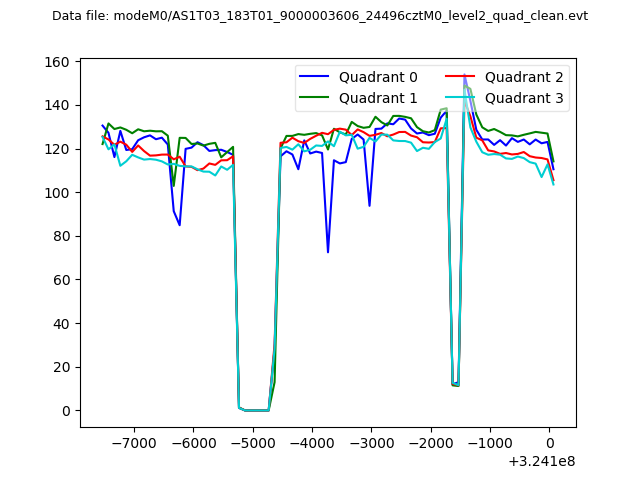 |
|
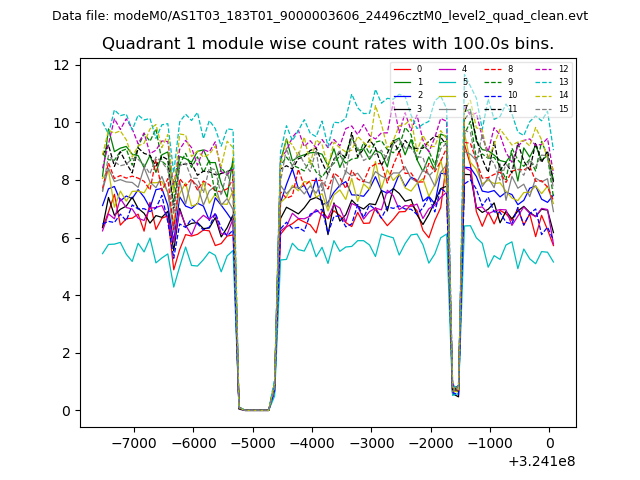
| Module-wise count rates for Quadrant A Data is divided into 100 sec bins |
 |
 |
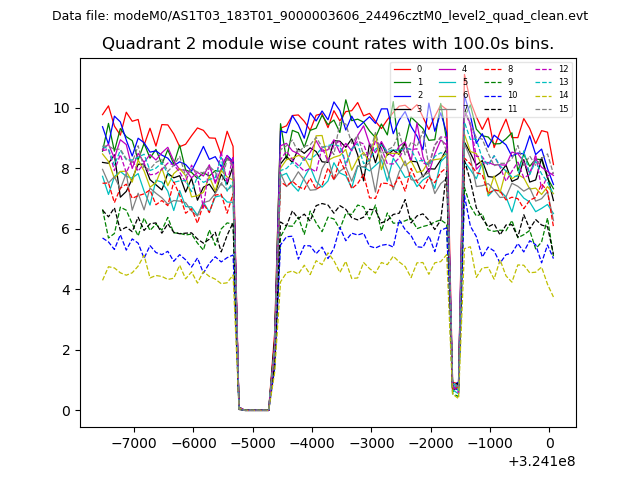
| Module-wise count rates for Quadrant B Data is divided into 100 sec bins |
 |
 |
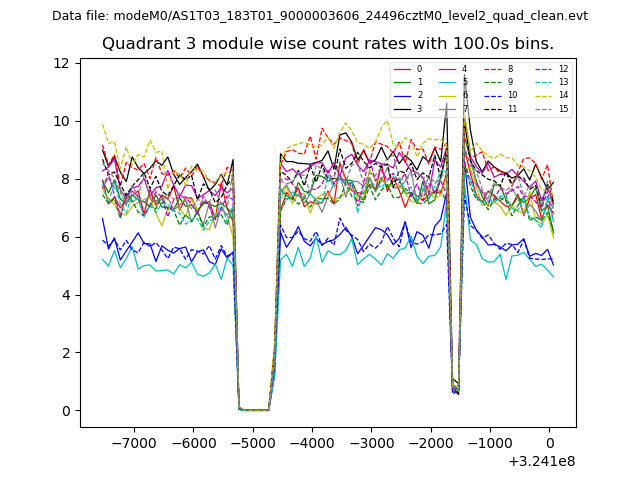
| Module-wise count rates for Quadrant C Data is divided into 100 sec bins |
 |
 |
| Module-wise count rates for Quadrant D Data is divided into 100 sec bins |
 |
 |
| Parameter | Plot |
|---|---|
| CZT HV Monitor | 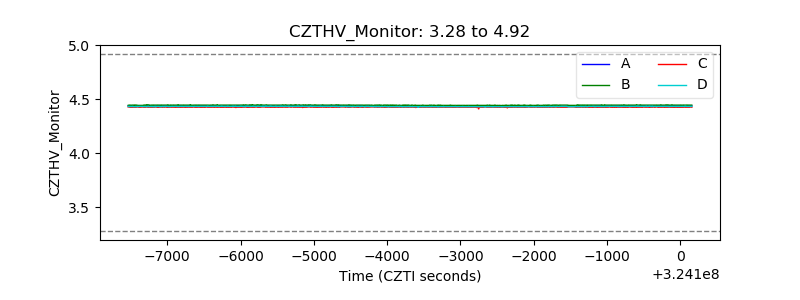 |
| D_VDD | 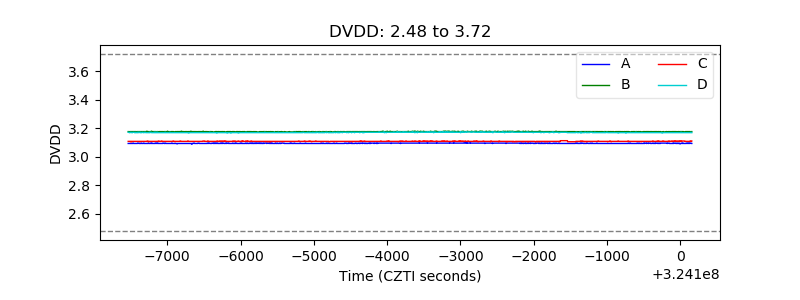 |
| Temperature 1 | 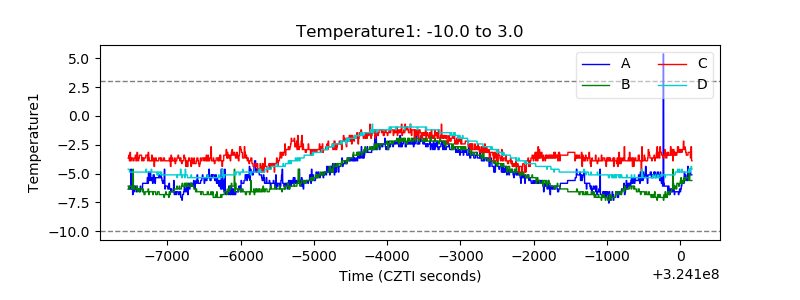 |
| Veto HV Monitor | 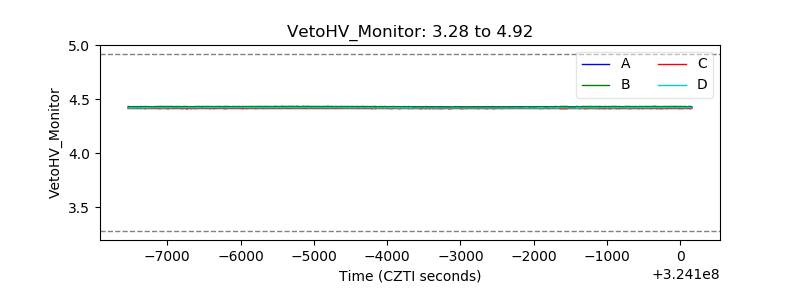 |
| Veto LLD | 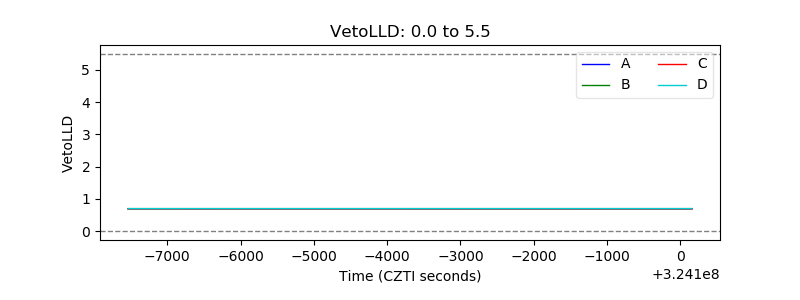 |
| Alpha Counter | 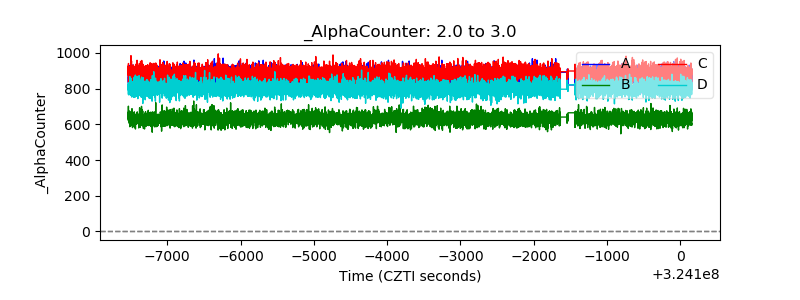 |
| _CPM_Rate | 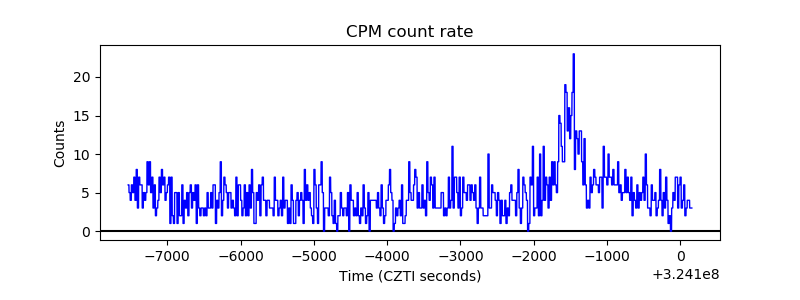 |
| CZT Counter | 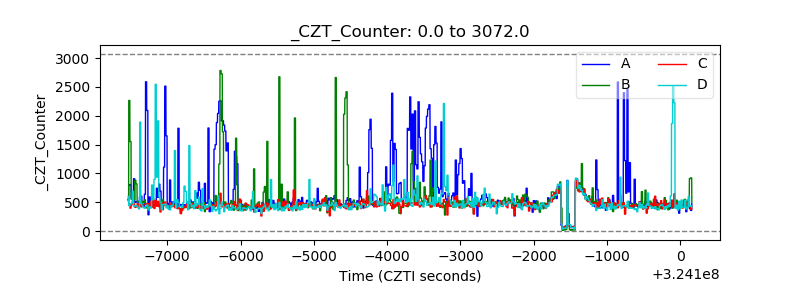 |
| +2.5 Volts monitor |  |
| +5 Volts monitor |  |
| _ROLL_ROT |  |
| _Roll_DEC | 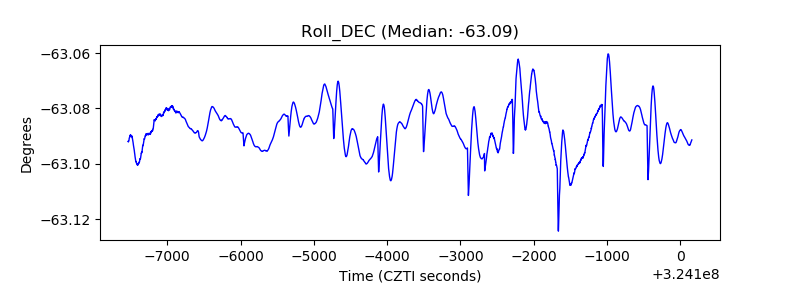 |
| _Roll_RA | 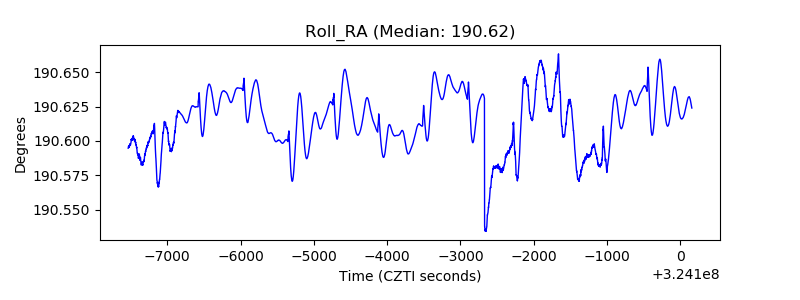 |
| Veto Counter | 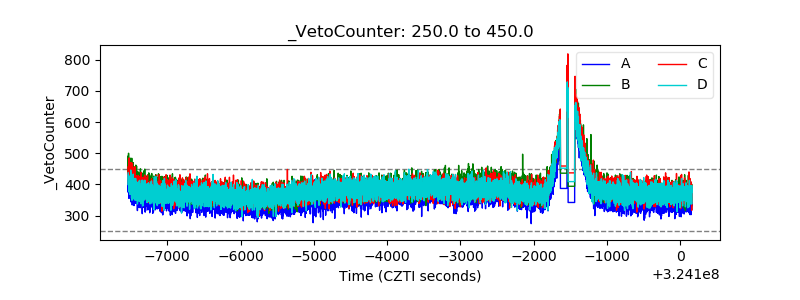 |