| Param | Original file | Final file |
|---|---|---|
| Filename | modeM0/AS1T03_183T01_9000003606_24497cztM0_level2.evt | modeM0/AS1T03_183T01_9000003606_24497cztM0_level2_quad_clean.evt |
| Size (bytes) | 653,495,040 | 131,880,960 |
| Size | 623.2 MB | 125.8 MB |
| Events in quadrant A | 4,490,951 | 891,710 |
| Events in quadrant B | 5,815,250 | 873,104 |
| Events in quadrant C | 3,820,350 | 862,011 |
| Events in quadrant D | 5,129,013 | 817,497 |
| Mode M0 | |||
|---|---|---|---|
| Quadrant | BADHDUFLAG | Total packets | Discarded packets |
| A | 0 | 18606 | 2 |
| B | 0 | 22482 | 2 |
| C | 0 | 16512 | 2 |
| D | 0 | 20680 | 2 |
| Mode SS | |||
|---|---|---|---|
| Quadrant | BADHDUFLAG | Total packets | Discarded packets |
| A | 0 | 162 | 0 |
| B | 0 | 162 | 0 |
| C | 0 | 162 | 0 |
| D | 0 | 162 | 0 |
| Mode M9 | |||
|---|---|---|---|
| Quadrant | BADHDUFLAG | Total packets | Discarded packets |
| A | 0 | 5 | 0 |
| B | 0 | 5 | 0 |
| C | 0 | 5 | 0 |
| D | 0 | 5 | 0 |
| Quadrant | Total seconds | Saturated seconds | Saturation percentage |
|---|---|---|---|
| A | 7904 | 311 | 3.934717% |
| B | 7905 | 947 | 11.979760% |
| C | 7905 | 313 | 3.959519% |
| D | 7905 | 661 | 8.361796% |
Noise dominated data is calculated using 1-second bins in cleaned event files. If a bin has >2000 counts, and if more than 50% of those come from <1% of pixels, then it is considered to be noise-dominated and hence unusable.
| Quadrant | # 1 sec bins | Bins with >0 counts | Bins with >2000 counts | High rate bins dominated by noise | Noise dominated (total time) | Noise dominated (detector-on time) | Marked lightcurve |
|---|---|---|---|---|---|---|---|
| A | 8389 | 7907 | 23 | 23 | 0.27% | 0.29% | 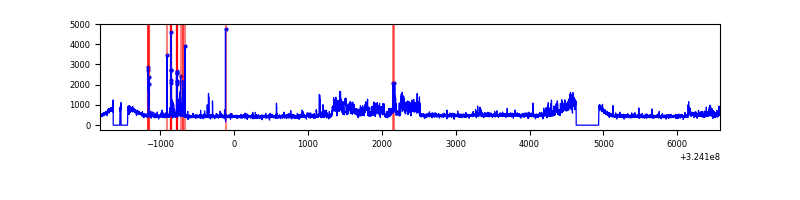 |
| B | 8390 | 7907 | 400 | 400 | 4.77% | 5.06% | 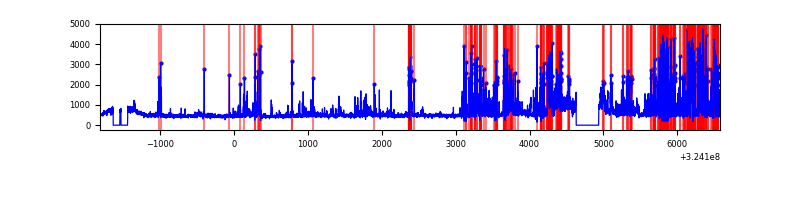 |
| C | 8390 | 7907 | 1 | 1 | 0.01% | 0.01% | 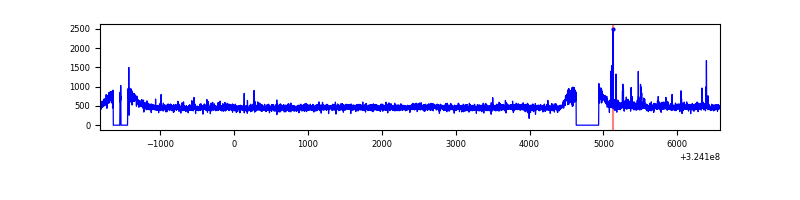 |
| D | 8390 | 7908 | 364 | 364 | 4.34% | 4.60% | 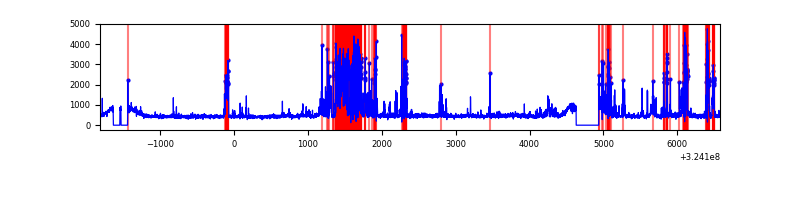 |
Top three noisy pixels from each quadrant. If the there are fewer than three noisy pixels in the level2.evt file, extra rows are filled as -1
| Pixel properties | Quadrant properties | ||||||
|---|---|---|---|---|---|---|---|
| Quadrant | DetID | PixID | Counts | Sigma | Mean | Median | Sigma |
| A | 14 | 111 | 702972 | 3669.43 | 946 | 924 | 191.3 |
| A | 4 | 2 | 139413 | 723.85 | 946 | 924 | 191.3 |
| A | 13 | 254 | 11901 | 57.37 | 946 | 924 | 191.3 |
| B | 3 | 64 | 2137638 | 12113.4 | 918 | 891 | 176.4 |
| B | 6 | 36 | 64392 | 359.99 | 918 | 891 | 176.4 |
| B | 12 | 111 | 22052 | 119.96 | 918 | 891 | 176.4 |
| C | 14 | 238 | 145652 | 675.22 | 921 | 925 | 214.3 |
| C | 2 | 16 | 75366 | 347.3 | 921 | 925 | 214.3 |
| C | 13 | 61 | 6498 | 26.0 | 921 | 925 | 214.3 |
| D | 12 | 218 | 1254193 | 5756.23 | 905 | 878 | 217.7 |
| D | 9 | 1 | 156102 | 712.91 | 905 | 878 | 217.7 |
| D | 1 | 52 | 131934 | 601.91 | 905 | 878 | 217.7 |
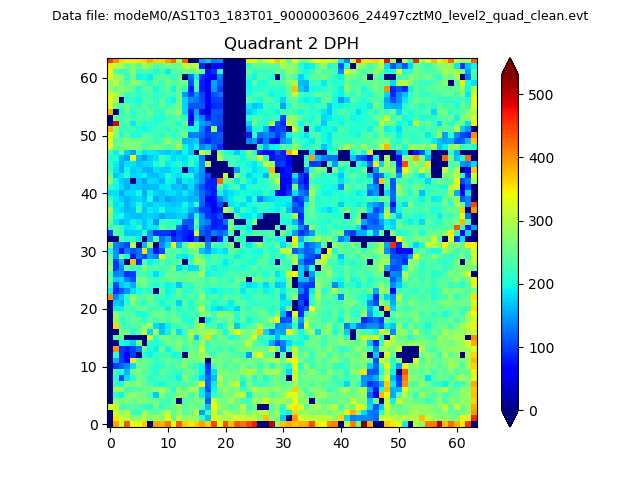
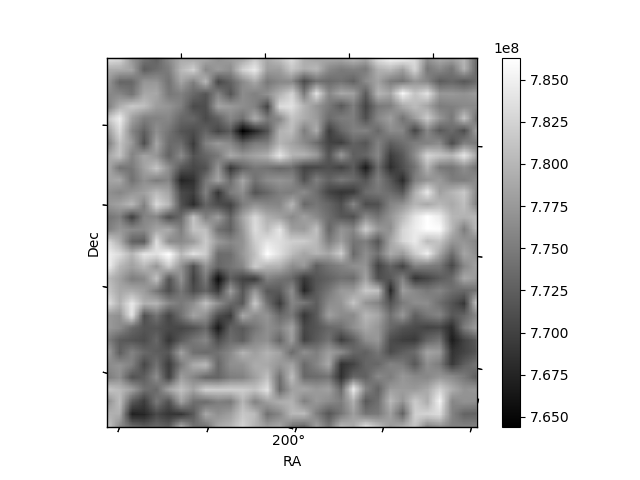
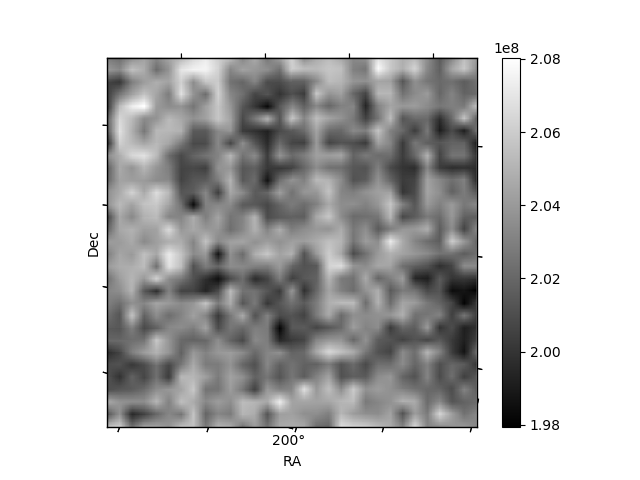
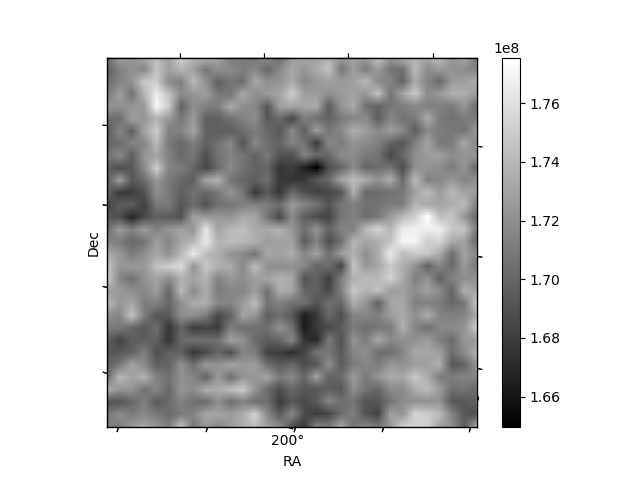
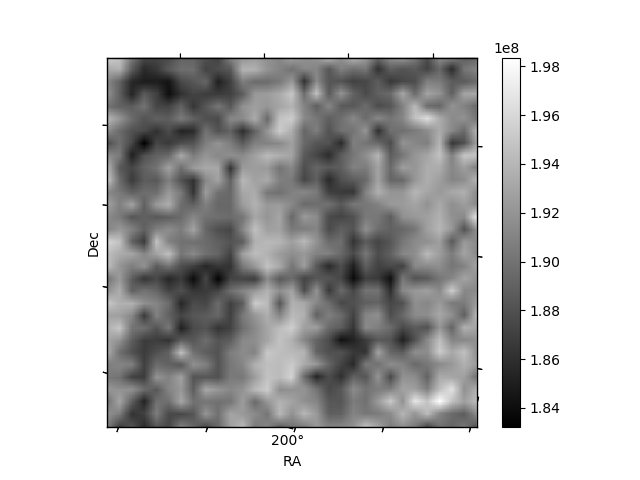
Histogram calculated using DETX and DETY for each event in the final _common_clean file
| Quadrant A | 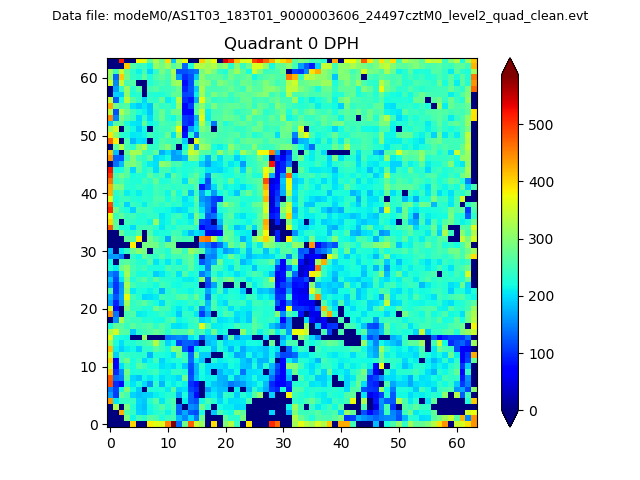 |
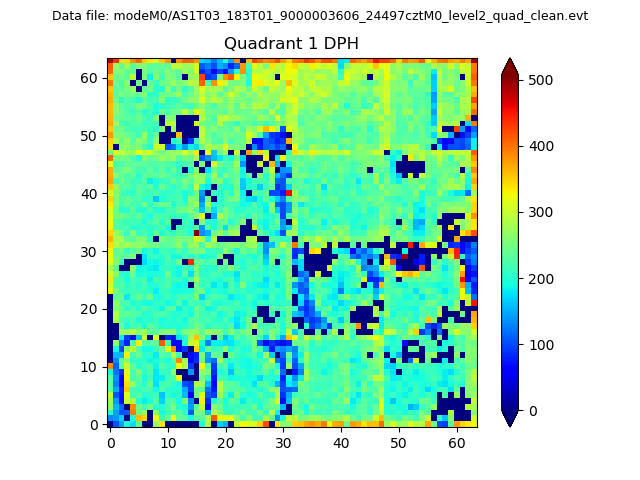 |
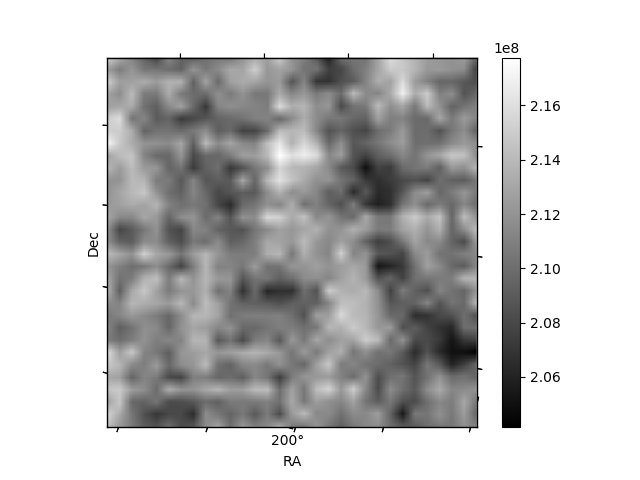
Quadrant B |
|---|---|---|---|
| Quadrant D | 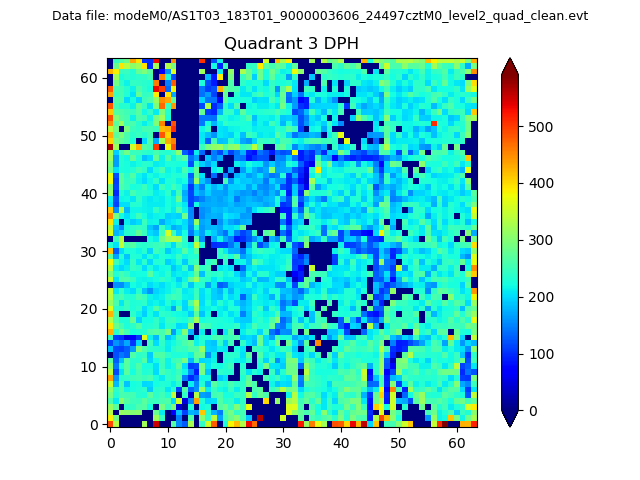 |
 |
Quadrant C |
| Plot type | Count rate plots | Images |
|---|---|---|
| Comparison with Poisson distribution Blue bars denote a histogram of data divided into 1 sec bins. Red curve is a Poisson curve with rate = median count rate of data. |
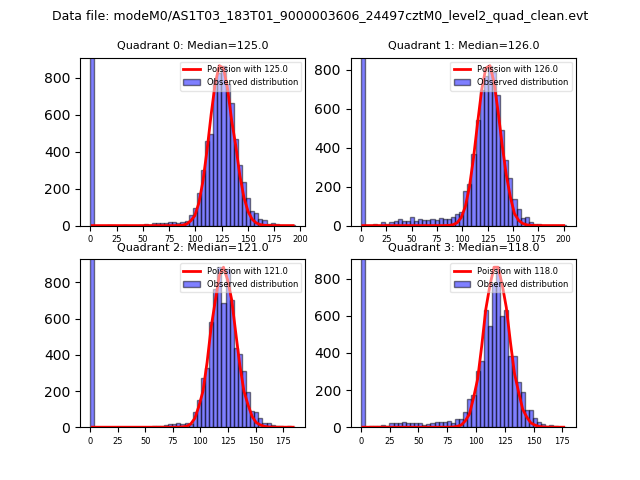 |
 |
| Quadrant-wise count rates Data is divided into 100 sec bins |
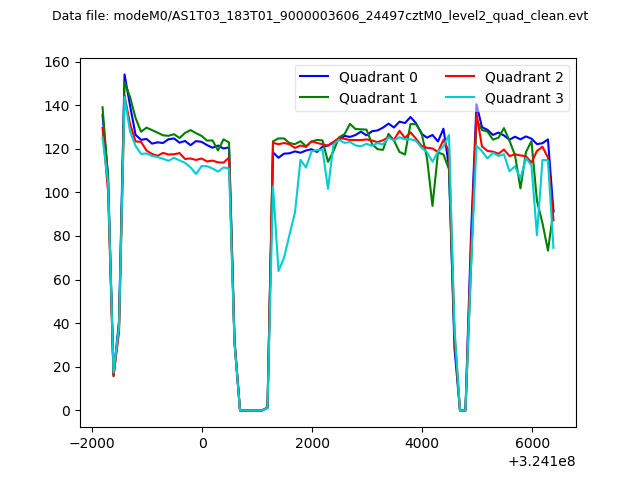 |
|
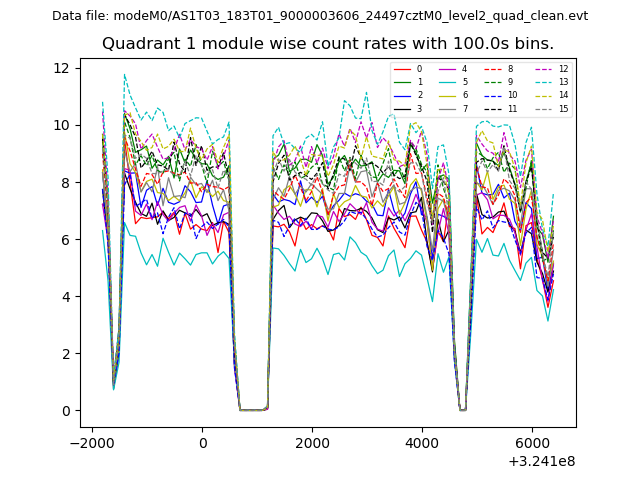
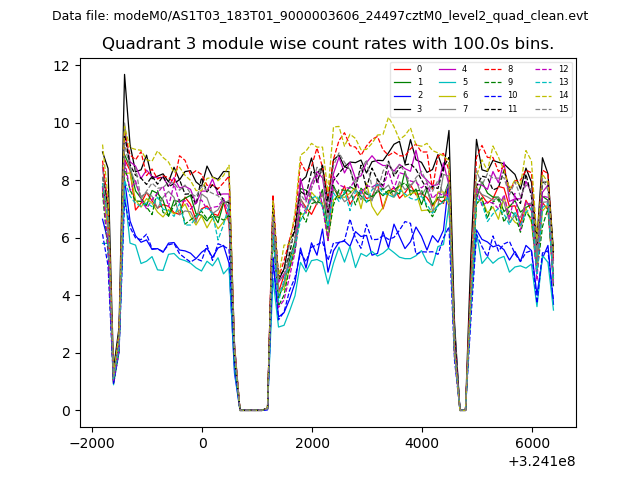
| Module-wise count rates for Quadrant A Data is divided into 100 sec bins |
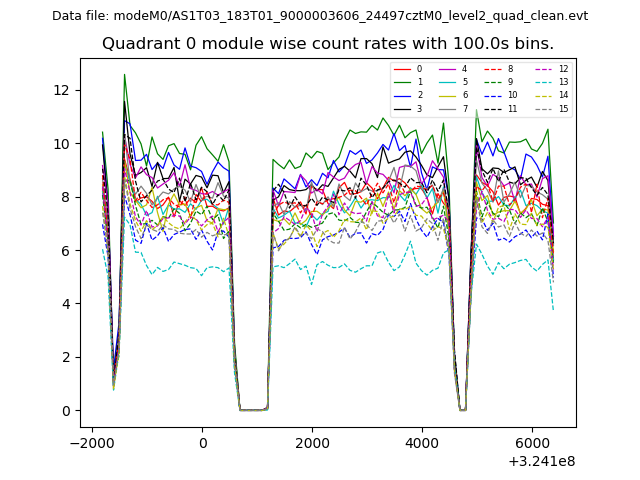 |
 |
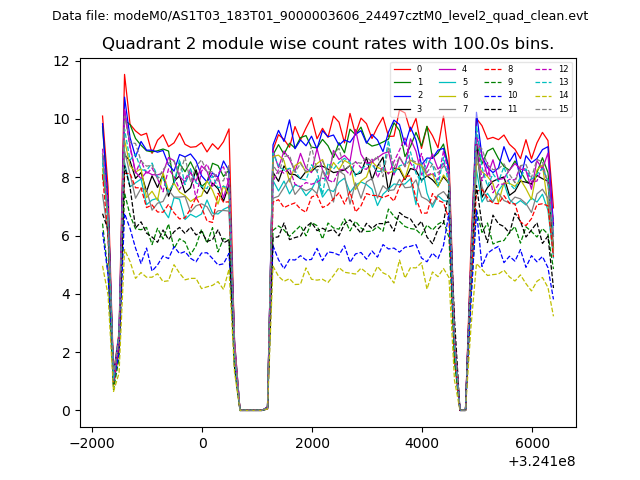
| Module-wise count rates for Quadrant B Data is divided into 100 sec bins |
 |
 |
| Module-wise count rates for Quadrant C Data is divided into 100 sec bins |
 |
 |
| Module-wise count rates for Quadrant D Data is divided into 100 sec bins |
 |
 |
| Parameter | Plot |
|---|---|
| CZT HV Monitor | 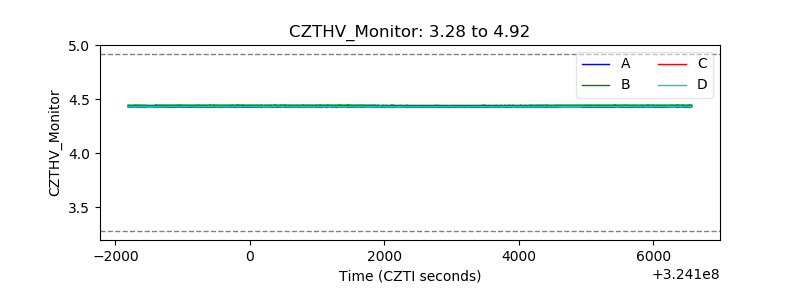 |
| D_VDD | 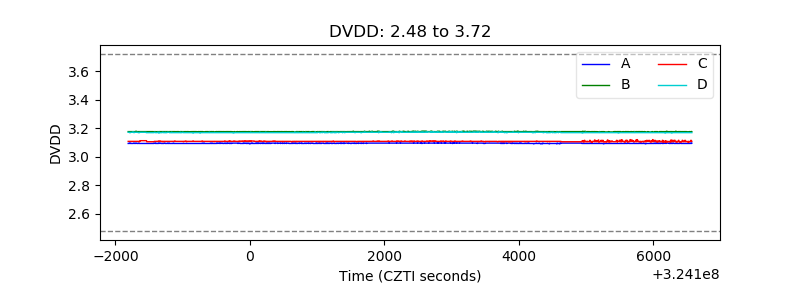 |
| Temperature 1 | 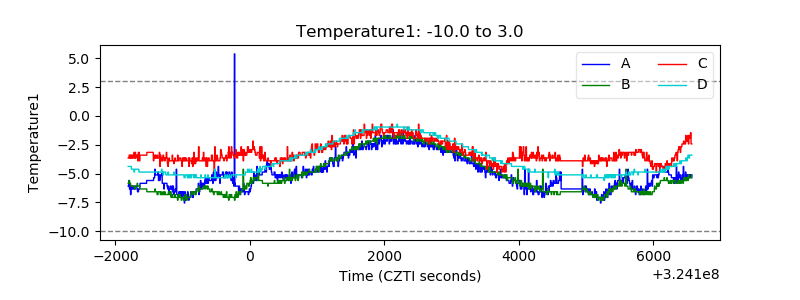 |
| Veto HV Monitor | 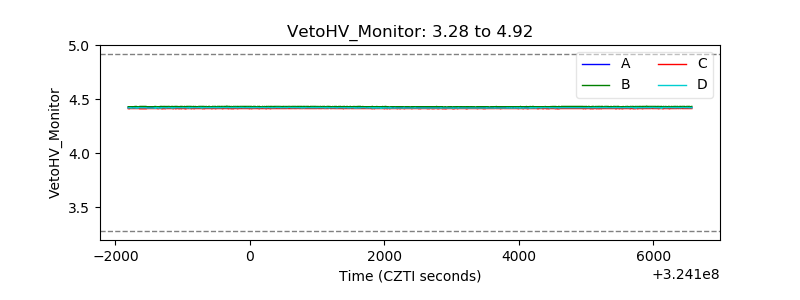 |
| Veto LLD | 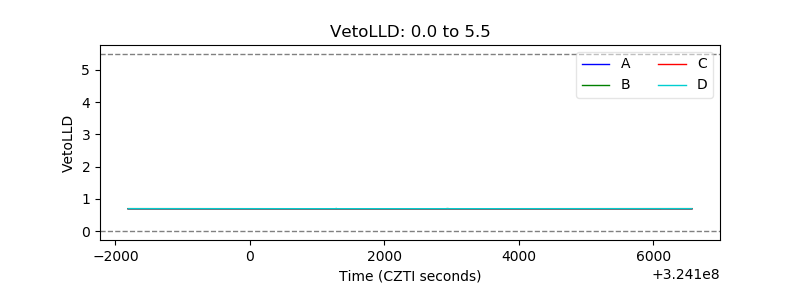 |
| Alpha Counter | 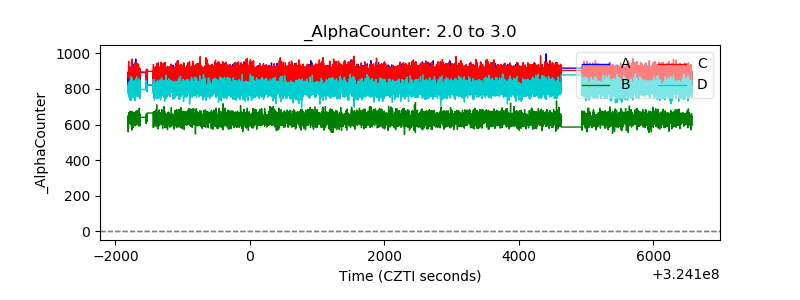 |
| _CPM_Rate | 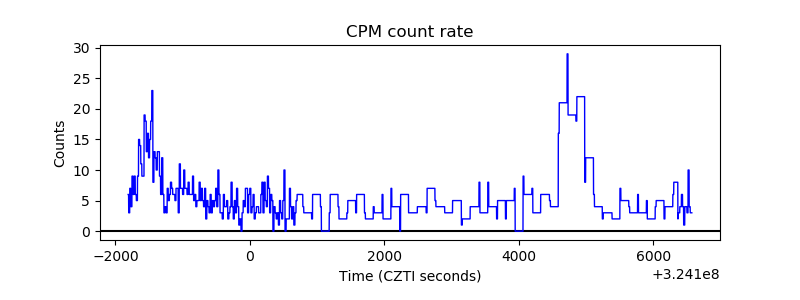 |
| CZT Counter | 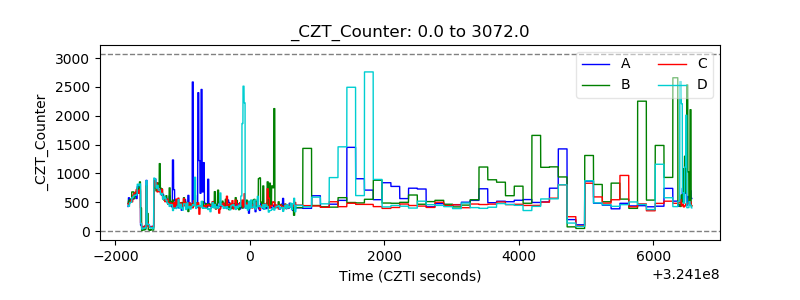 |
| +2.5 Volts monitor |  |
| +5 Volts monitor |  |
| _ROLL_ROT | 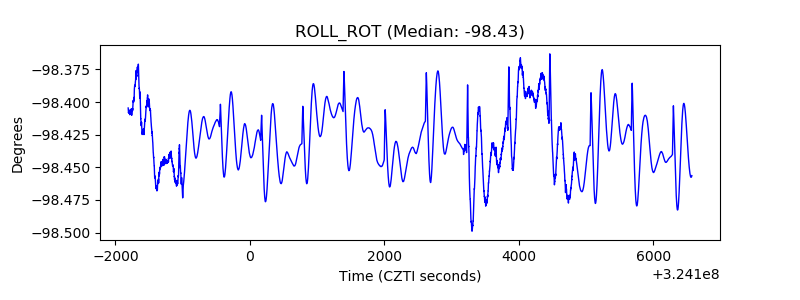 |
| _Roll_DEC | 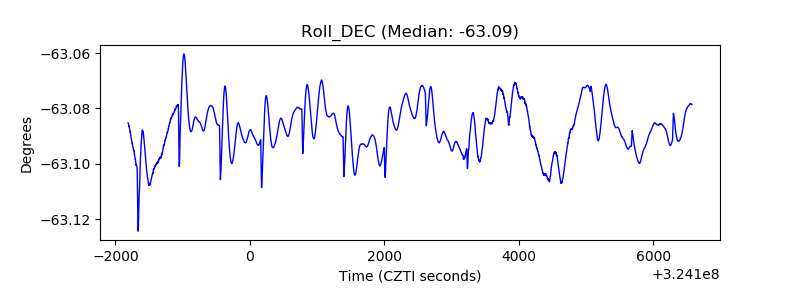 |
| _Roll_RA | 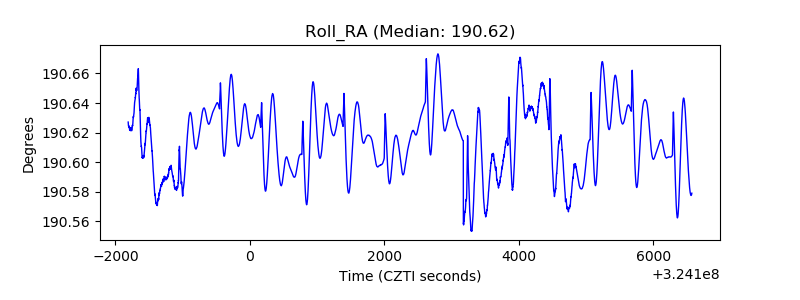 |
| Veto Counter | 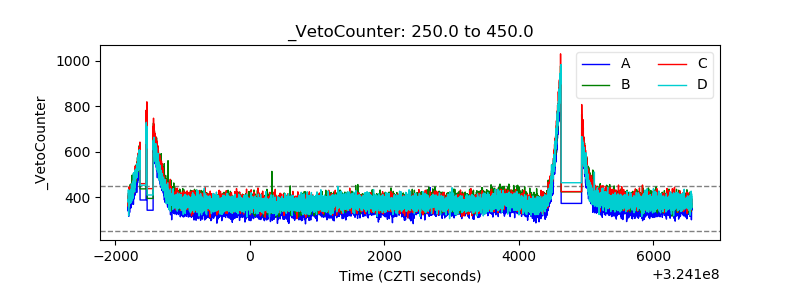 |