| Param | Original file | Final file |
|---|---|---|
| Filename | modeM0/AS1T03_183T01_9000003606_24500cztM0_level2.evt | modeM0/AS1T03_183T01_9000003606_24500cztM0_level2_quad_clean.evt |
| Size (bytes) | 1,274,414,400 | 184,740,480 |
| Size | 1.2 GB | 176.2 MB |
| Events in quadrant A | 7,325,052 | 1,256,484 |
| Events in quadrant B | 16,050,807 | 1,103,601 |
| Events in quadrant C | 5,801,329 | 1,232,298 |
| Events in quadrant D | 8,616,105 | 1,177,396 |
| Mode M0 | |||
|---|---|---|---|
| Quadrant | BADHDUFLAG | Total packets | Discarded packets |
| A | 0 | 29384 | 2 |
| B | 0 | 55921 | 2 |
| C | 0 | 24960 | 2 |
| D | 0 | 33585 | 2 |
| Mode SS | |||
|---|---|---|---|
| Quadrant | BADHDUFLAG | Total packets | Discarded packets |
| A | 0 | 242 | 0 |
| B | 0 | 242 | 0 |
| C | 0 | 242 | 0 |
| D | 0 | 242 | 0 |
| Mode M9 | |||
|---|---|---|---|
| Quadrant | BADHDUFLAG | Total packets | Discarded packets |
| A | 0 | 13 | 0 |
| B | 0 | 13 | 0 |
| C | 0 | 13 | 0 |
| D | 0 | 13 | 0 |
| Quadrant | Total seconds | Saturated seconds | Saturation percentage |
|---|---|---|---|
| A | 11913 | 479 | 4.020818% |
| B | 11913 | 3513 | 29.488794% |
| C | 11913 | 257 | 2.157307% |
| D | 11914 | 630 | 5.287897% |
Noise dominated data is calculated using 1-second bins in cleaned event files. If a bin has >2000 counts, and if more than 50% of those come from <1% of pixels, then it is considered to be noise-dominated and hence unusable.
| Quadrant | # 1 sec bins | Bins with >0 counts | Bins with >2000 counts | High rate bins dominated by noise | Noise dominated (total time) | Noise dominated (detector-on time) | Marked lightcurve |
|---|---|---|---|---|---|---|---|
| A | 13168 | 11913 | 160 | 160 | 1.22% | 1.34% | 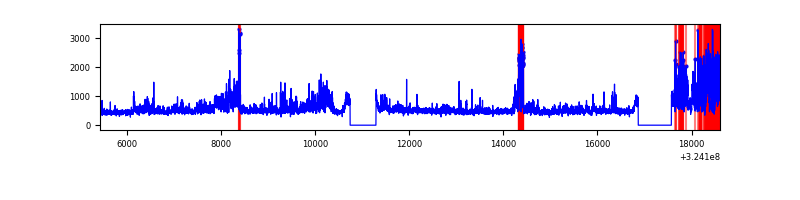 |
| B | 13168 | 11913 | 2155 | 2155 | 16.37% | 18.09% | 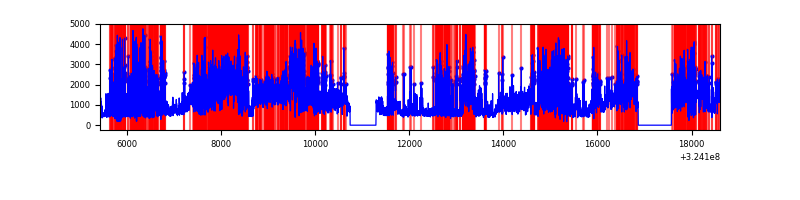 |
| C | 13168 | 11914 | 12 | 12 | 0.09% | 0.10% |  |
| D | 13169 | 11914 | 415 | 415 | 3.15% | 3.48% | 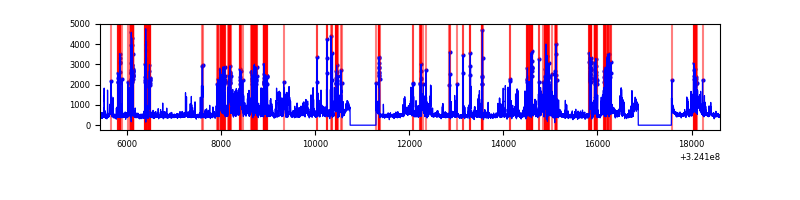 |
Top three noisy pixels from each quadrant. If the there are fewer than three noisy pixels in the level2.evt file, extra rows are filled as -1
| Pixel properties | Quadrant properties | ||||||
|---|---|---|---|---|---|---|---|
| Quadrant | DetID | PixID | Counts | Sigma | Mean | Median | Sigma |
| A | 14 | 111 | 1930847 | 6833.98 | 1398 | 1364 | 282.3 |
| A | 13 | 254 | 18604 | 61.06 | 1398 | 1364 | 282.3 |
| A | 3 | 137 | 12862 | 40.72 | 1398 | 1364 | 282.3 |
| B | 3 | 64 | 11052453 | 46254.53 | 1266 | 1230 | 238.9 |
| B | 12 | 111 | 29511 | 118.37 | 1266 | 1230 | 238.9 |
| B | 11 | 111 | 26034 | 103.81 | 1266 | 1230 | 238.9 |
| C | 2 | 16 | 274825 | 867.25 | 1356 | 1361 | 315.3 |
| C | 14 | 238 | 218558 | 688.8 | 1356 | 1361 | 315.3 |
| C | 8 | 128 | 11458 | 32.02 | 1356 | 1361 | 315.3 |
| D | 1 | 52 | 1379234 | 4144.71 | 1356 | 1313 | 332.5 |
| D | 12 | 218 | 1252157 | 3762.47 | 1356 | 1313 | 332.5 |
| D | 9 | 1 | 494382 | 1483.12 | 1356 | 1313 | 332.5 |
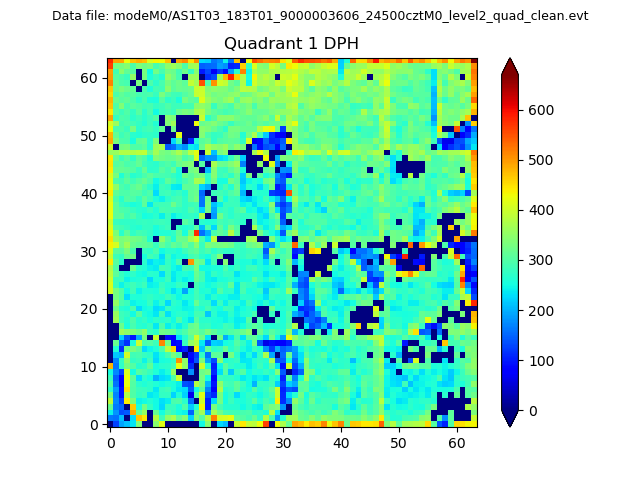
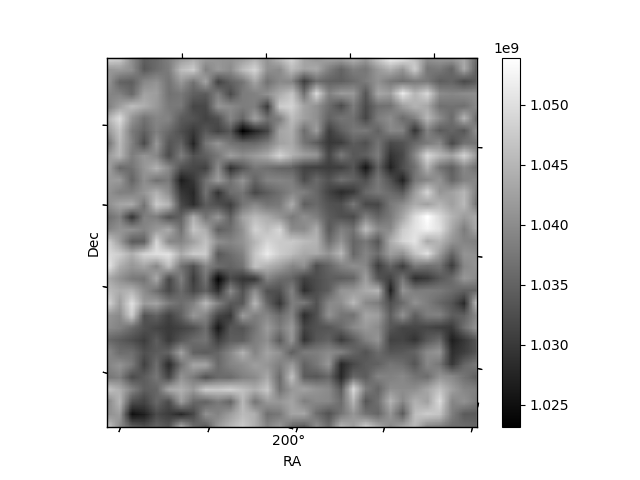
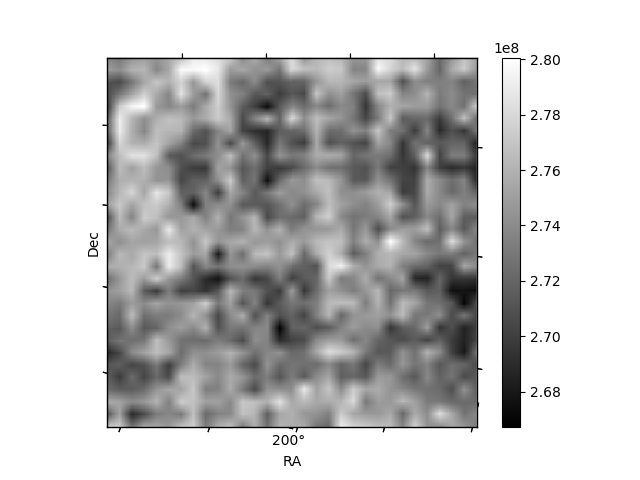
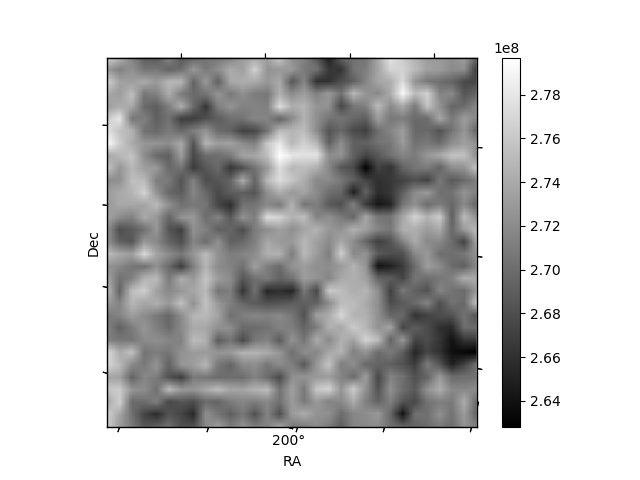
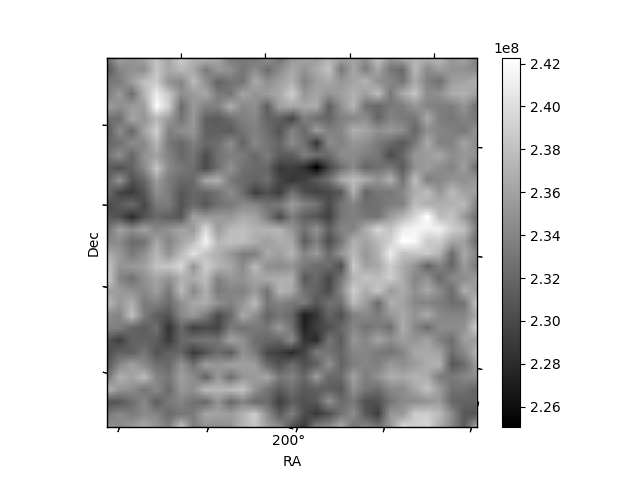
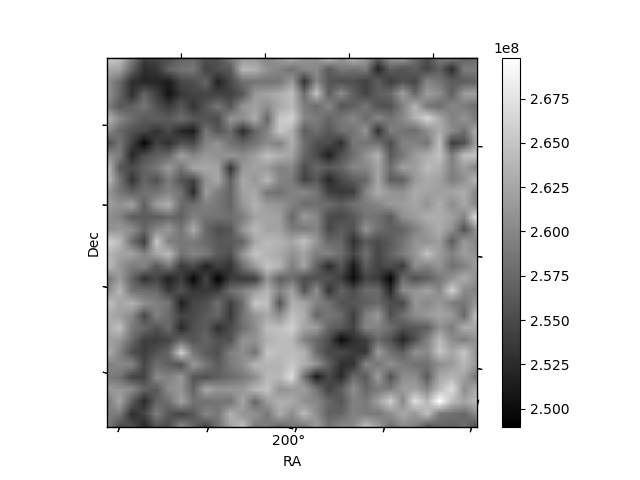
Histogram calculated using DETX and DETY for each event in the final _common_clean file
| Quadrant A | 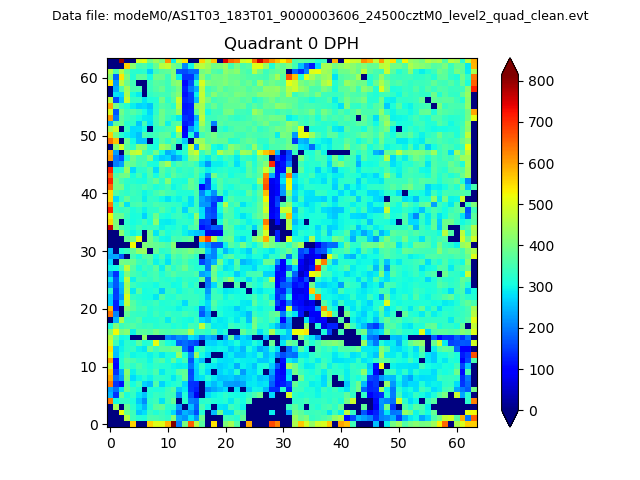 |
 |
Quadrant B |
|---|---|---|---|
| Quadrant D | 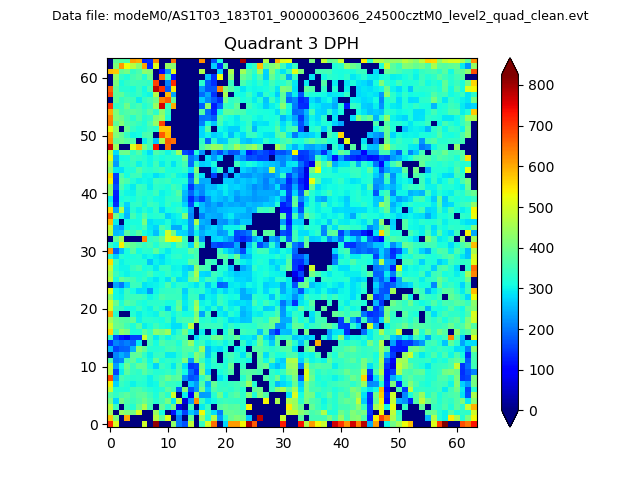 |
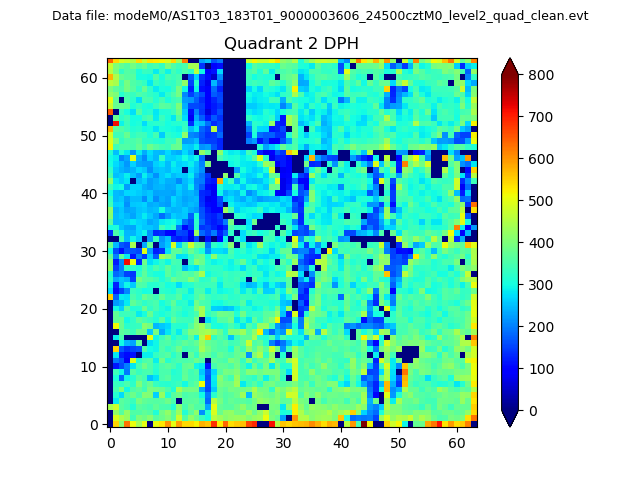 |
Quadrant C |
| Plot type | Count rate plots | Images |
|---|---|---|
| Comparison with Poisson distribution Blue bars denote a histogram of data divided into 1 sec bins. Red curve is a Poisson curve with rate = median count rate of data. |
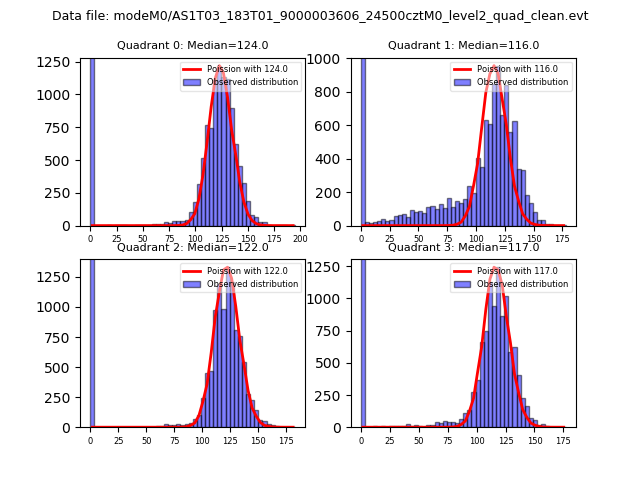 |
 |
| Quadrant-wise count rates Data is divided into 100 sec bins |
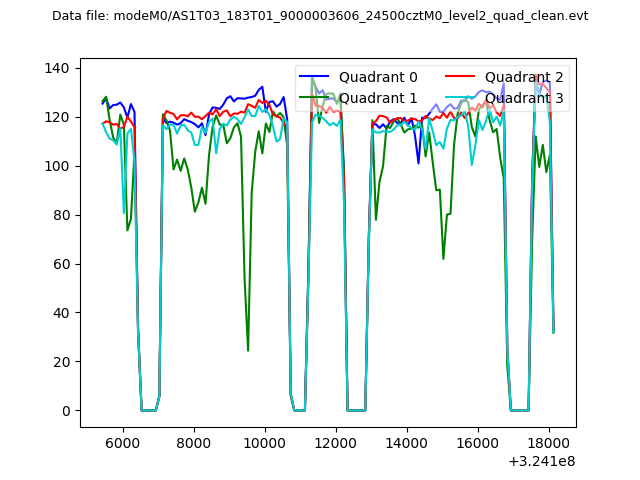 |
|
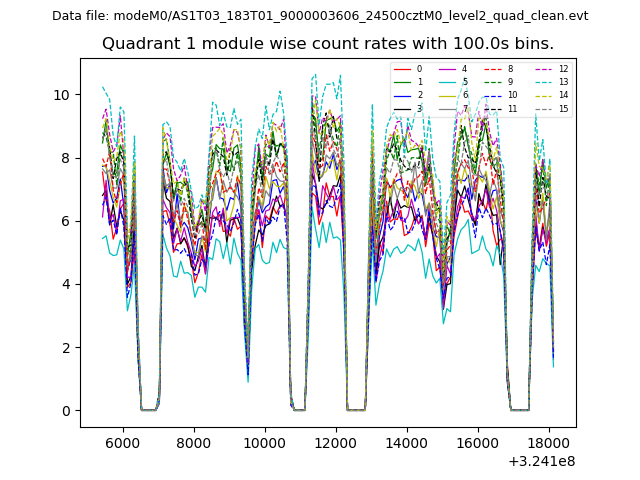
| Module-wise count rates for Quadrant A Data is divided into 100 sec bins |
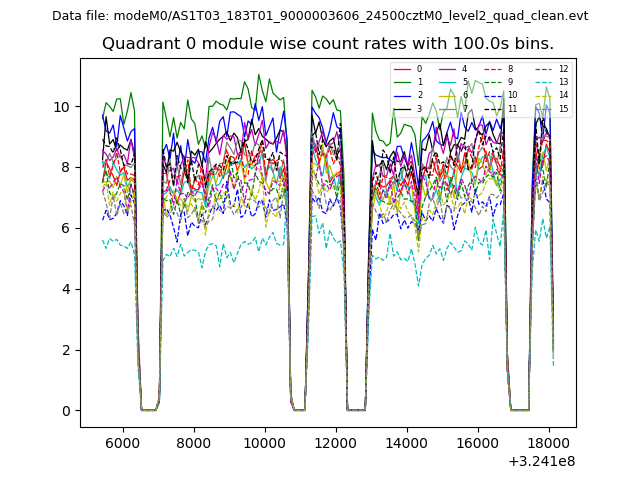 |
 |
| Module-wise count rates for Quadrant B Data is divided into 100 sec bins |
 |
 |
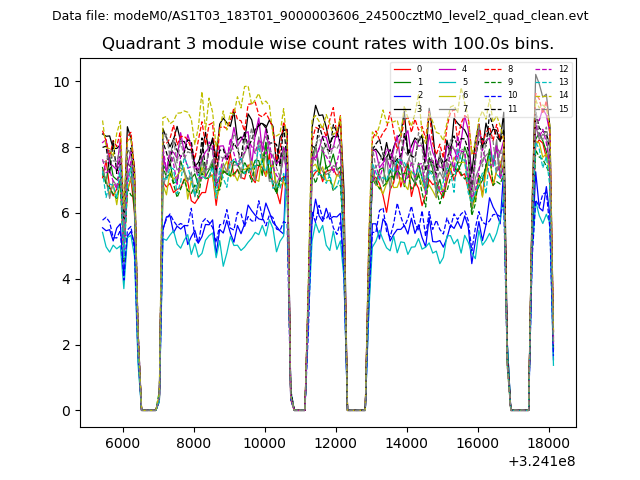
| Module-wise count rates for Quadrant C Data is divided into 100 sec bins |
 |
 |
| Module-wise count rates for Quadrant D Data is divided into 100 sec bins |
 |
 |
| Parameter | Plot |
|---|---|
| CZT HV Monitor | 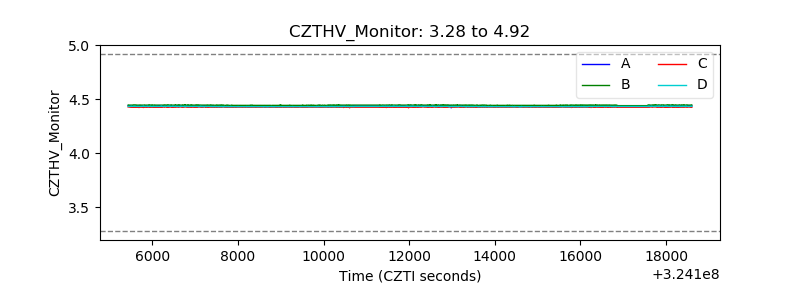 |
| D_VDD | 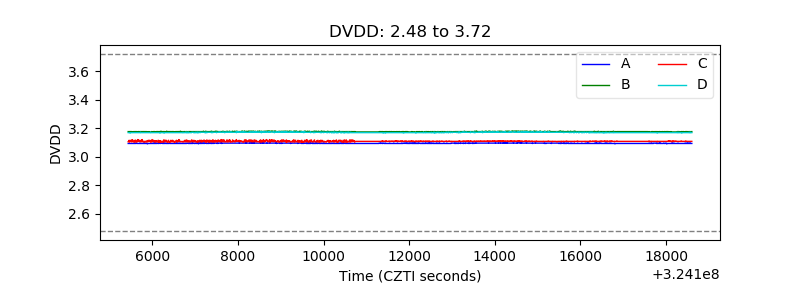 |
| Temperature 1 | 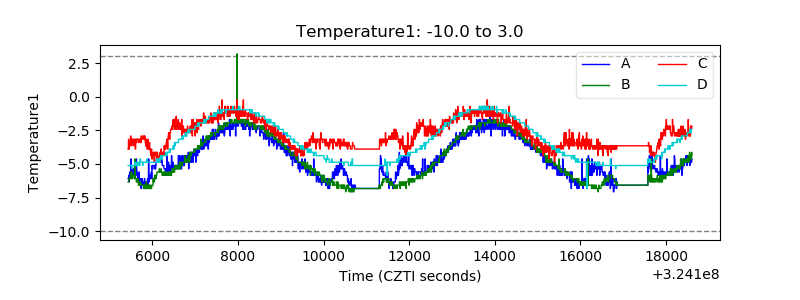 |
| Veto HV Monitor | 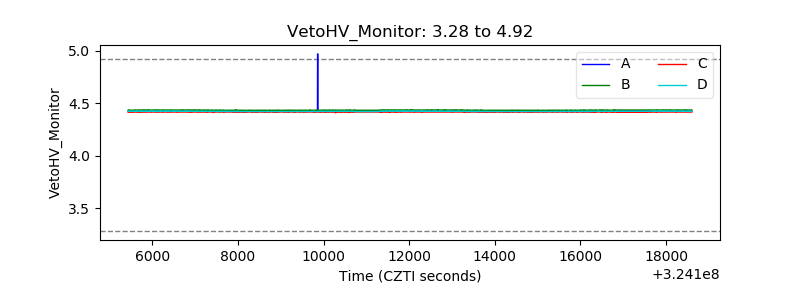 |
| Veto LLD | 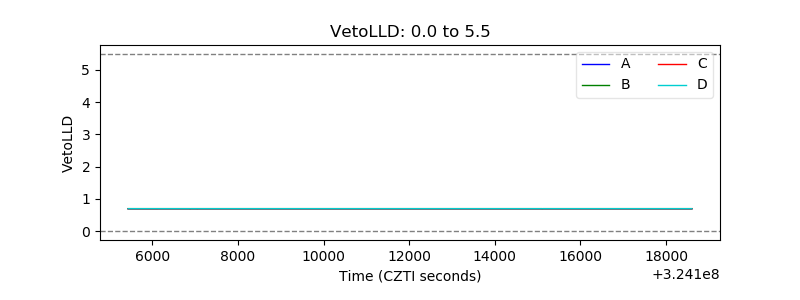 |
| Alpha Counter | 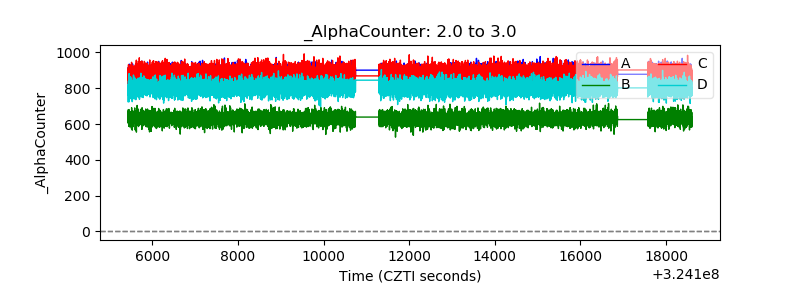 |
| _CPM_Rate | 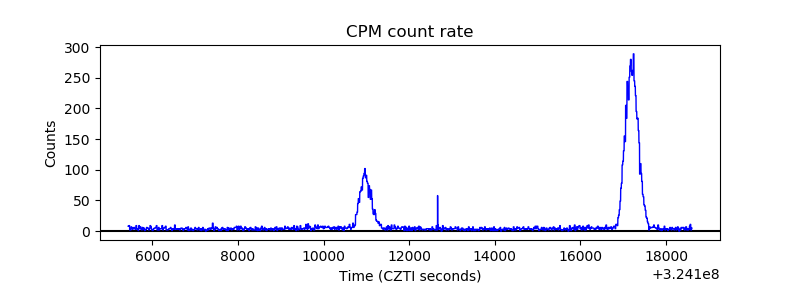 |
| CZT Counter | 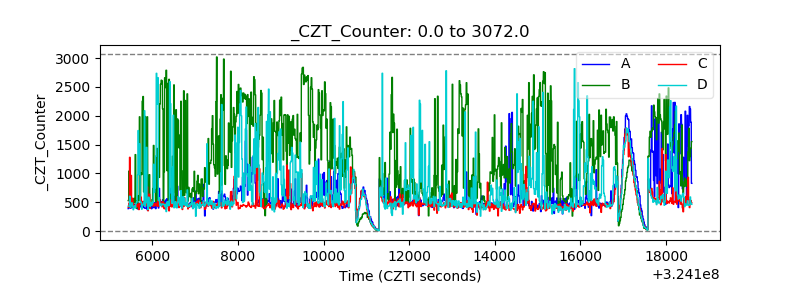 |
| +2.5 Volts monitor |  |
| +5 Volts monitor |  |
| _ROLL_ROT | 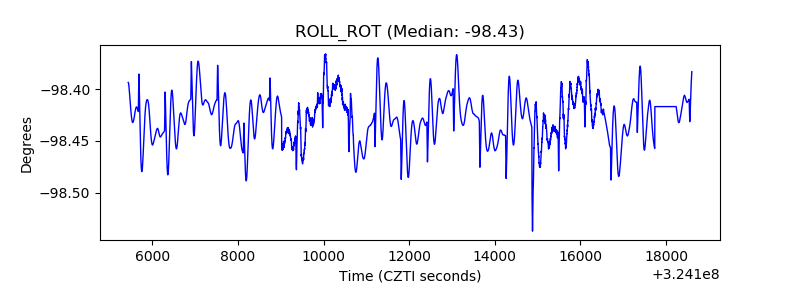 |
| _Roll_DEC | 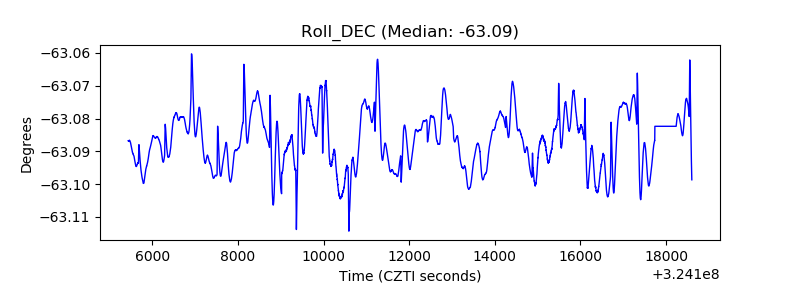 |
| _Roll_RA | 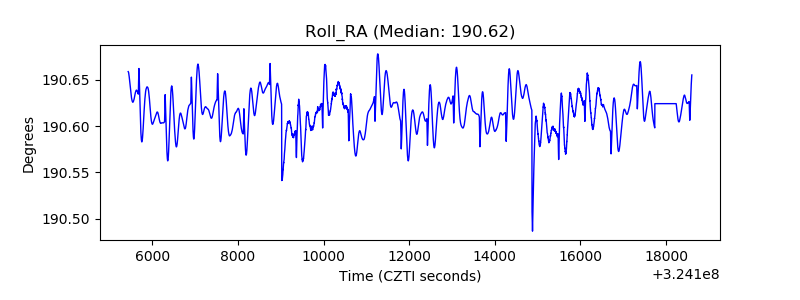 |
| Veto Counter | 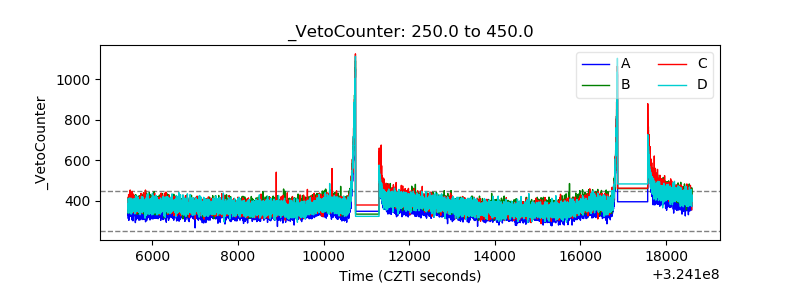 |