| Param | Original file | Final file |
|---|---|---|
| Filename | modeM0/AS1T03_183T01_9000003606_24501cztM0_level2.evt | modeM0/AS1T03_183T01_9000003606_24501cztM0_level2_quad_clean.evt |
| Size (bytes) | 980,369,280 | 192,294,720 |
| Size | 935.0 MB | 183.4 MB |
| Events in quadrant A | 7,348,668 | 1,289,092 |
| Events in quadrant B | 9,465,534 | 1,233,493 |
| Events in quadrant C | 5,381,147 | 1,276,896 |
| Events in quadrant D | 6,732,078 | 1,242,696 |
| Mode M0 | |||
|---|---|---|---|
| Quadrant | BADHDUFLAG | Total packets | Discarded packets |
| A | 0 | 29797 | 2 |
| B | 0 | 35633 | 2 |
| C | 0 | 23574 | 2 |
| D | 0 | 27372 | 2 |
| Mode SS | |||
|---|---|---|---|
| Quadrant | BADHDUFLAG | Total packets | Discarded packets |
| A | 0 | 228 | 0 |
| B | 0 | 228 | 0 |
| C | 0 | 228 | 0 |
| D | 0 | 228 | 0 |
| Mode M9 | |||
|---|---|---|---|
| Quadrant | BADHDUFLAG | Total packets | Discarded packets |
| A | 0 | 19 | 0 |
| B | 0 | 19 | 0 |
| C | 0 | 19 | 0 |
| D | 0 | 19 | 0 |
| Quadrant | Total seconds | Saturated seconds | Saturation percentage |
|---|---|---|---|
| A | 11291 | 567 | 5.021699% |
| B | 11292 | 1700 | 15.054906% |
| C | 11292 | 183 | 1.620616% |
| D | 11292 | 231 | 2.045696% |
Noise dominated data is calculated using 1-second bins in cleaned event files. If a bin has >2000 counts, and if more than 50% of those come from <1% of pixels, then it is considered to be noise-dominated and hence unusable.
| Quadrant | # 1 sec bins | Bins with >0 counts | Bins with >2000 counts | High rate bins dominated by noise | Noise dominated (total time) | Noise dominated (detector-on time) | Marked lightcurve |
|---|---|---|---|---|---|---|---|
| A | 13231 | 11292 | 159 | 159 | 1.20% | 1.41% | 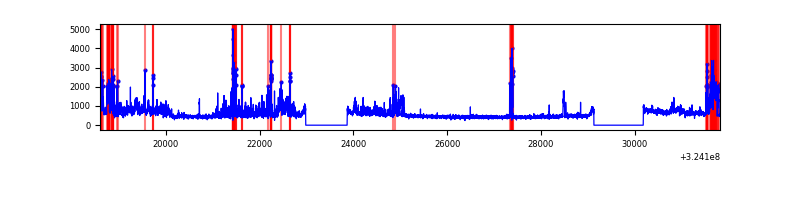 |
| B | 13232 | 11294 | 773 | 773 | 5.84% | 6.84% | 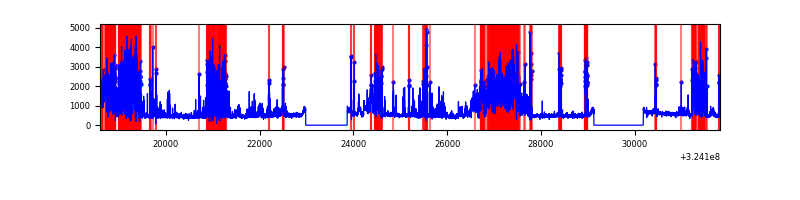 |
| C | 13232 | 11293 | 1 | 1 | 0.01% | 0.01% | 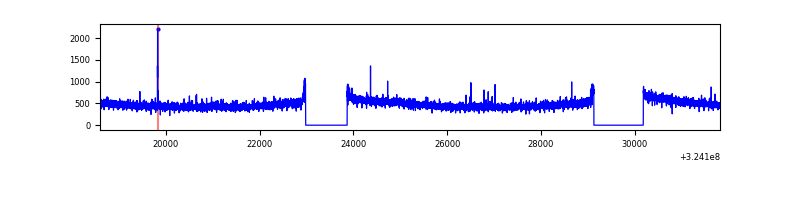 |
| D | 13232 | 11294 | 136 | 136 | 1.03% | 1.20% | 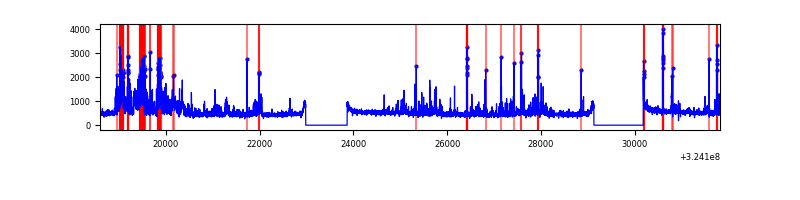 |
Top three noisy pixels from each quadrant. If the there are fewer than three noisy pixels in the level2.evt file, extra rows are filled as -1
| Pixel properties | Quadrant properties | ||||||
|---|---|---|---|---|---|---|---|
| Quadrant | DetID | PixID | Counts | Sigma | Mean | Median | Sigma |
| A | 14 | 111 | 1814820 | 6637.45 | 1366 | 1338 | 273.2 |
| A | 4 | 2 | 271131 | 987.46 | 1366 | 1338 | 273.2 |
| A | 13 | 254 | 17807 | 60.28 | 1366 | 1338 | 273.2 |
| B | 3 | 64 | 4351004 | 18169.68 | 1289 | 1260 | 239.4 |
| B | 12 | 111 | 29308 | 117.16 | 1289 | 1260 | 239.4 |
| B | 0 | 190 | 27816 | 110.93 | 1289 | 1260 | 239.4 |
| C | 14 | 238 | 212336 | 697.33 | 1314 | 1321 | 302.6 |
| C | 2 | 16 | 32383 | 102.65 | 1314 | 1321 | 302.6 |
| C | 7 | 247 | 14614 | 43.93 | 1314 | 1321 | 302.6 |
| D | 1 | 52 | 904714 | 2814.75 | 1333 | 1294 | 321.0 |
| D | 12 | 218 | 400936 | 1245.15 | 1333 | 1294 | 321.0 |
| D | 8 | 195 | 249046 | 771.91 | 1333 | 1294 | 321.0 |
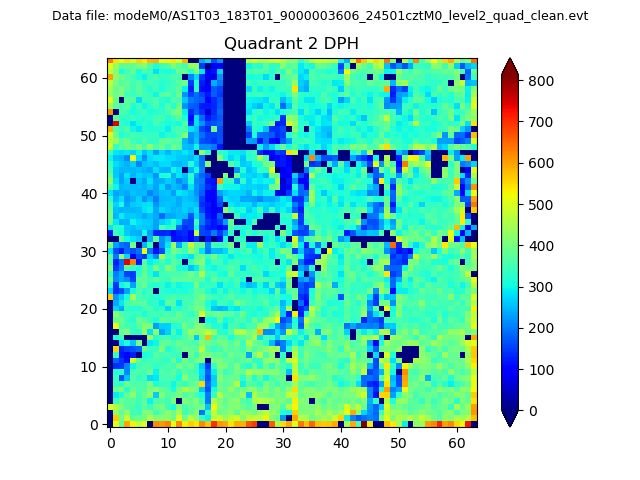
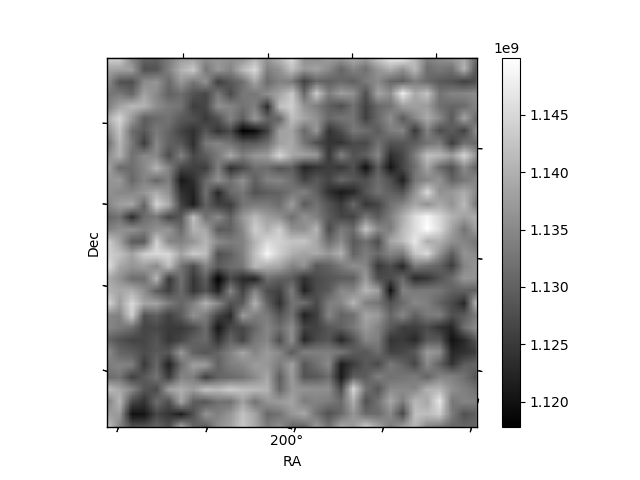
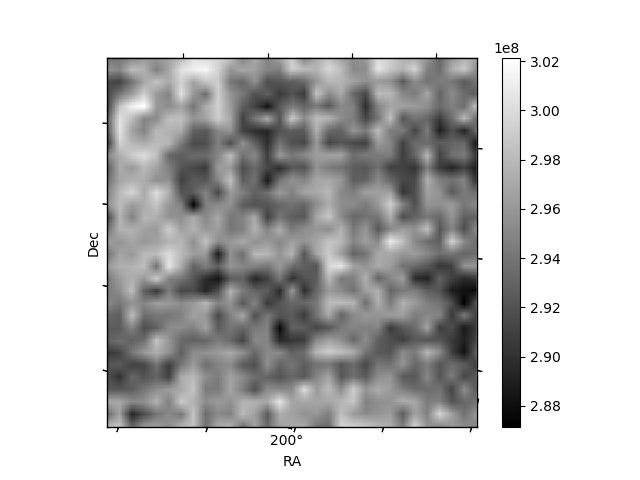
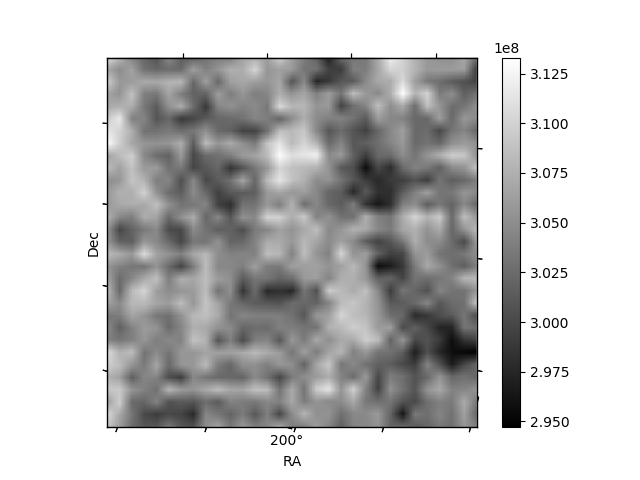
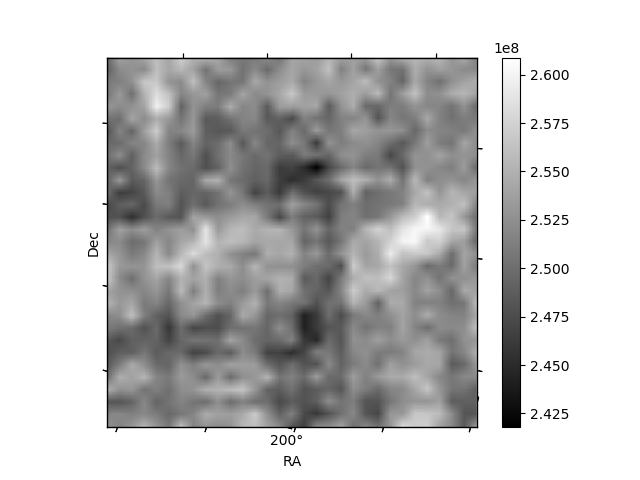
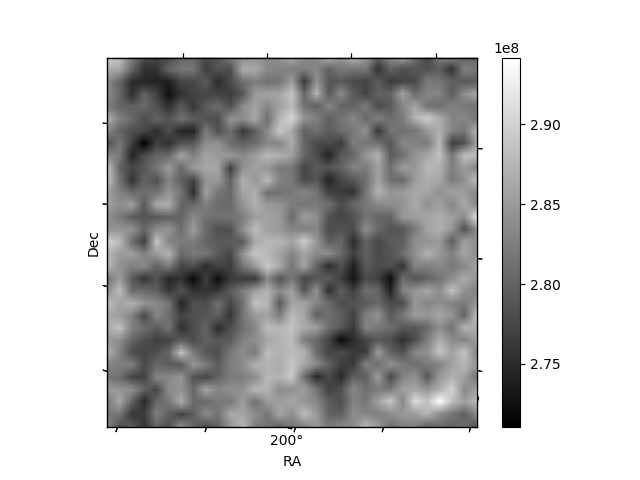
Histogram calculated using DETX and DETY for each event in the final _common_clean file
| Quadrant A | 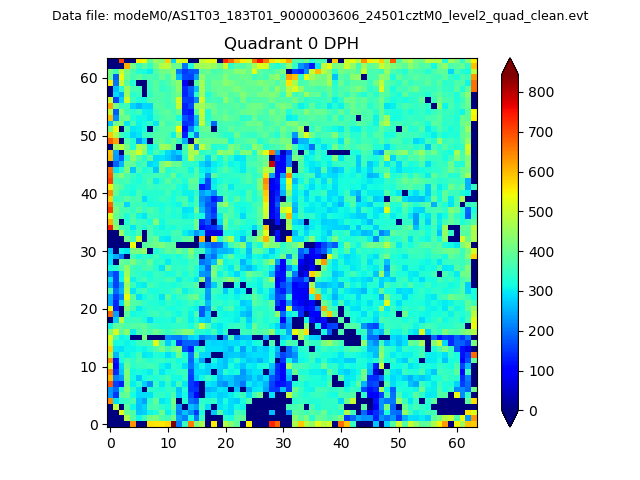 |
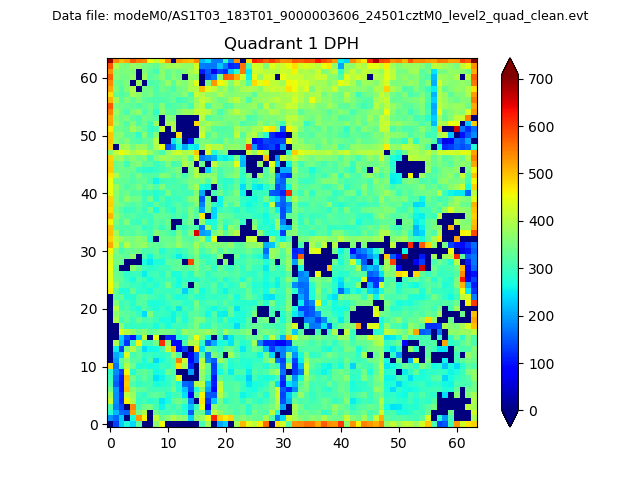 |
Quadrant B |
|---|---|---|---|
| Quadrant D | 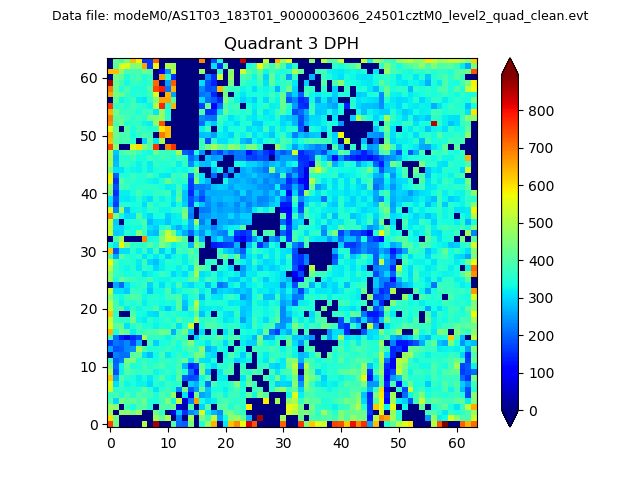 |
 |
Quadrant C |
| Plot type | Count rate plots | Images |
|---|---|---|
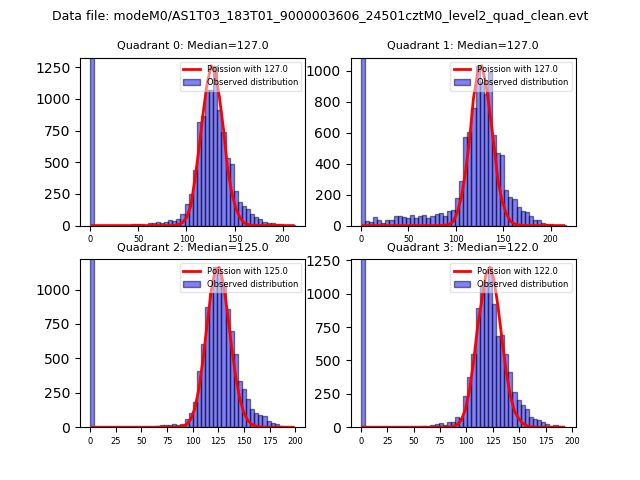
| Comparison with Poisson distribution Blue bars denote a histogram of data divided into 1 sec bins. Red curve is a Poisson curve with rate = median count rate of data. |
 |
 |
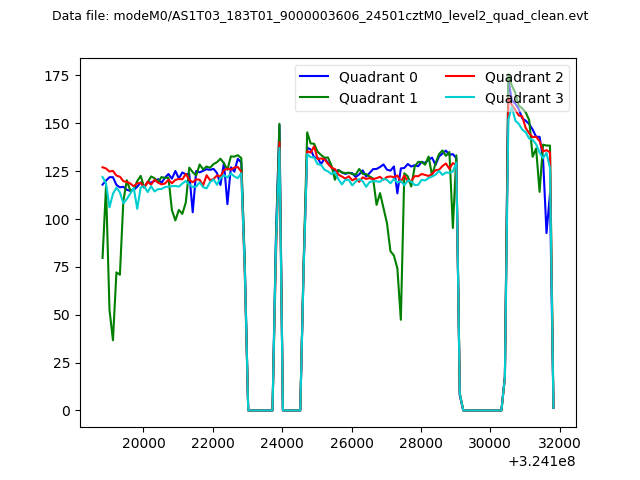
| Quadrant-wise count rates Data is divided into 100 sec bins |
 |
|
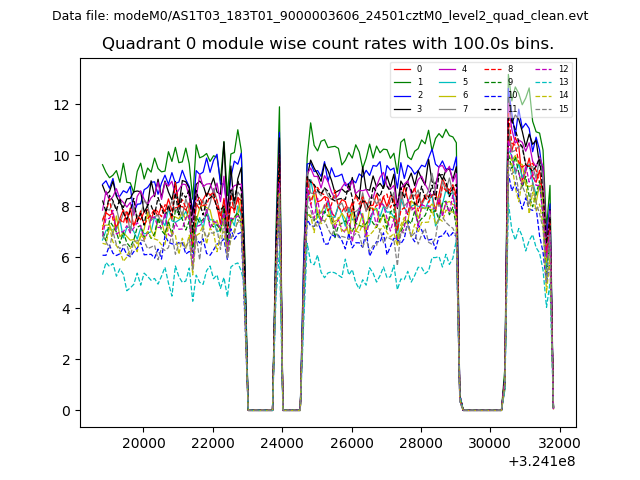
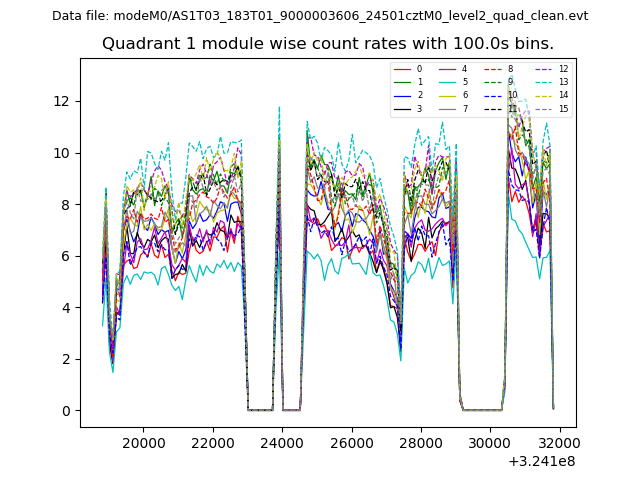
| Module-wise count rates for Quadrant A Data is divided into 100 sec bins |
 |
 |
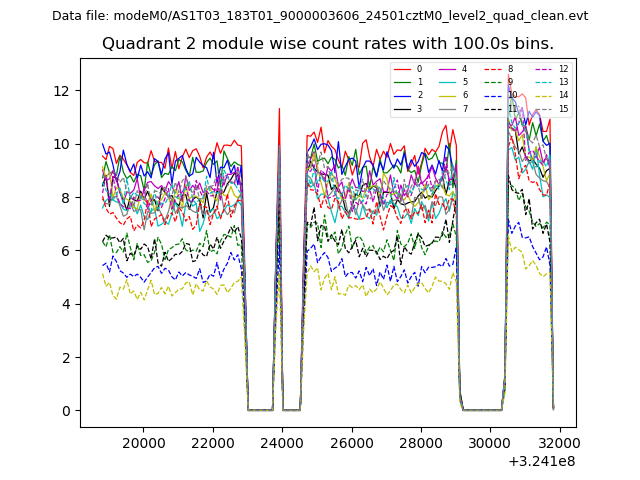
| Module-wise count rates for Quadrant B Data is divided into 100 sec bins |
 |
 |
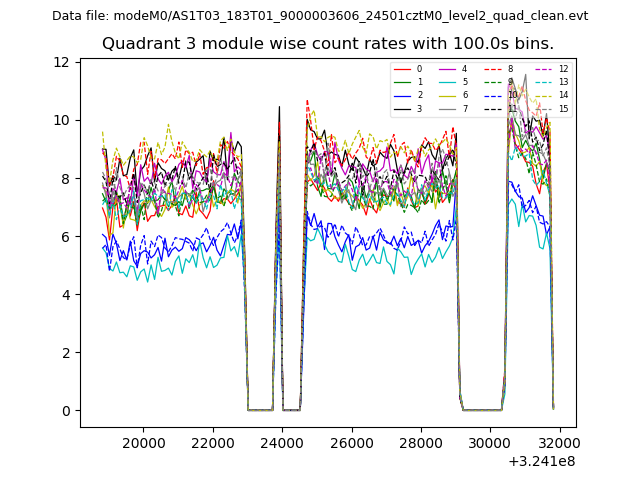
| Module-wise count rates for Quadrant C Data is divided into 100 sec bins |
 |
 |
| Module-wise count rates for Quadrant D Data is divided into 100 sec bins |
 |
 |
| Parameter | Plot |
|---|---|
| CZT HV Monitor | 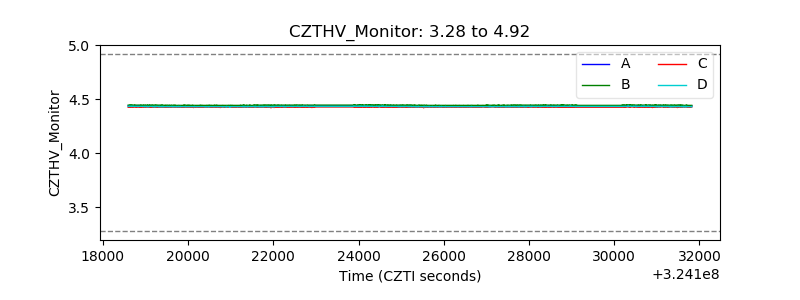 |
| D_VDD | 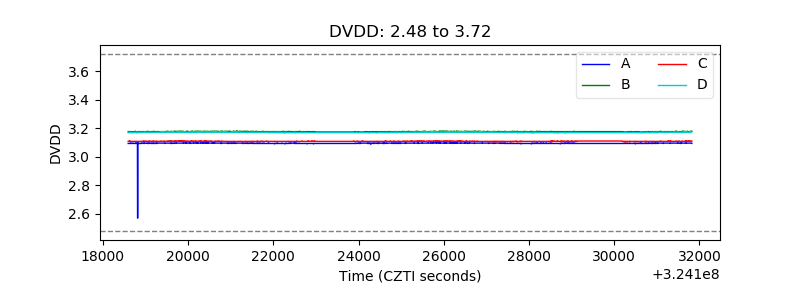 |
| Temperature 1 | 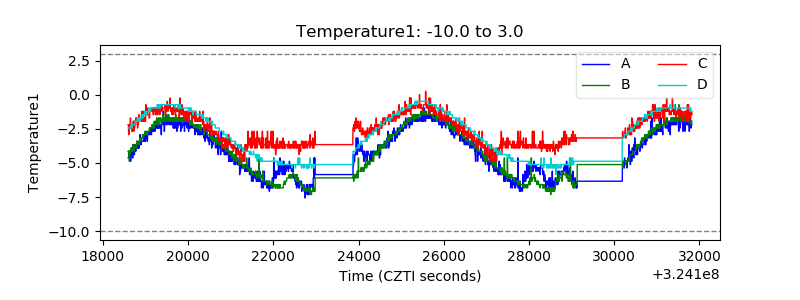 |
| Veto HV Monitor | 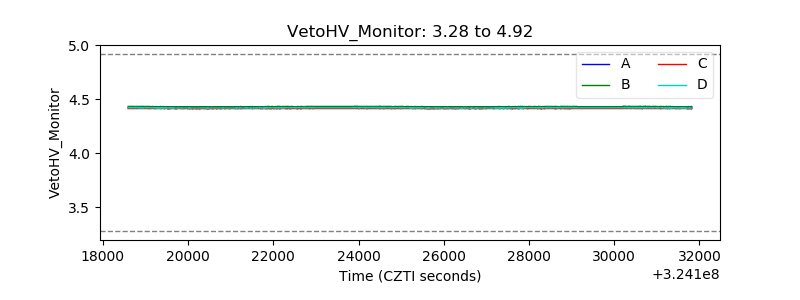 |
| Veto LLD | 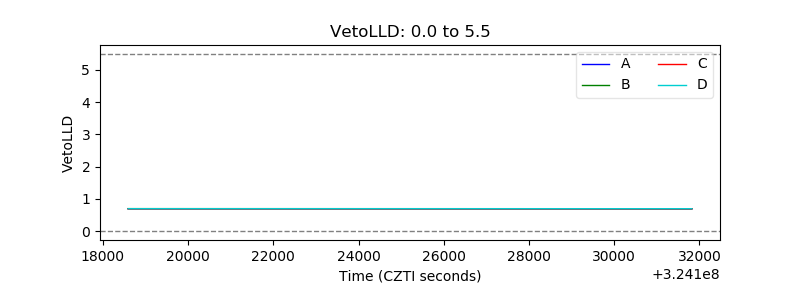 |
| Alpha Counter | 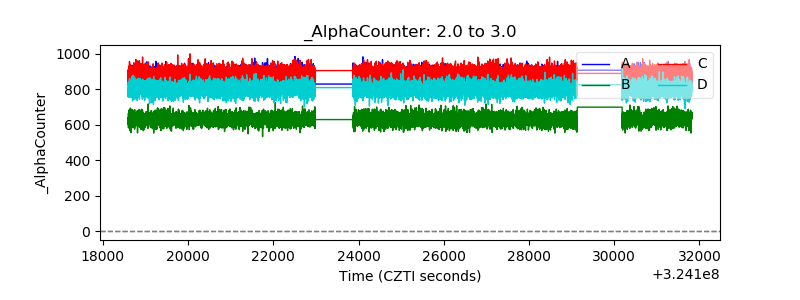 |
| _CPM_Rate | 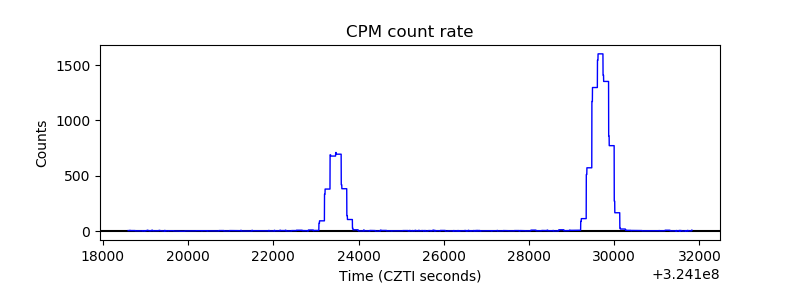 |
| CZT Counter | 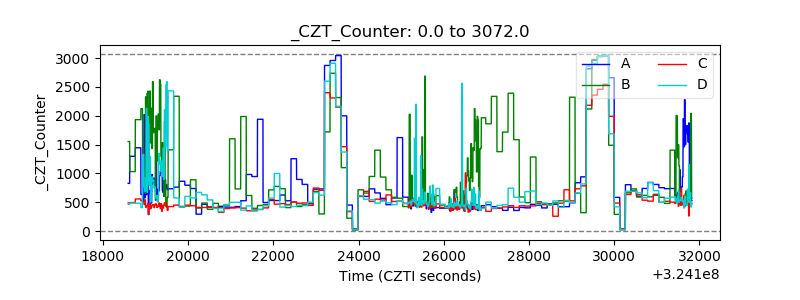 |
| +2.5 Volts monitor |  |
| +5 Volts monitor |  |
| _ROLL_ROT | 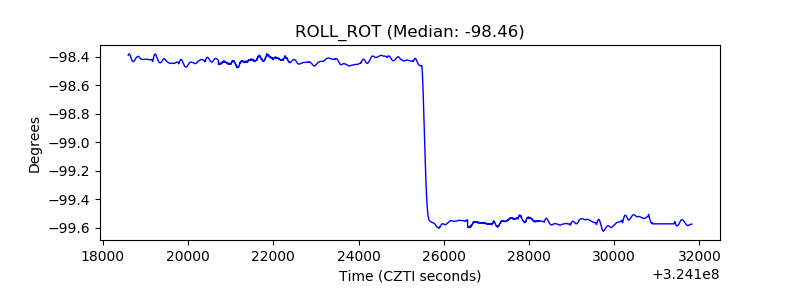 |
| _Roll_DEC | 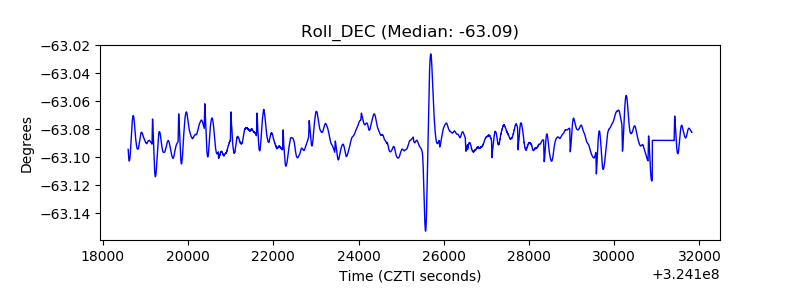 |
| _Roll_RA | 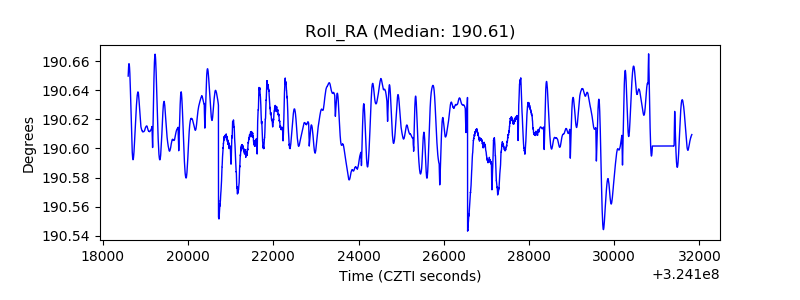 |
| Veto Counter | 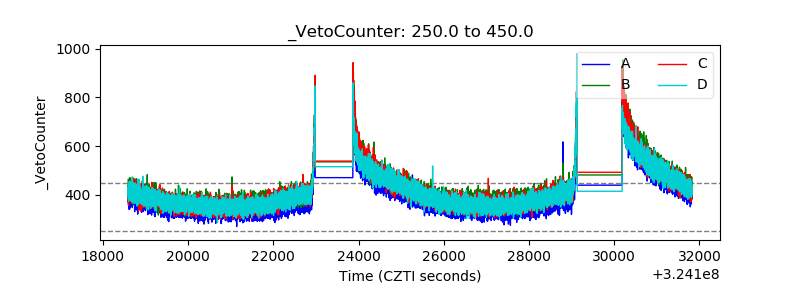 |