| Param | Original file | Final file |
|---|---|---|
| Filename | modeM0/AS1T03_183T01_9000003606_24503cztM0_level2.evt | modeM0/AS1T03_183T01_9000003606_24503cztM0_level2_quad_clean.evt |
| Size (bytes) | 542,450,880 | 132,307,200 |
| Size | 517.3 MB | 126.2 MB |
| Events in quadrant A | 4,460,501 | 909,779 |
| Events in quadrant B | 4,325,769 | 912,942 |
| Events in quadrant C | 3,213,262 | 883,077 |
| Events in quadrant D | 4,000,332 | 860,515 |
| Mode M0 | |||
|---|---|---|---|
| Quadrant | BADHDUFLAG | Total packets | Discarded packets |
| A | 0 | 17638 | 1 |
| B | 0 | 17045 | 1 |
| C | 0 | 13735 | 1 |
| D | 0 | 16017 | 1 |
| Mode SS | |||
|---|---|---|---|
| Quadrant | BADHDUFLAG | Total packets | Discarded packets |
| A | 0 | 128 | 0 |
| B | 0 | 128 | 0 |
| C | 0 | 128 | 0 |
| D | 0 | 128 | 0 |
| Mode M9 | |||
|---|---|---|---|
| Quadrant | BADHDUFLAG | Total packets | Discarded packets |
| A | 0 | 12 | 0 |
| B | 0 | 12 | 0 |
| C | 0 | 12 | 0 |
| D | 0 | 12 | 0 |
| Quadrant | Total seconds | Saturated seconds | Saturation percentage |
|---|---|---|---|
| A | 6317 | 340 | 5.382302% |
| B | 6318 | 415 | 6.568534% |
| C | 6318 | 108 | 1.709402% |
| D | 6318 | 176 | 2.785692% |
Noise dominated data is calculated using 1-second bins in cleaned event files. If a bin has >2000 counts, and if more than 50% of those come from <1% of pixels, then it is considered to be noise-dominated and hence unusable.
| Quadrant | # 1 sec bins | Bins with >0 counts | Bins with >2000 counts | High rate bins dominated by noise | Noise dominated (total time) | Noise dominated (detector-on time) | Marked lightcurve |
|---|---|---|---|---|---|---|---|
| A | 7477 | 6318 | 102 | 102 | 1.36% | 1.61% | 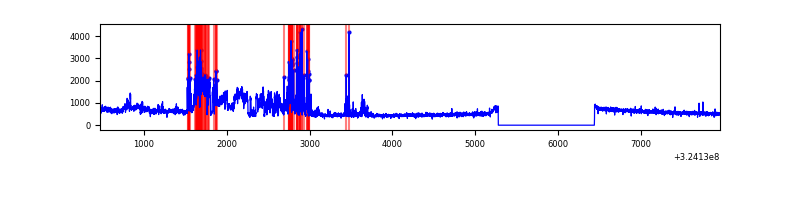 |
| B | 7478 | 6319 | 194 | 194 | 2.59% | 3.07% | 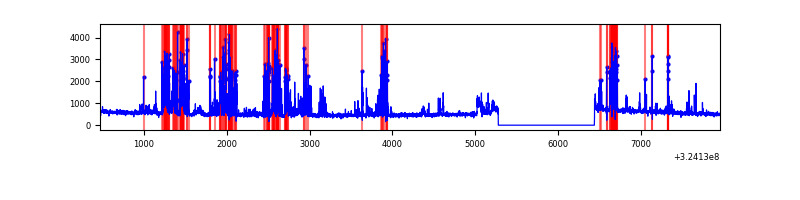 |
| C | 7478 | 6319 | 3 | 3 | 0.04% | 0.05% | 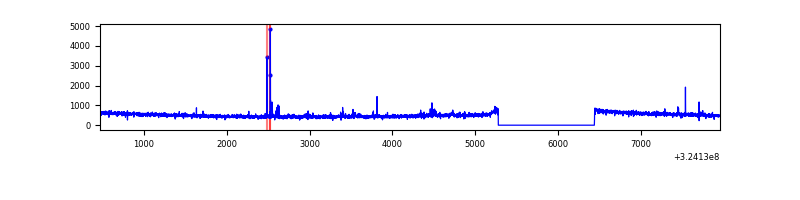 |
| D | 7478 | 6319 | 143 | 143 | 1.91% | 2.26% | 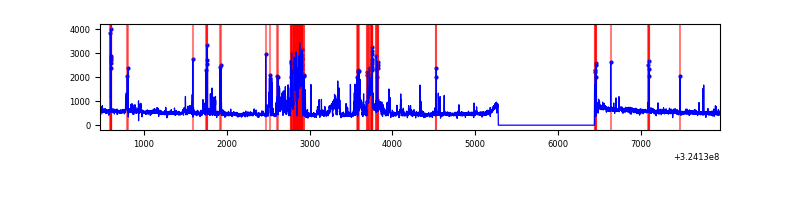 |
Top three noisy pixels from each quadrant. If the there are fewer than three noisy pixels in the level2.evt file, extra rows are filled as -1
| Pixel properties | Quadrant properties | ||||||
|---|---|---|---|---|---|---|---|
| Quadrant | DetID | PixID | Counts | Sigma | Mean | Median | Sigma |
| A | 14 | 111 | 994723 | 6148.25 | 816 | 802 | 161.7 |
| A | 4 | 2 | 322835 | 1992.05 | 816 | 802 | 161.7 |
| A | 13 | 254 | 9633 | 54.63 | 816 | 802 | 161.7 |
| B | 3 | 64 | 1193294 | 8147.12 | 795 | 779 | 146.4 |
| B | 12 | 111 | 16995 | 110.79 | 795 | 779 | 146.4 |
| B | 11 | 111 | 15296 | 99.18 | 795 | 779 | 146.4 |
| C | 14 | 238 | 128851 | 721.49 | 772 | 777 | 177.5 |
| C | 2 | 16 | 68914 | 383.84 | 772 | 777 | 177.5 |
| C | 7 | 247 | 6804 | 33.95 | 772 | 777 | 177.5 |
| D | 9 | 1 | 707871 | 3759.1 | 785 | 764 | 188.1 |
| D | 1 | 52 | 151848 | 803.19 | 785 | 764 | 188.1 |
| D | 12 | 218 | 78593 | 413.75 | 785 | 764 | 188.1 |
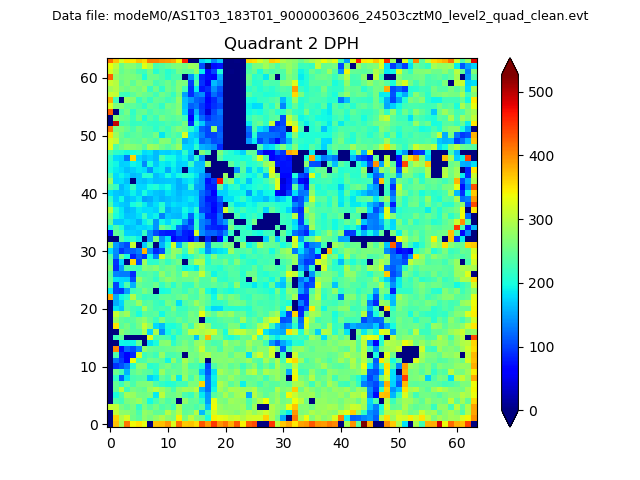
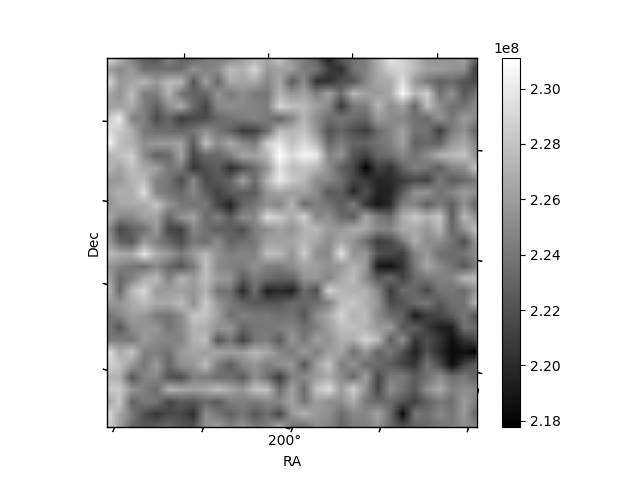
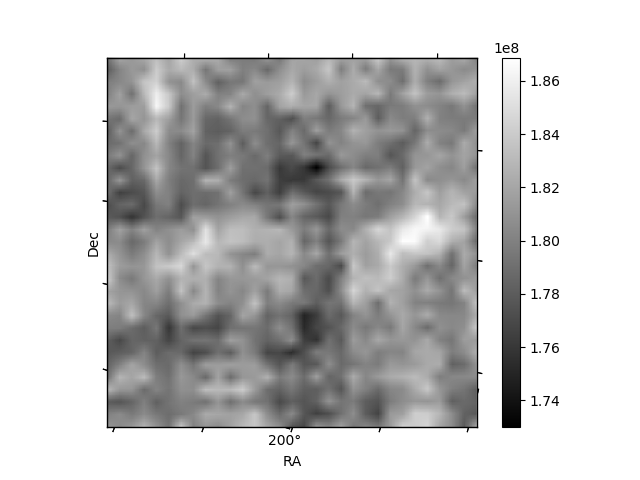
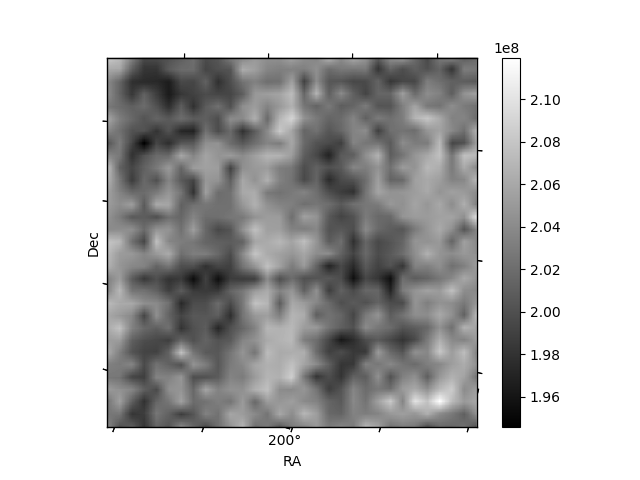
Histogram calculated using DETX and DETY for each event in the final _common_clean file
| Quadrant A | 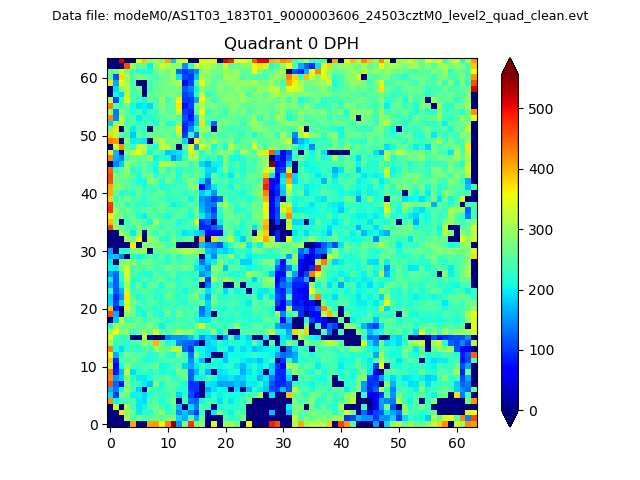 |
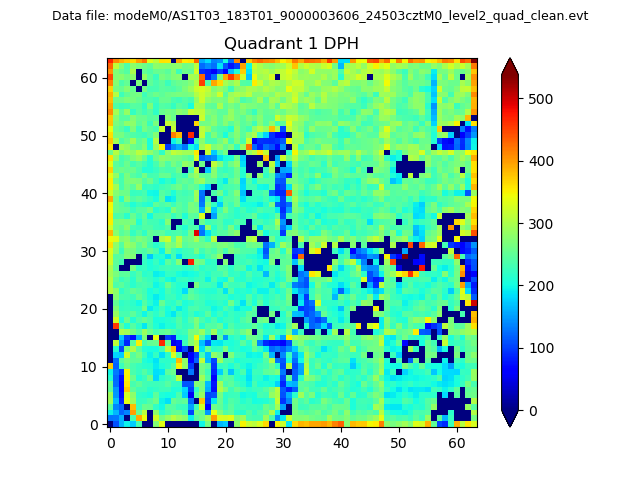 |
Quadrant B |
|---|---|---|---|
| Quadrant D | 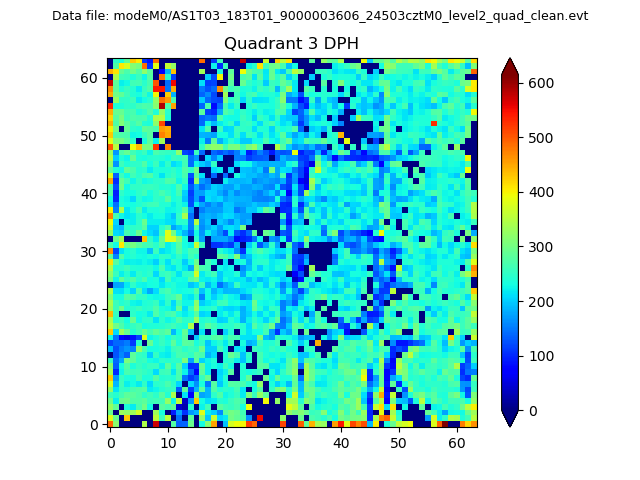 |
 |
Quadrant C |
| Plot type | Count rate plots | Images |
|---|---|---|
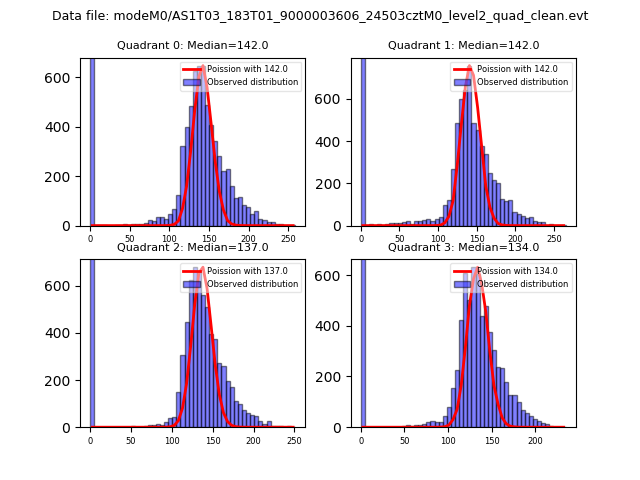
| Comparison with Poisson distribution Blue bars denote a histogram of data divided into 1 sec bins. Red curve is a Poisson curve with rate = median count rate of data. |
 |
 |
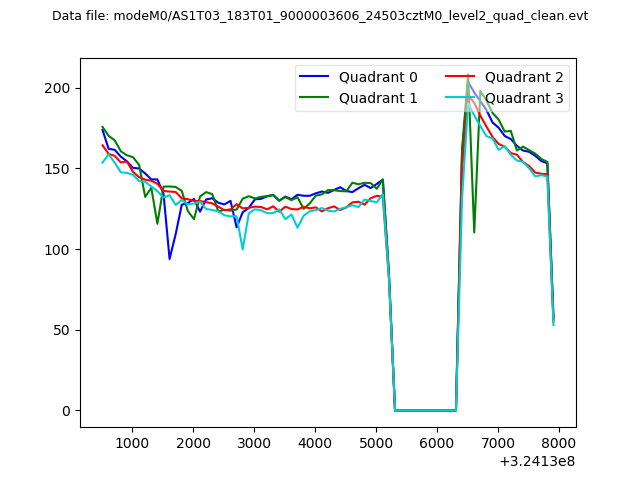
| Quadrant-wise count rates Data is divided into 100 sec bins |
 |
|
| Module-wise count rates for Quadrant A Data is divided into 100 sec bins |
 |
 |
| Module-wise count rates for Quadrant B Data is divided into 100 sec bins |
 |
 |
| Module-wise count rates for Quadrant C Data is divided into 100 sec bins |
 |
 |
| Module-wise count rates for Quadrant D Data is divided into 100 sec bins |
 |
 |
| Parameter | Plot |
|---|---|
| CZT HV Monitor |  |
| D_VDD | 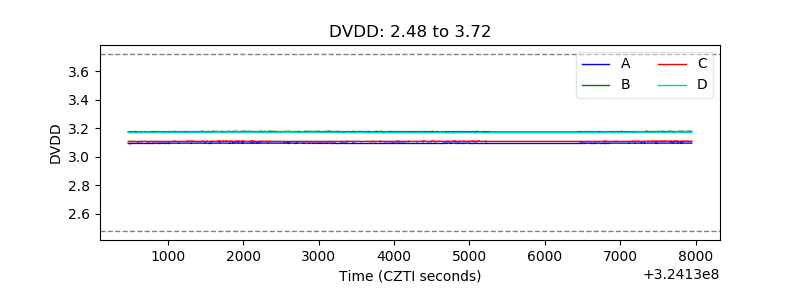 |
| Temperature 1 | 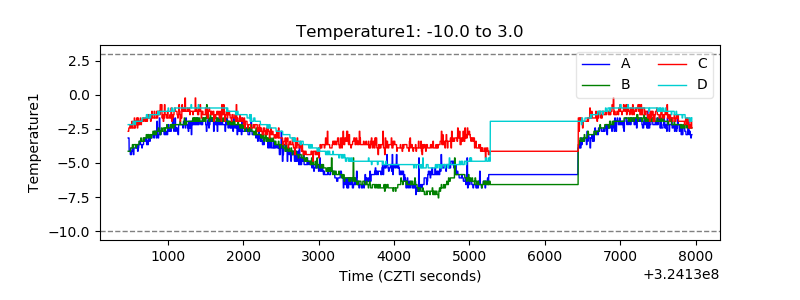 |
| Veto HV Monitor | 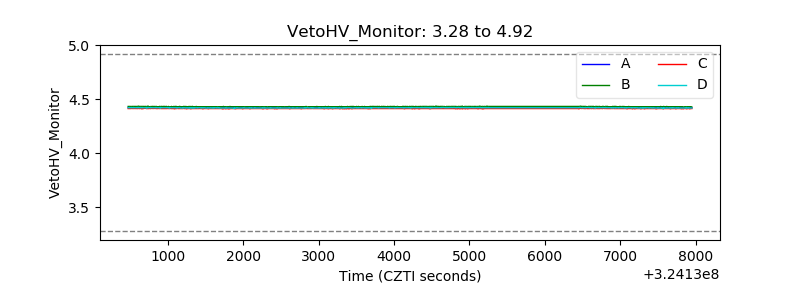 |
| Veto LLD | 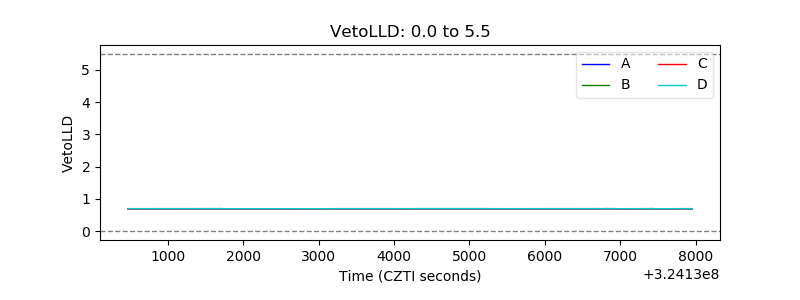 |
| Alpha Counter | 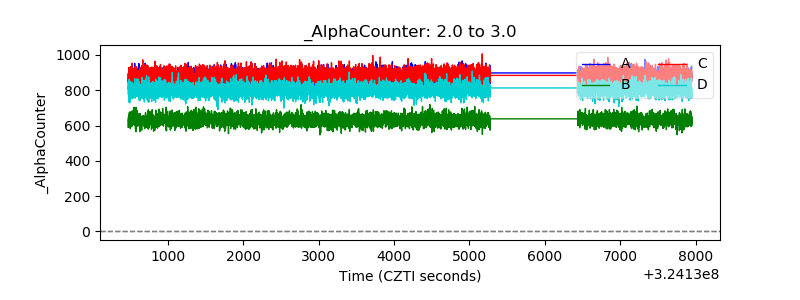 |
| _CPM_Rate | 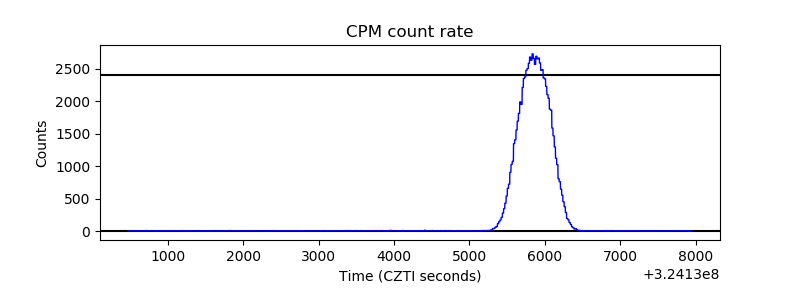 |
| CZT Counter | 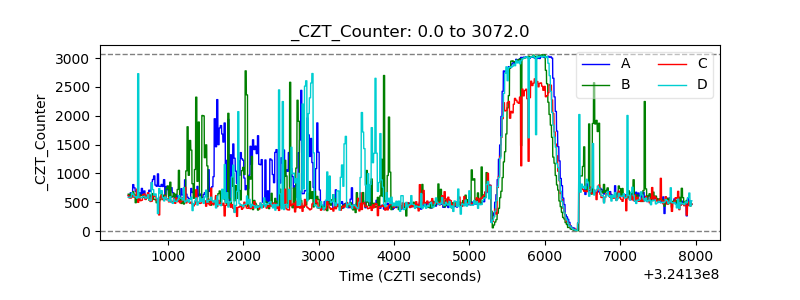 |
| +2.5 Volts monitor |  |
| +5 Volts monitor |  |
| _ROLL_ROT |  |
| _Roll_DEC | 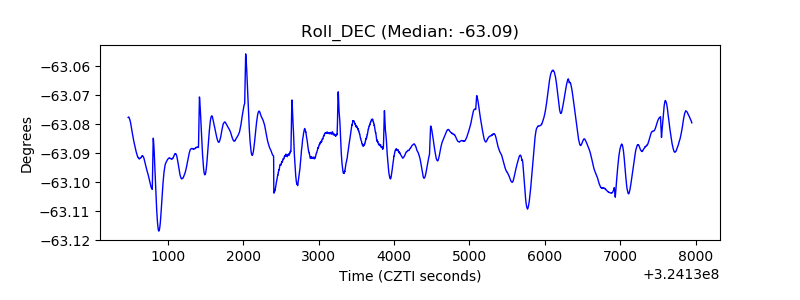 |
| _Roll_RA | 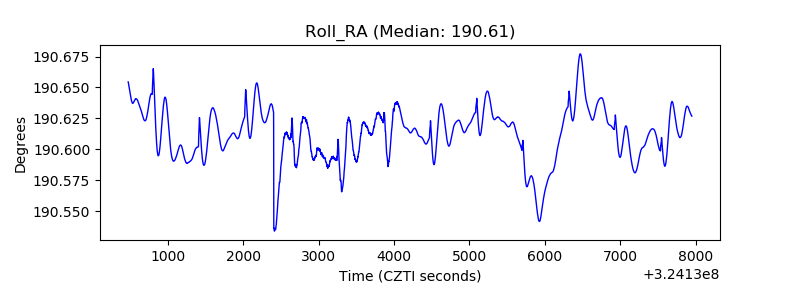 |
| Veto Counter |  |