| Param | Original file | Final file |
|---|---|---|
| Filename | modeM0/AS1T03_183T01_9000003606_24504cztM0_level2.evt | modeM0/AS1T03_183T01_9000003606_24504cztM0_level2_quad_clean.evt |
| Size (bytes) | 483,647,040 | 142,335,360 |
| Size | 461.2 MB | 135.7 MB |
| Events in quadrant A | 3,376,596 | 999,140 |
| Events in quadrant B | 3,938,416 | 999,216 |
| Events in quadrant C | 3,282,787 | 941,483 |
| Events in quadrant D | 3,618,496 | 928,490 |
| Mode M0 | |||
|---|---|---|---|
| Quadrant | BADHDUFLAG | Total packets | Discarded packets |
| A | 0 | 14194 | 1 |
| B | 0 | 15909 | 1 |
| C | 0 | 13948 | 1 |
| D | 0 | 15107 | 2 |
| Mode SS | |||
|---|---|---|---|
| Quadrant | BADHDUFLAG | Total packets | Discarded packets |
| A | 0 | 128 | 0 |
| B | 0 | 128 | 0 |
| C | 0 | 128 | 0 |
| D | 0 | 128 | 0 |
| Mode M9 | |||
|---|---|---|---|
| Quadrant | BADHDUFLAG | Total packets | Discarded packets |
| A | 0 | 13 | 0 |
| B | 0 | 13 | 0 |
| C | 0 | 13 | 0 |
| D | 0 | 13 | 0 |
| Quadrant | Total seconds | Saturated seconds | Saturation percentage |
|---|---|---|---|
| A | 6352 | 80 | 1.259446% |
| B | 6353 | 242 | 3.809224% |
| C | 6353 | 110 | 1.731465% |
| D | 6352 | 103 | 1.621537% |
Noise dominated data is calculated using 1-second bins in cleaned event files. If a bin has >2000 counts, and if more than 50% of those come from <1% of pixels, then it is considered to be noise-dominated and hence unusable.
| Quadrant | # 1 sec bins | Bins with >0 counts | Bins with >2000 counts | High rate bins dominated by noise | Noise dominated (total time) | Noise dominated (detector-on time) | Marked lightcurve |
|---|---|---|---|---|---|---|---|
| A | 7607 | 6353 | 0 | 0 | 0.00% | 0.00% | 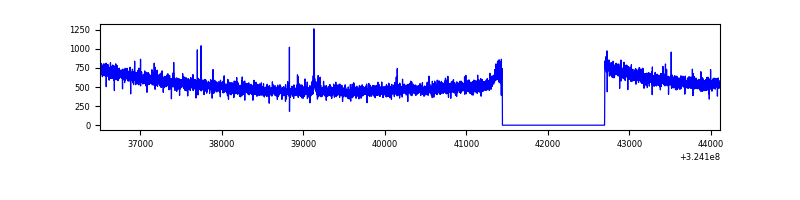 |
| B | 7608 | 6354 | 84 | 84 | 1.10% | 1.32% | 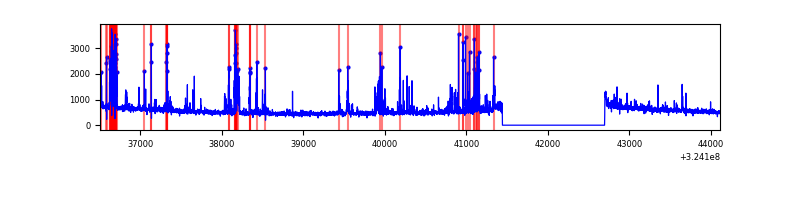 |
| C | 7608 | 6354 | 0 | 0 | 0.00% | 0.00% | 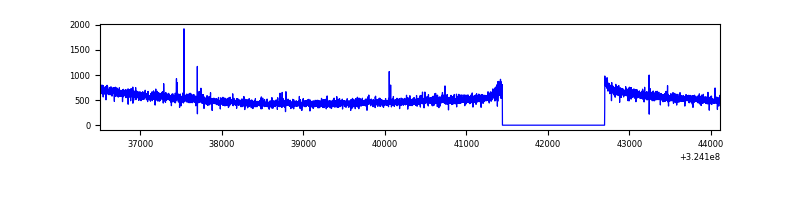 |
| D | 7607 | 6353 | 38 | 38 | 0.50% | 0.60% | 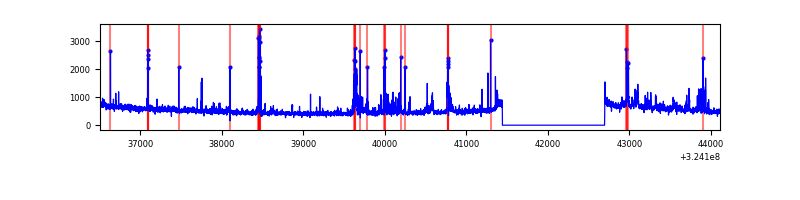 |
Top three noisy pixels from each quadrant. If the there are fewer than three noisy pixels in the level2.evt file, extra rows are filled as -1
| Pixel properties | Quadrant properties | ||||||
|---|---|---|---|---|---|---|---|
| Quadrant | DetID | PixID | Counts | Sigma | Mean | Median | Sigma |
| A | 14 | 111 | 43703 | 251.44 | 862 | 847 | 170.4 |
| A | 4 | 2 | 11449 | 62.2 | 862 | 847 | 170.4 |
| A | 13 | 254 | 10438 | 56.27 | 862 | 847 | 170.4 |
| B | 3 | 64 | 604555 | 3925.1 | 843 | 828 | 153.8 |
| B | 12 | 111 | 17371 | 107.55 | 843 | 828 | 153.8 |
| B | 11 | 111 | 15659 | 96.42 | 843 | 828 | 153.8 |
| C | 14 | 238 | 132832 | 723.77 | 802 | 809 | 182.4 |
| C | 2 | 16 | 15450 | 80.26 | 802 | 809 | 182.4 |
| C | 13 | 61 | 5668 | 26.64 | 802 | 809 | 182.4 |
| D | 9 | 1 | 301243 | 1547.51 | 817 | 796 | 194.1 |
| D | 1 | 52 | 114261 | 584.42 | 817 | 796 | 194.1 |
| D | 12 | 238 | 45132 | 228.36 | 817 | 796 | 194.1 |
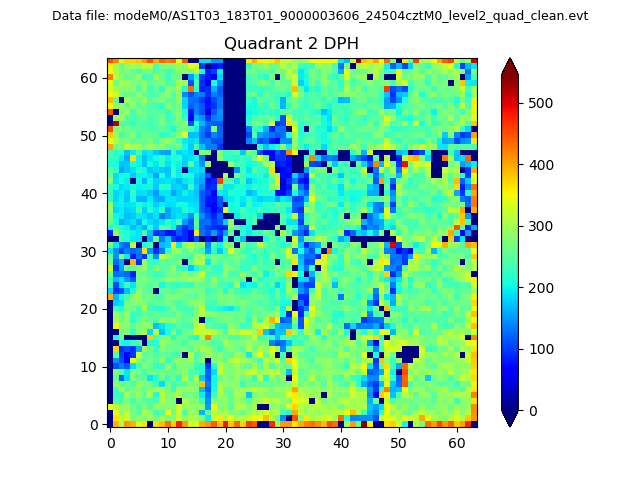
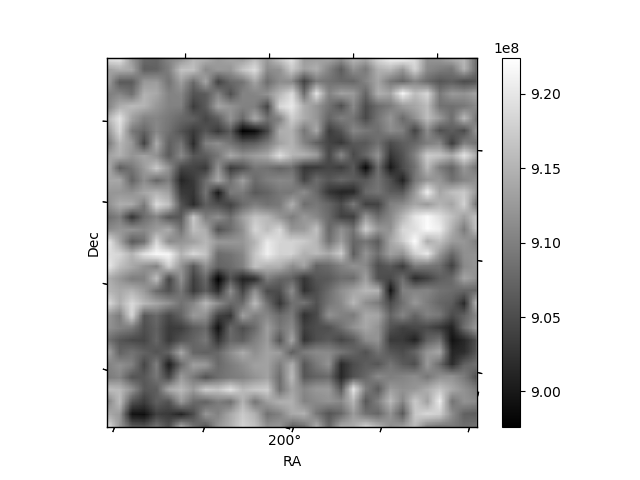
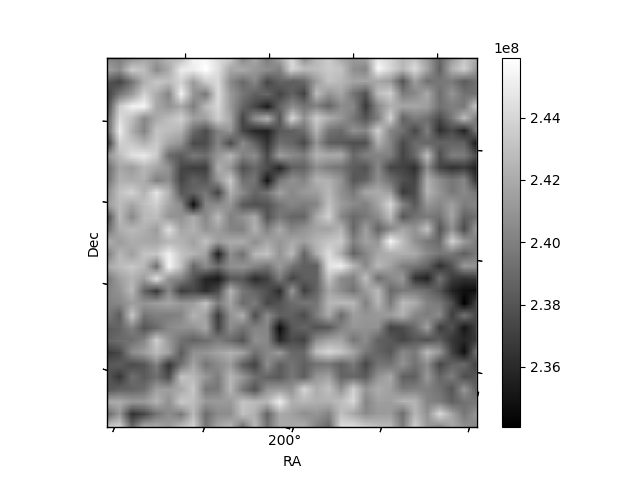
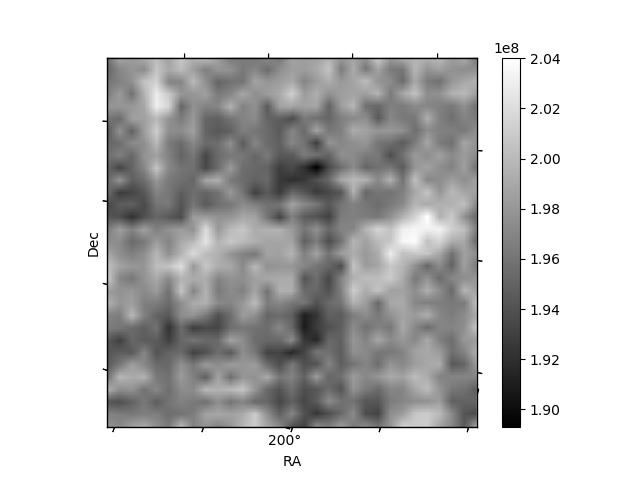
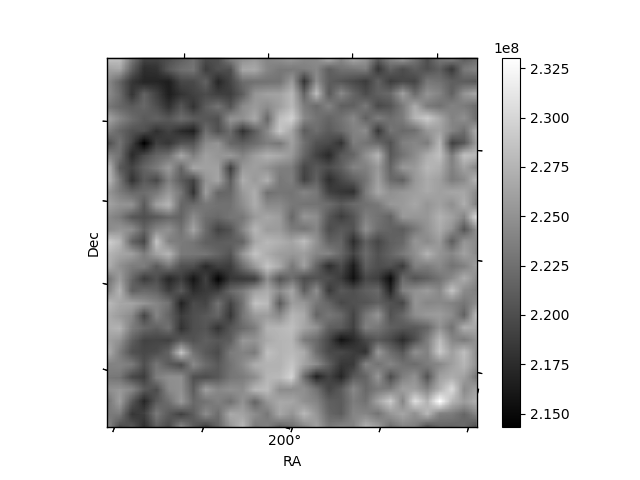
Histogram calculated using DETX and DETY for each event in the final _common_clean file
| Quadrant A | 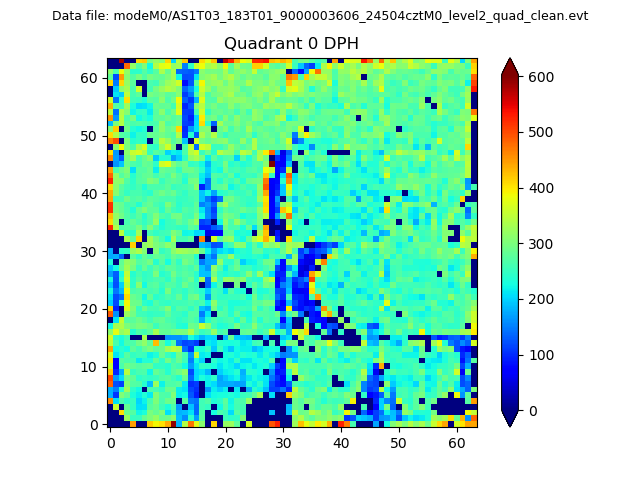 |
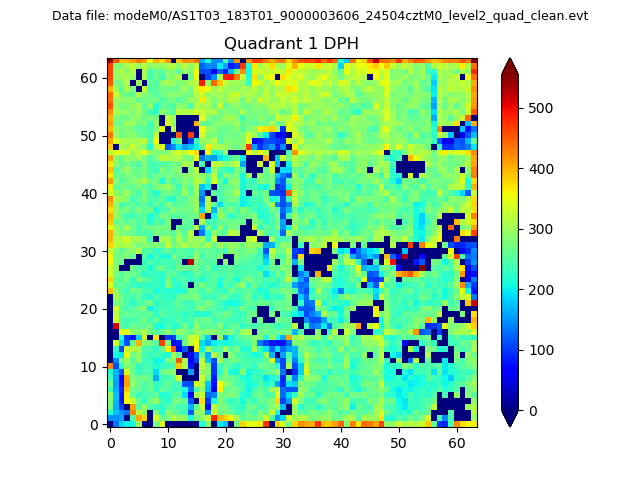 |
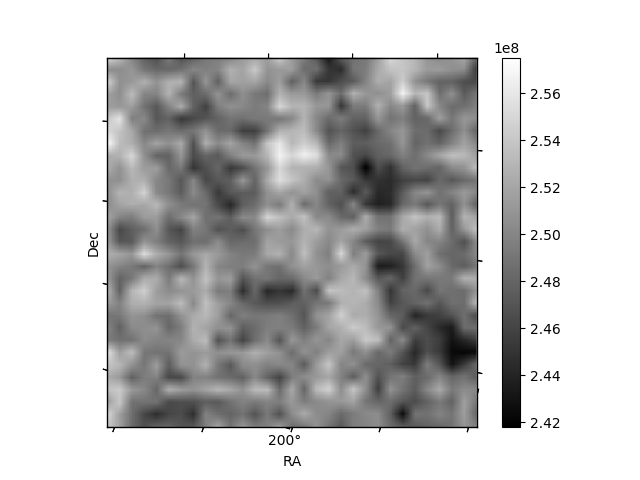
Quadrant B |
|---|---|---|---|
| Quadrant D | 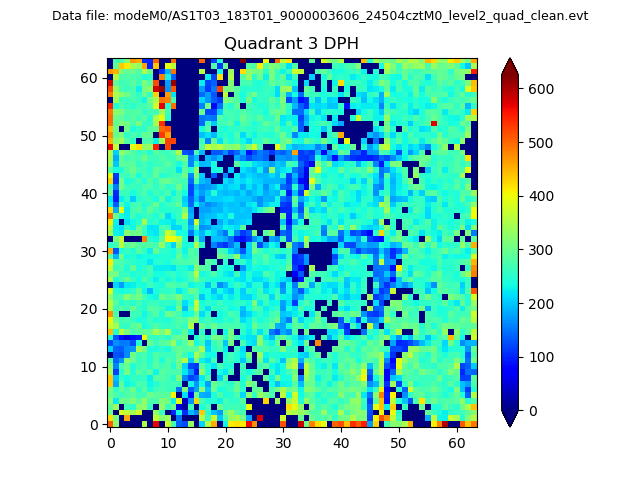 |
 |
Quadrant C |
| Plot type | Count rate plots | Images |
|---|---|---|
| Comparison with Poisson distribution Blue bars denote a histogram of data divided into 1 sec bins. Red curve is a Poisson curve with rate = median count rate of data. |
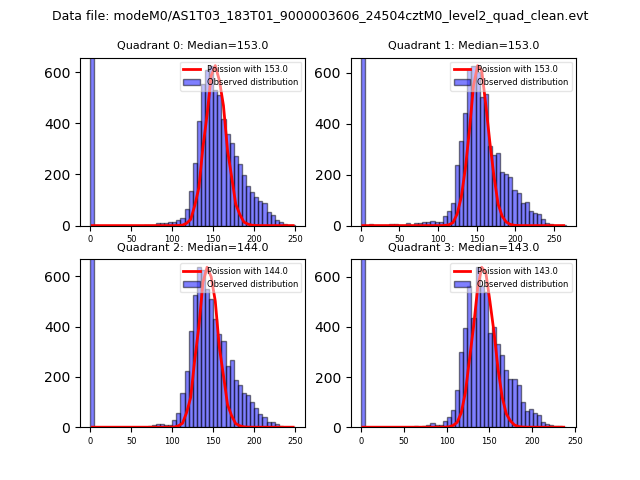 |
 |
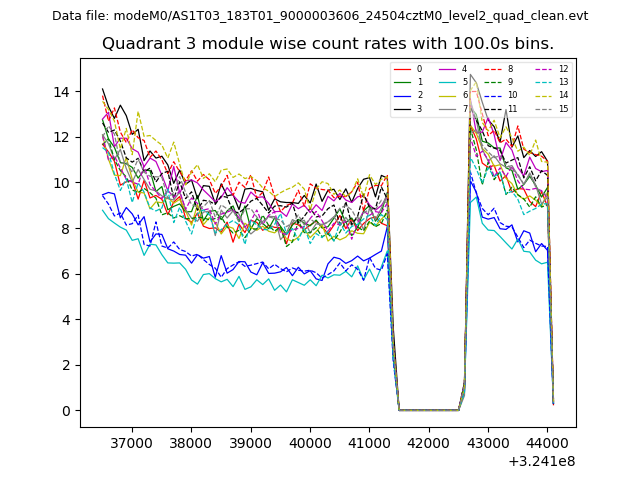
| Quadrant-wise count rates Data is divided into 100 sec bins |
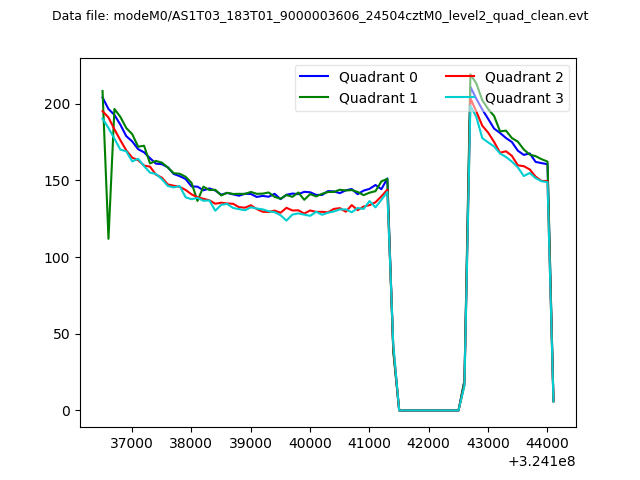 |
|
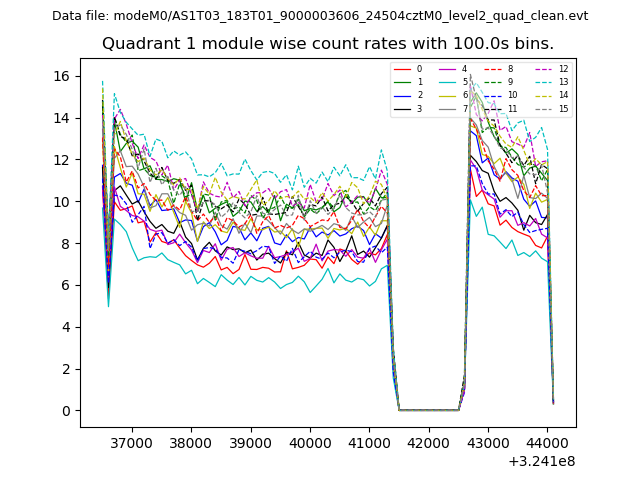
| Module-wise count rates for Quadrant A Data is divided into 100 sec bins |
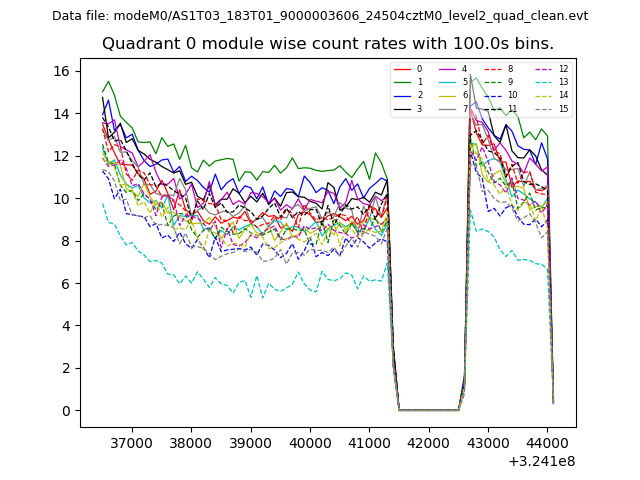 |
 |
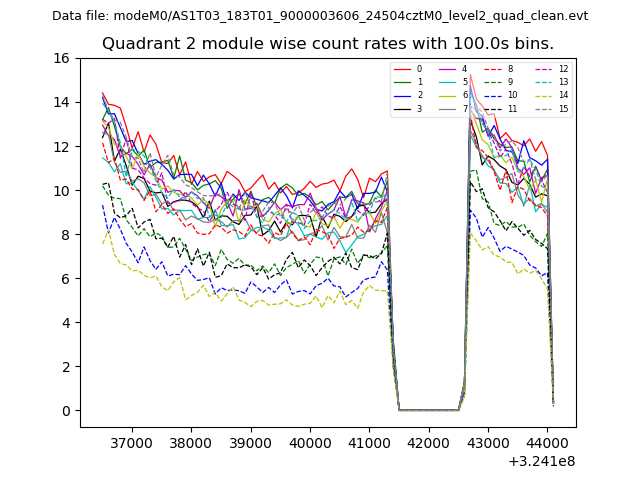
| Module-wise count rates for Quadrant B Data is divided into 100 sec bins |
 |
 |
| Module-wise count rates for Quadrant C Data is divided into 100 sec bins |
 |
 |
| Module-wise count rates for Quadrant D Data is divided into 100 sec bins |
 |
 |
| Parameter | Plot |
|---|---|
| CZT HV Monitor | 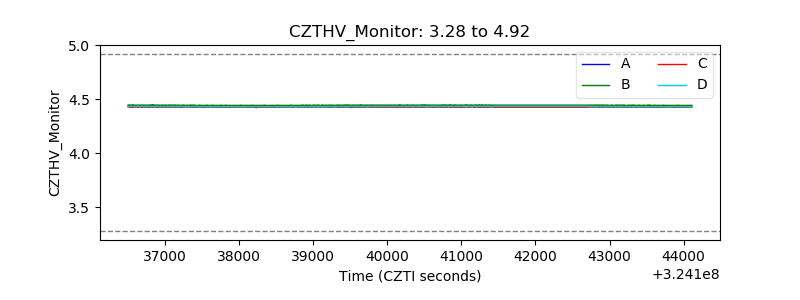 |
| D_VDD | 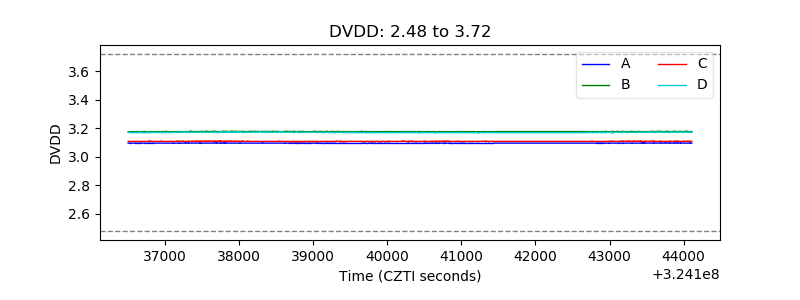 |
| Temperature 1 | 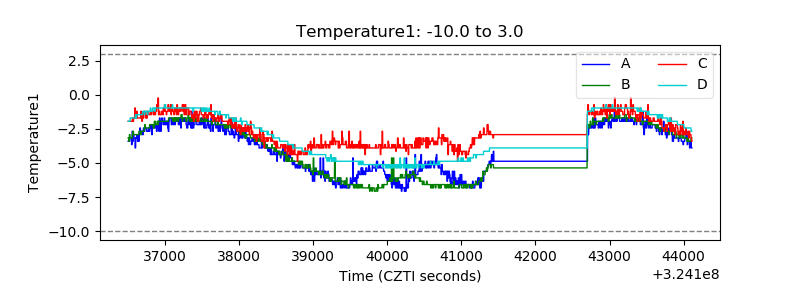 |
| Veto HV Monitor | 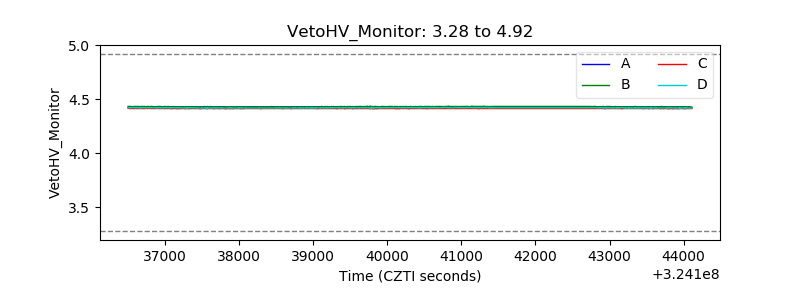 |
| Veto LLD | 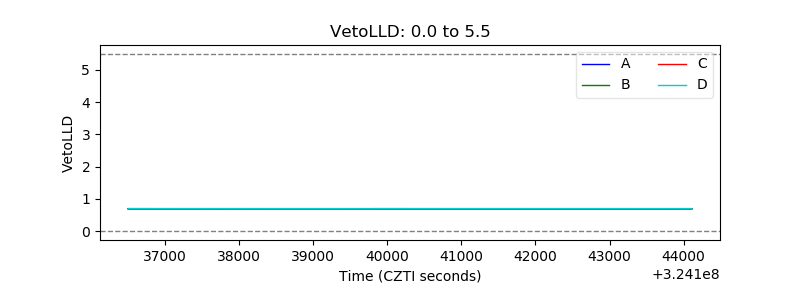 |
| Alpha Counter |  |
| _CPM_Rate |  |
| CZT Counter | 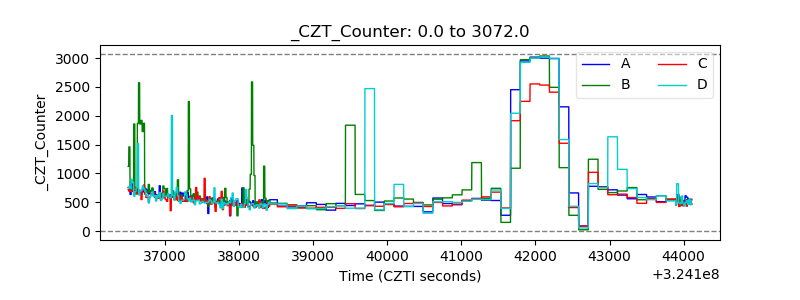 |
| +2.5 Volts monitor |  |
| +5 Volts monitor |  |
| _ROLL_ROT | 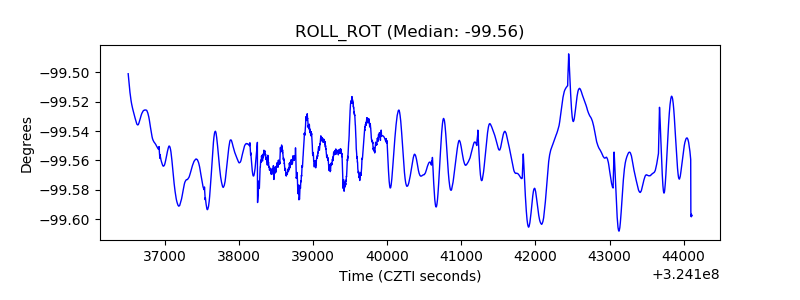 |
| _Roll_DEC | 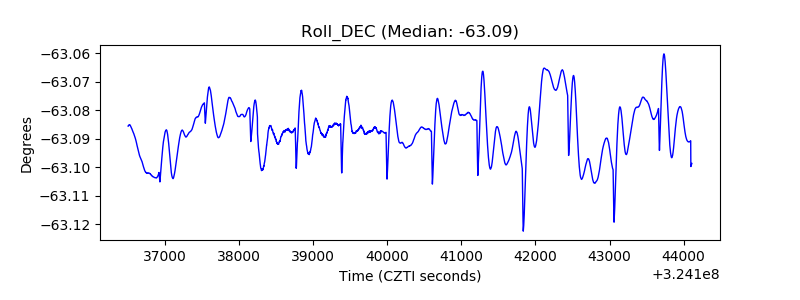 |
| _Roll_RA | 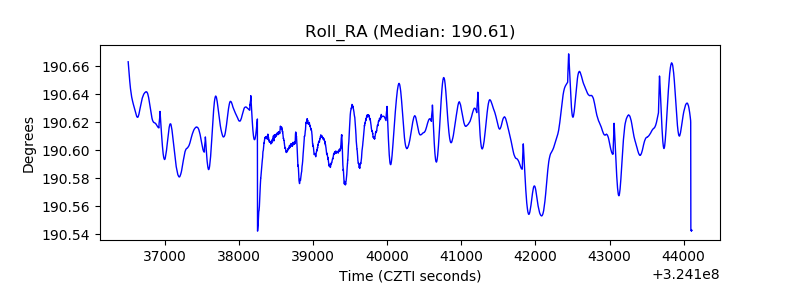 |
| Veto Counter | 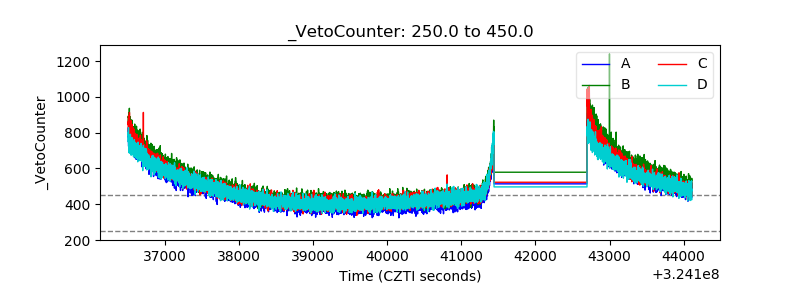 |