| Param | Original file | Final file |
|---|---|---|
| Filename | modeM0/AS1T03_183T01_9000003606_24505cztM0_level2.evt | modeM0/AS1T03_183T01_9000003606_24505cztM0_level2_quad_clean.evt |
| Size (bytes) | 494,521,920 | 139,599,360 |
| Size | 471.6 MB | 133.1 MB |
| Events in quadrant A | 3,471,930 | 982,875 |
| Events in quadrant B | 4,101,309 | 978,710 |
| Events in quadrant C | 3,296,034 | 919,945 |
| Events in quadrant D | 3,674,089 | 901,408 |
| Mode M0 | |||
|---|---|---|---|
| Quadrant | BADHDUFLAG | Total packets | Discarded packets |
| A | 0 | 14316 | 2 |
| B | 0 | 16392 | 2 |
| C | 0 | 13873 | 2 |
| D | 0 | 15354 | 2 |
| Mode SS | |||
|---|---|---|---|
| Quadrant | BADHDUFLAG | Total packets | Discarded packets |
| A | 0 | 130 | 0 |
| B | 0 | 130 | 0 |
| C | 0 | 130 | 0 |
| D | 0 | 130 | 0 |
| Mode M9 | |||
|---|---|---|---|
| Quadrant | BADHDUFLAG | Total packets | Discarded packets |
| A | 0 | 13 | 0 |
| B | 0 | 13 | 0 |
| C | 0 | 13 | 0 |
| D | 0 | 13 | 0 |
| Quadrant | Total seconds | Saturated seconds | Saturation percentage |
|---|---|---|---|
| A | 6383 | 69 | 1.080996% |
| B | 6384 | 330 | 5.169173% |
| C | 6383 | 89 | 1.394329% |
| D | 6383 | 61 | 0.955663% |
Noise dominated data is calculated using 1-second bins in cleaned event files. If a bin has >2000 counts, and if more than 50% of those come from <1% of pixels, then it is considered to be noise-dominated and hence unusable.
| Quadrant | # 1 sec bins | Bins with >0 counts | Bins with >2000 counts | High rate bins dominated by noise | Noise dominated (total time) | Noise dominated (detector-on time) | Marked lightcurve |
|---|---|---|---|---|---|---|---|
| A | 7713 | 6385 | 0 | 0 | 0.00% | 0.00% | 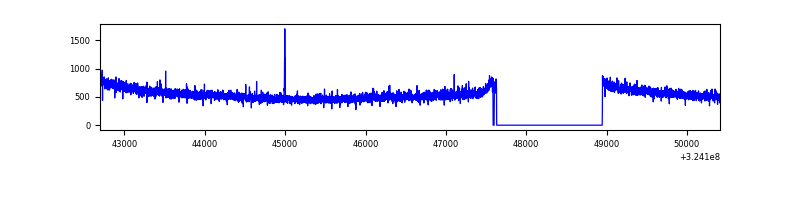 |
| B | 7714 | 6386 | 169 | 169 | 2.19% | 2.65% | 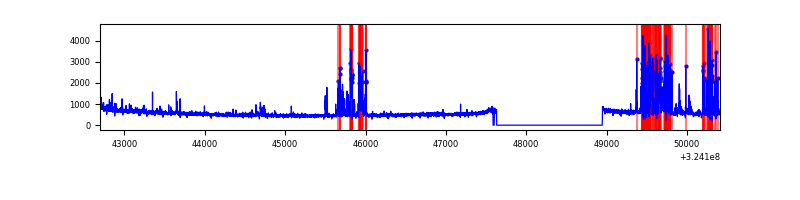 |
| C | 7713 | 6385 | 2 | 2 | 0.03% | 0.03% | 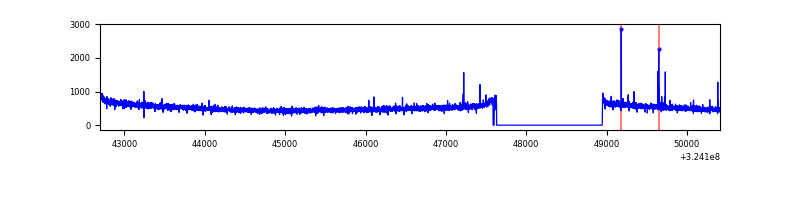 |
| D | 7713 | 6385 | 8 | 8 | 0.10% | 0.13% | 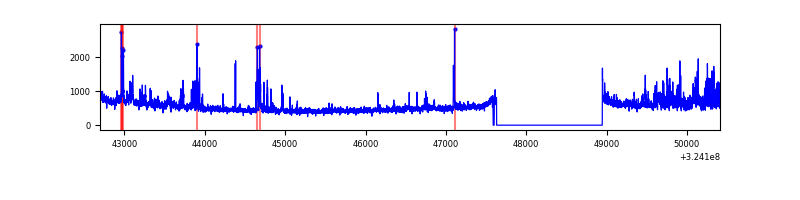 |
Top three noisy pixels from each quadrant. If the there are fewer than three noisy pixels in the level2.evt file, extra rows are filled as -1
| Pixel properties | Quadrant properties | ||||||
|---|---|---|---|---|---|---|---|
| Quadrant | DetID | PixID | Counts | Sigma | Mean | Median | Sigma |
| A | 14 | 111 | 136520 | 793.52 | 862 | 846 | 171.0 |
| A | 4 | 2 | 13006 | 71.12 | 862 | 846 | 171.0 |
| A | 13 | 254 | 10686 | 57.55 | 862 | 846 | 171.0 |
| B | 3 | 64 | 783782 | 5041.35 | 844 | 828 | 155.3 |
| B | 12 | 111 | 17530 | 107.54 | 844 | 828 | 155.3 |
| B | 11 | 111 | 15343 | 93.46 | 844 | 828 | 155.3 |
| C | 14 | 238 | 133024 | 718.51 | 804 | 809 | 184.0 |
| C | 2 | 16 | 24004 | 126.05 | 804 | 809 | 184.0 |
| C | 13 | 61 | 5673 | 26.43 | 804 | 809 | 184.0 |
| D | 8 | 195 | 229391 | 1163.02 | 815 | 791 | 196.6 |
| D | 9 | 1 | 187443 | 949.6 | 815 | 791 | 196.6 |
| D | 1 | 52 | 155471 | 786.94 | 815 | 791 | 196.6 |
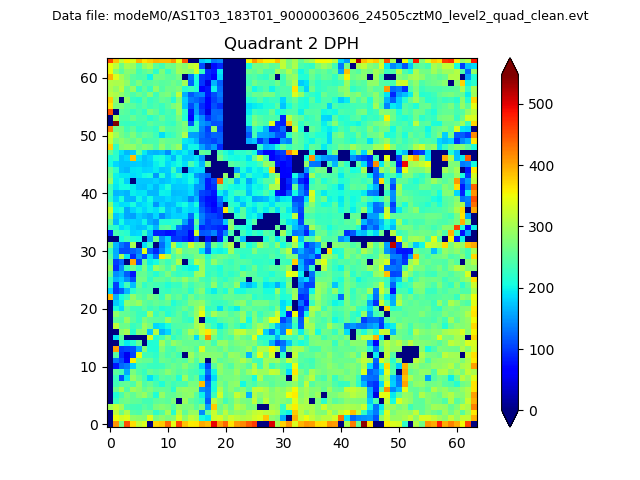
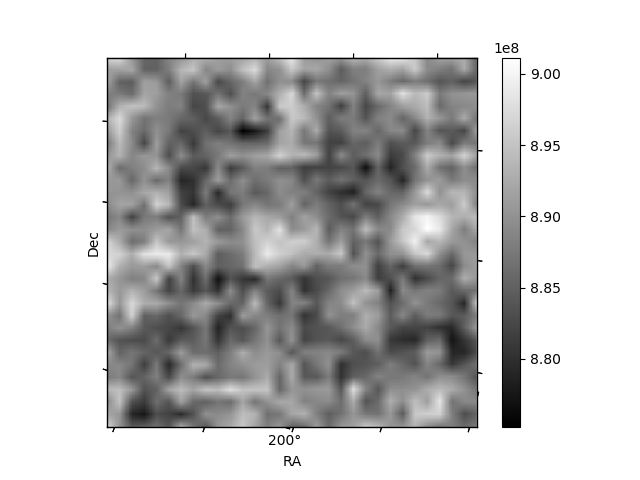
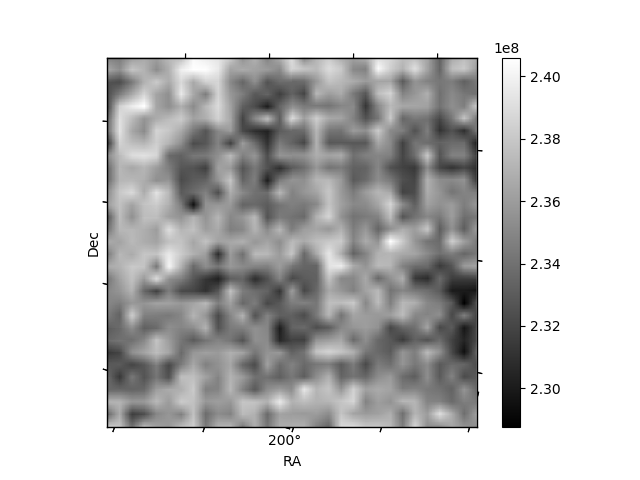
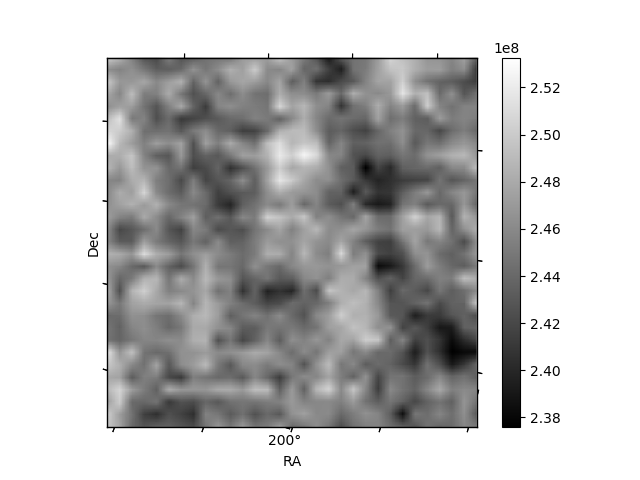
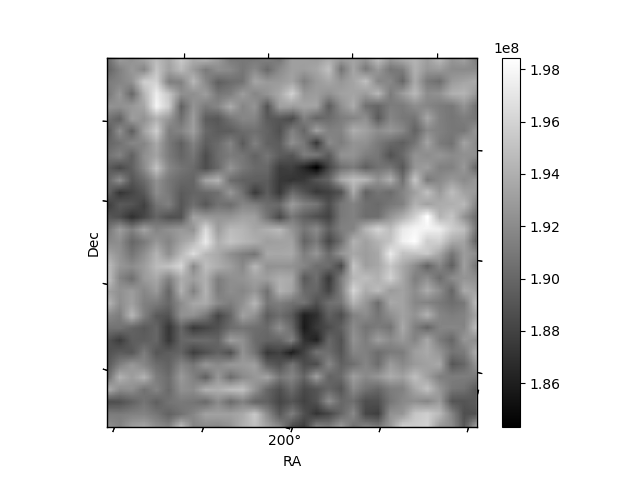
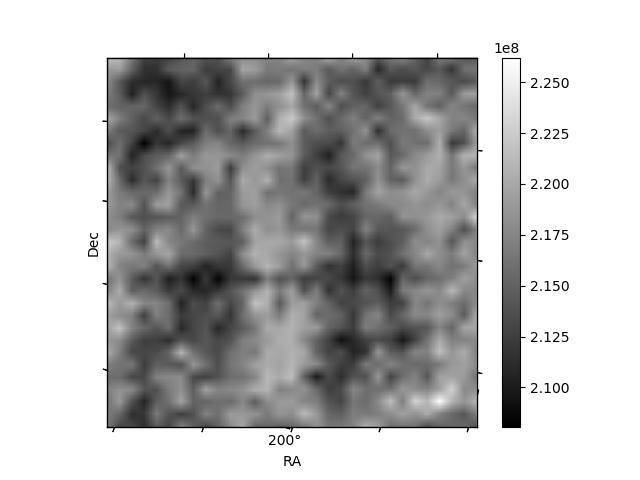
Histogram calculated using DETX and DETY for each event in the final _common_clean file
| Quadrant A | 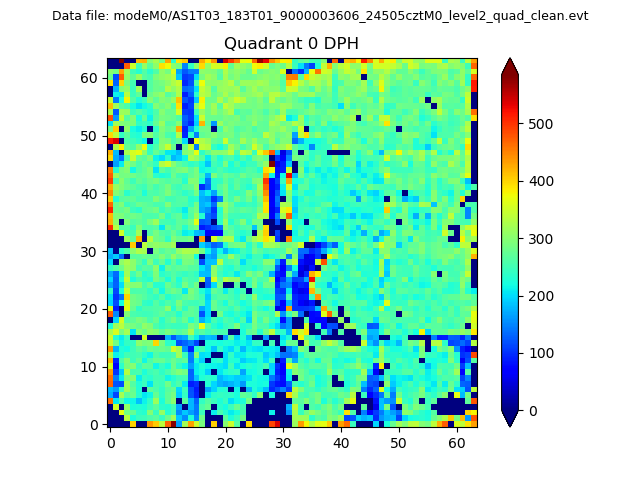 |
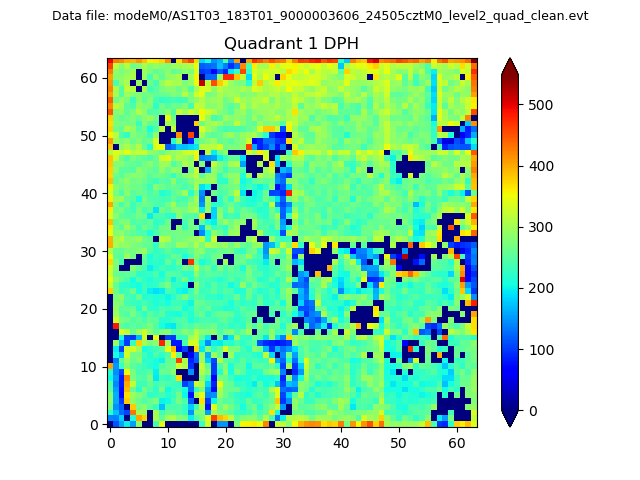 |
Quadrant B |
|---|---|---|---|
| Quadrant D | 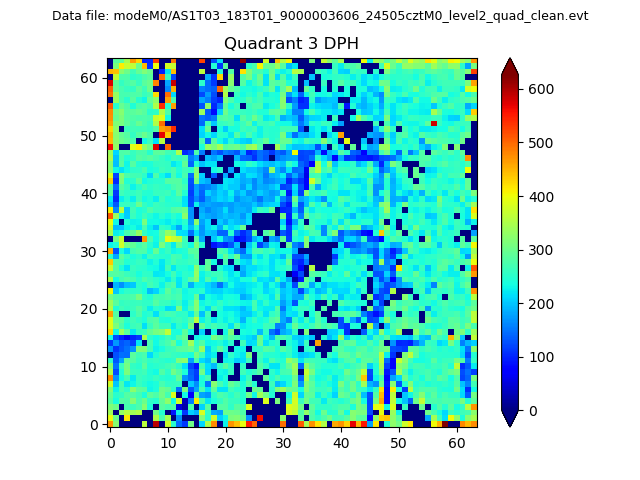 |
 |
Quadrant C |
| Plot type | Count rate plots | Images |
|---|---|---|
| Comparison with Poisson distribution Blue bars denote a histogram of data divided into 1 sec bins. Red curve is a Poisson curve with rate = median count rate of data. |
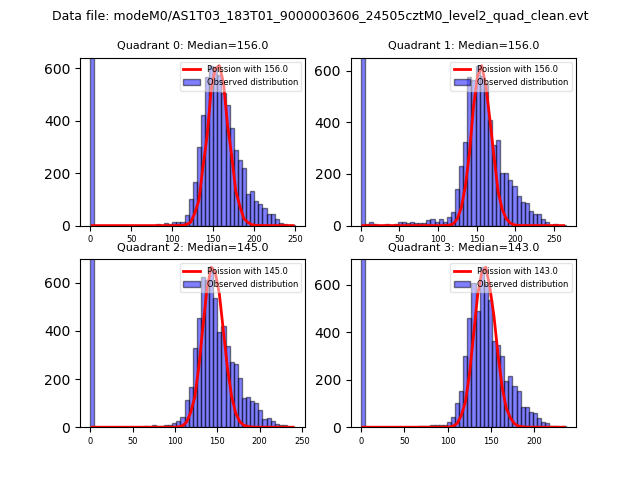 |
 |
| Quadrant-wise count rates Data is divided into 100 sec bins |
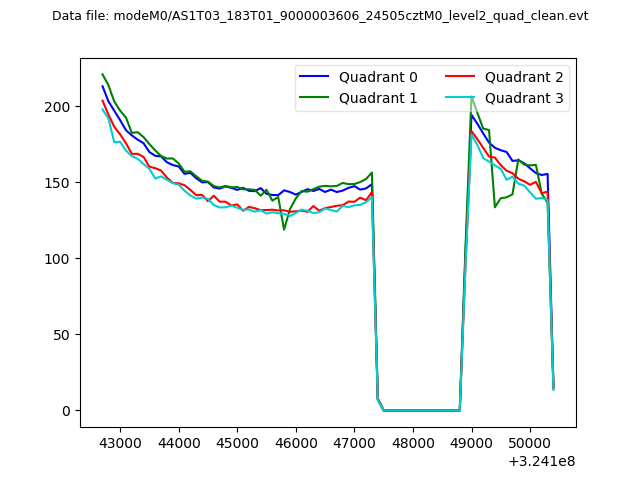 |
|
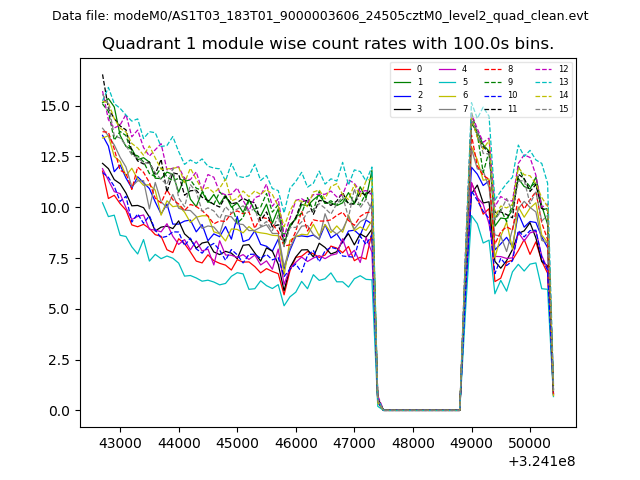
| Module-wise count rates for Quadrant A Data is divided into 100 sec bins |
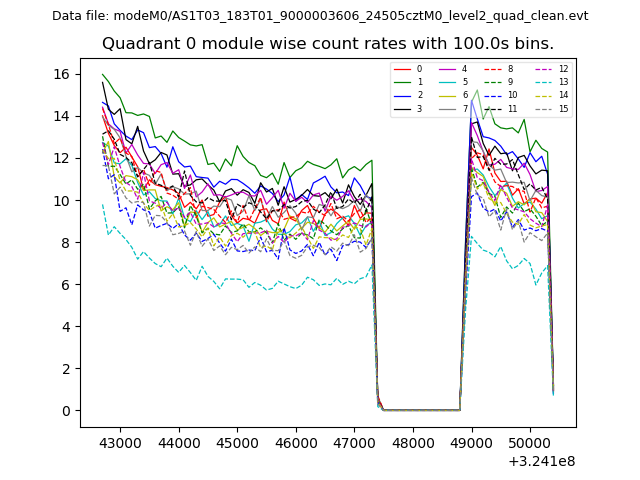 |
 |
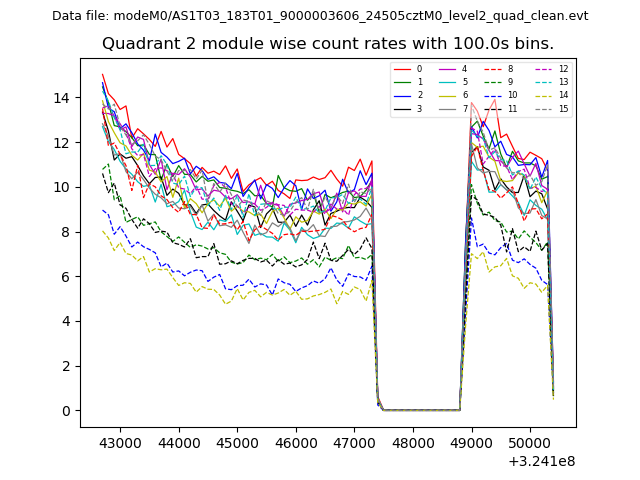
| Module-wise count rates for Quadrant B Data is divided into 100 sec bins |
 |
 |
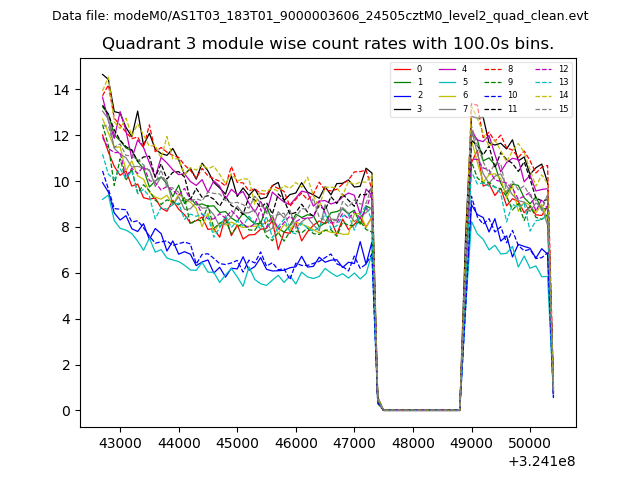
| Module-wise count rates for Quadrant C Data is divided into 100 sec bins |
 |
 |
| Module-wise count rates for Quadrant D Data is divided into 100 sec bins |
 |
 |
| Parameter | Plot |
|---|---|
| CZT HV Monitor | 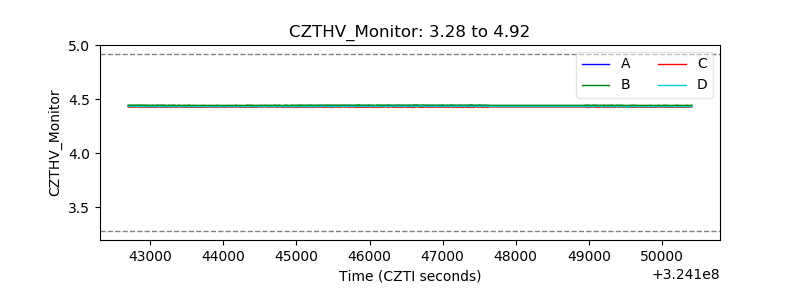 |
| D_VDD | 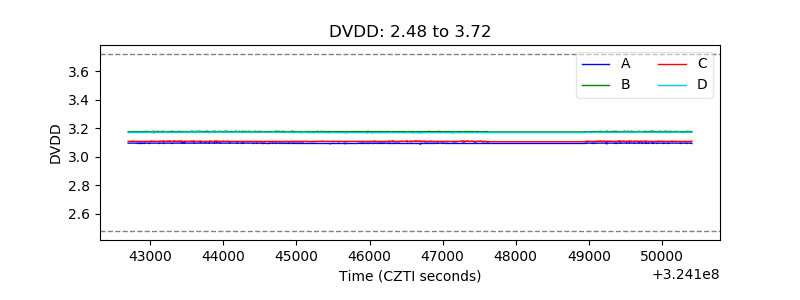 |
| Temperature 1 | 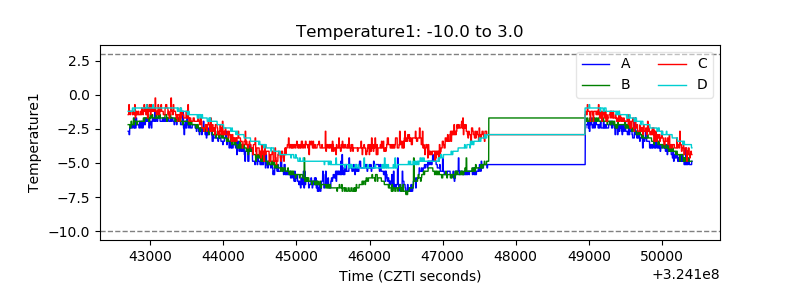 |
| Veto HV Monitor | 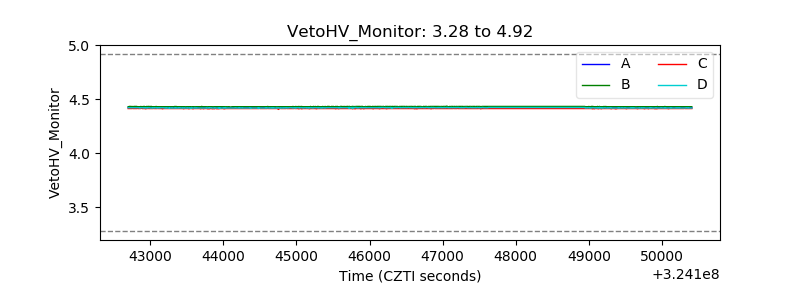 |
| Veto LLD | 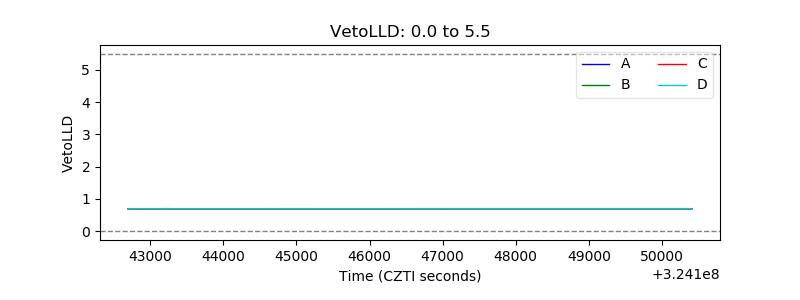 |
| Alpha Counter | 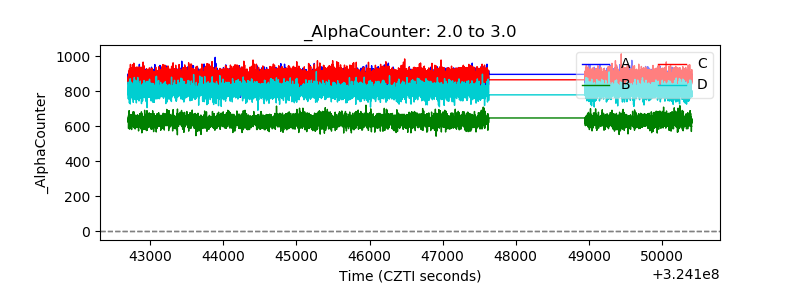 |
| _CPM_Rate | 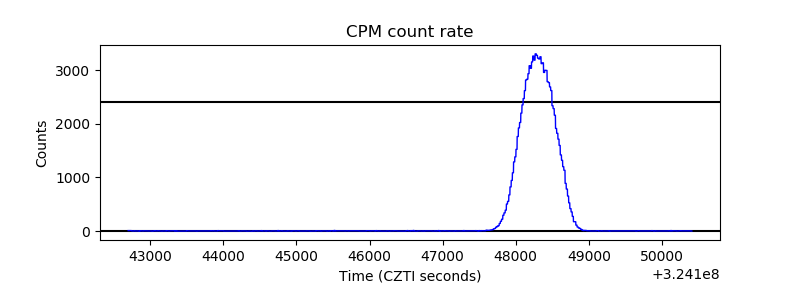 |
| CZT Counter | 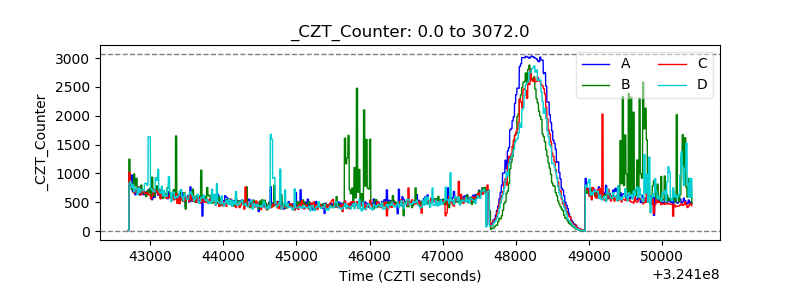 |
| +2.5 Volts monitor |  |
| +5 Volts monitor |  |
| _ROLL_ROT | 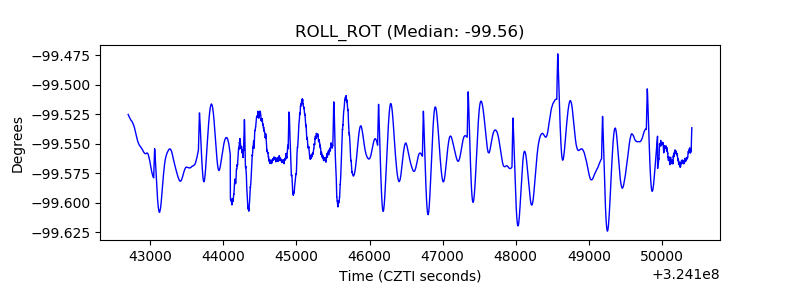 |
| _Roll_DEC | 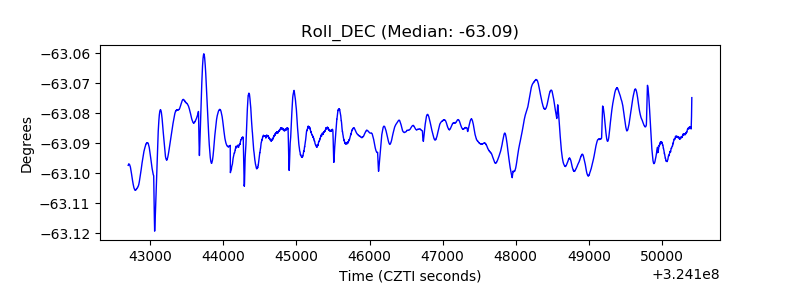 |
| _Roll_RA | 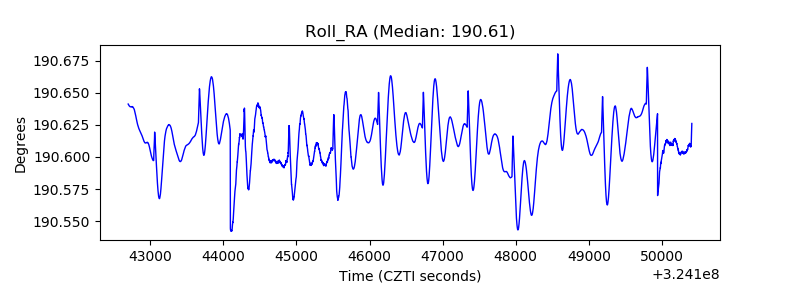 |
| Veto Counter | 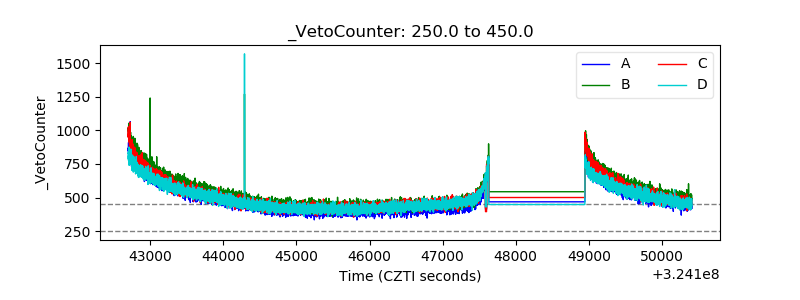 |