| Param | Original file | Final file |
|---|---|---|
| Filename | modeM0/AS1T03_183T01_9000003606_24506cztM0_level2.evt | modeM0/AS1T03_183T01_9000003606_24506cztM0_level2_quad_clean.evt |
| Size (bytes) | 533,666,880 | 123,531,840 |
| Size | 508.9 MB | 117.8 MB |
| Events in quadrant A | 3,955,936 | 844,908 |
| Events in quadrant B | 3,883,208 | 870,741 |
| Events in quadrant C | 3,288,256 | 812,655 |
| Events in quadrant D | 4,612,338 | 778,077 |
| Mode M0 | |||
|---|---|---|---|
| Quadrant | BADHDUFLAG | Total packets | Discarded packets |
| A | 0 | 15751 | 3 |
| B | 0 | 15656 | 2 |
| C | 0 | 13668 | 2 |
| D | 0 | 17967 | 2 |
| Mode SS | |||
|---|---|---|---|
| Quadrant | BADHDUFLAG | Total packets | Discarded packets |
| A | 0 | 128 | 0 |
| B | 0 | 128 | 0 |
| C | 0 | 128 | 0 |
| D | 0 | 128 | 0 |
| Mode M9 | |||
|---|---|---|---|
| Quadrant | BADHDUFLAG | Total packets | Discarded packets |
| A | 0 | 13 | 0 |
| B | 0 | 14 | 0 |
| C | 0 | 14 | 0 |
| D | 0 | 14 | 0 |
| Quadrant | Total seconds | Saturated seconds | Saturation percentage |
|---|---|---|---|
| A | 6226 | 314 | 5.043367% |
| B | 6226 | 289 | 4.641825% |
| C | 6226 | 103 | 1.654353% |
| D | 6226 | 243 | 3.902987% |
Noise dominated data is calculated using 1-second bins in cleaned event files. If a bin has >2000 counts, and if more than 50% of those come from <1% of pixels, then it is considered to be noise-dominated and hence unusable.
| Quadrant | # 1 sec bins | Bins with >0 counts | Bins with >2000 counts | High rate bins dominated by noise | Noise dominated (total time) | Noise dominated (detector-on time) | Marked lightcurve |
|---|---|---|---|---|---|---|---|
| A | 7551 | 6227 | 176 | 176 | 2.33% | 2.83% | 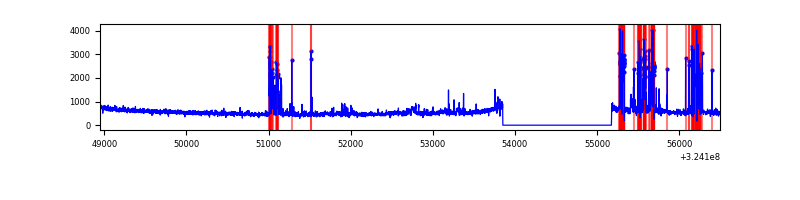 |
| B | 7551 | 6227 | 145 | 145 | 1.92% | 2.33% | 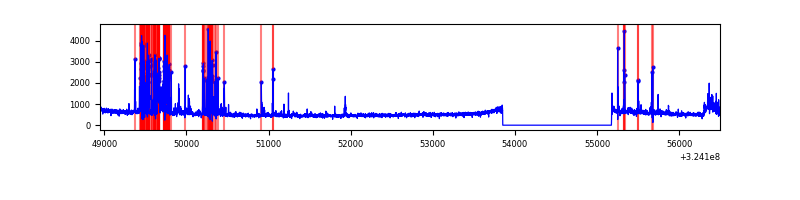 |
| C | 7551 | 6227 | 28 | 28 | 0.37% | 0.45% | 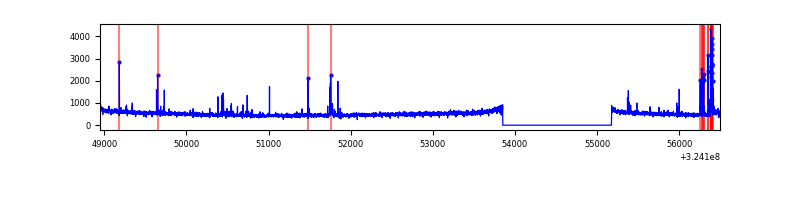 |
| D | 7550 | 6226 | 153 | 153 | 2.03% | 2.46% | 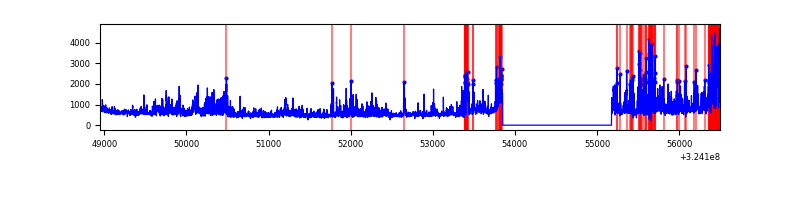 |
Top three noisy pixels from each quadrant. If the there are fewer than three noisy pixels in the level2.evt file, extra rows are filled as -1
| Pixel properties | Quadrant properties | ||||||
|---|---|---|---|---|---|---|---|
| Quadrant | DetID | PixID | Counts | Sigma | Mean | Median | Sigma |
| A | 14 | 111 | 882524 | 5567.94 | 797 | 786 | 158.4 |
| A | 13 | 254 | 9862 | 57.31 | 797 | 786 | 158.4 |
| A | 0 | 226 | 6764 | 37.75 | 797 | 786 | 158.4 |
| B | 3 | 64 | 742644 | 5034.75 | 803 | 787 | 147.3 |
| B | 12 | 111 | 16981 | 109.9 | 803 | 787 | 147.3 |
| B | 11 | 111 | 14665 | 94.19 | 803 | 787 | 147.3 |
| C | 2 | 16 | 183636 | 1043.22 | 763 | 768 | 175.3 |
| C | 14 | 238 | 125354 | 710.73 | 763 | 768 | 175.3 |
| C | 13 | 61 | 5446 | 26.69 | 763 | 768 | 175.3 |
| D | 1 | 52 | 1010483 | 5498.22 | 757 | 733 | 183.7 |
| D | 8 | 195 | 549486 | 2988.03 | 757 | 733 | 183.7 |
| D | 9 | 1 | 141097 | 764.3 | 757 | 733 | 183.7 |
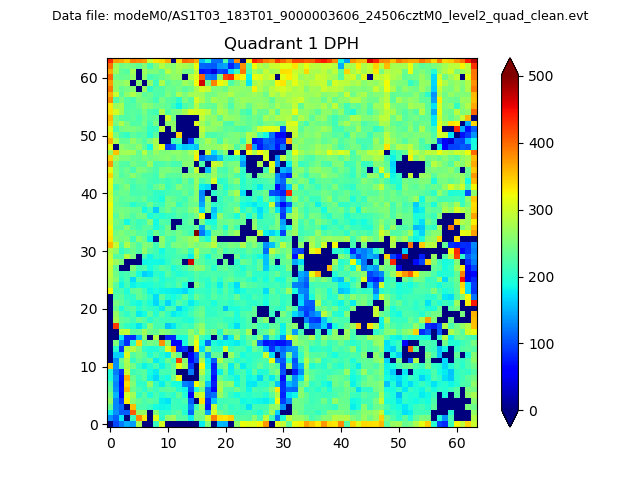
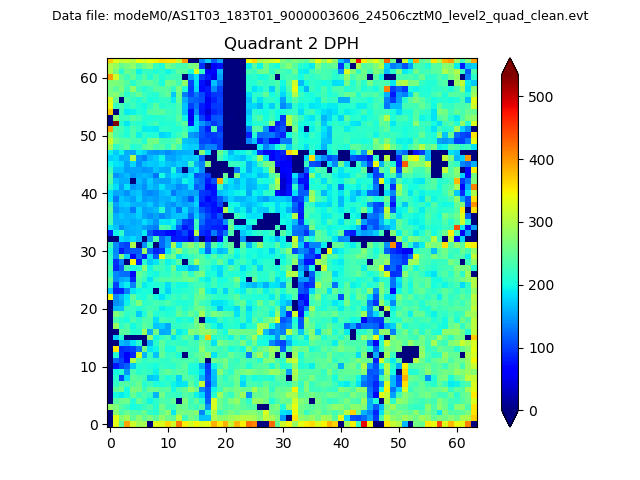
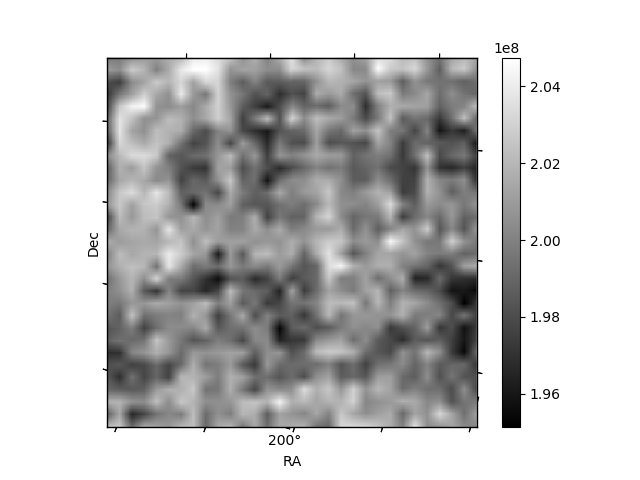
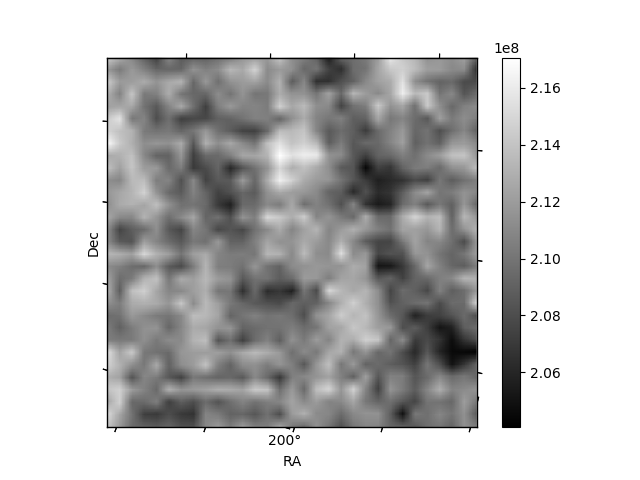
Histogram calculated using DETX and DETY for each event in the final _common_clean file
| Quadrant A |  |
 |
Quadrant B |
|---|---|---|---|
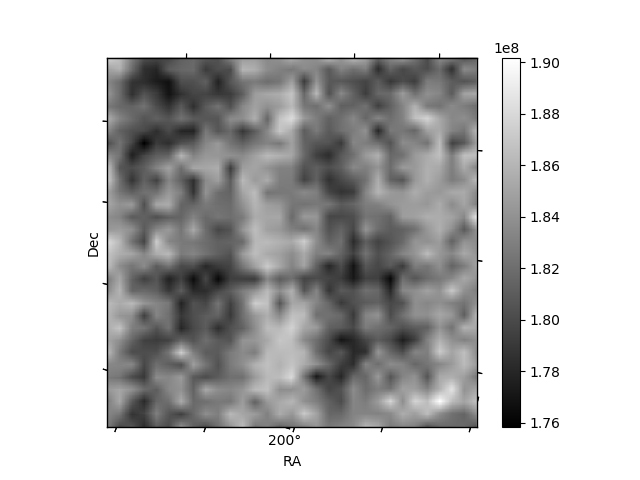
| Quadrant D |  |
 |
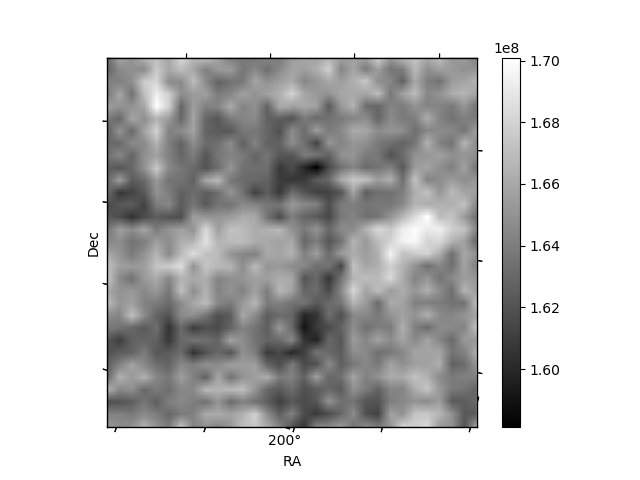
Quadrant C |
| Plot type | Count rate plots | Images |
|---|---|---|
| Comparison with Poisson distribution Blue bars denote a histogram of data divided into 1 sec bins. Red curve is a Poisson curve with rate = median count rate of data. |
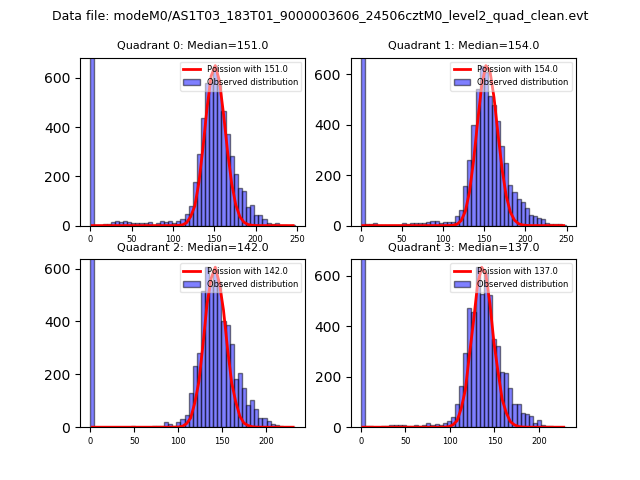 |
 |
| Quadrant-wise count rates Data is divided into 100 sec bins |
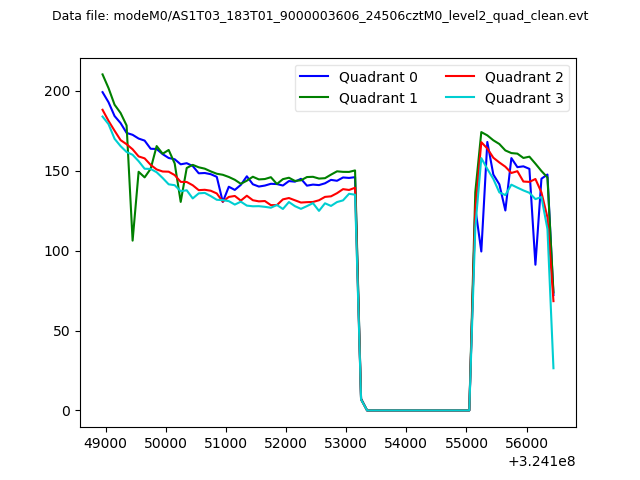 |
|
| Module-wise count rates for Quadrant A Data is divided into 100 sec bins |
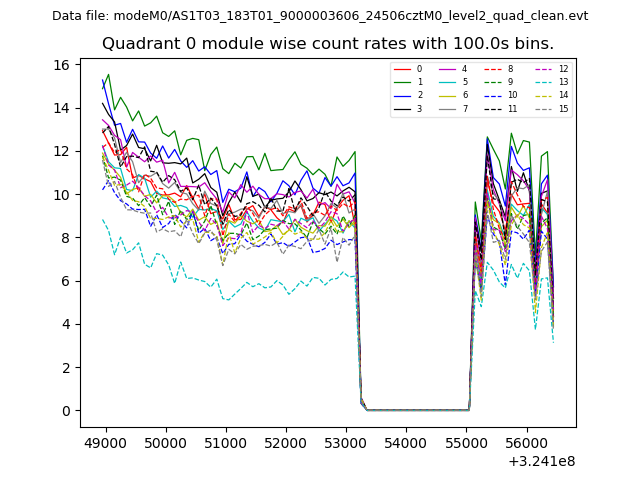 |
 |
| Module-wise count rates for Quadrant B Data is divided into 100 sec bins |
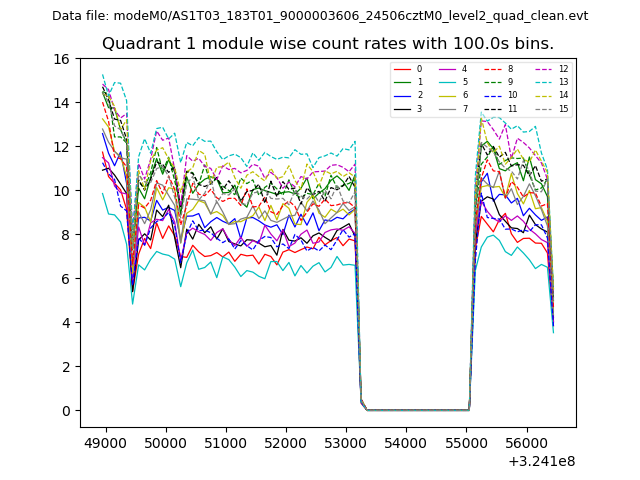 |
 |
| Module-wise count rates for Quadrant C Data is divided into 100 sec bins |
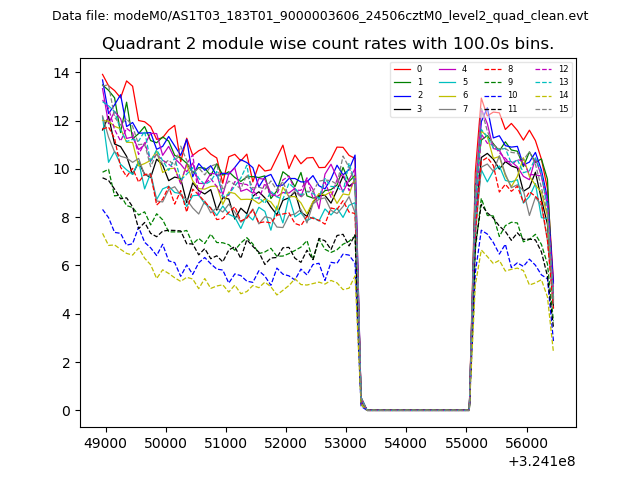 |
 |
| Module-wise count rates for Quadrant D Data is divided into 100 sec bins |
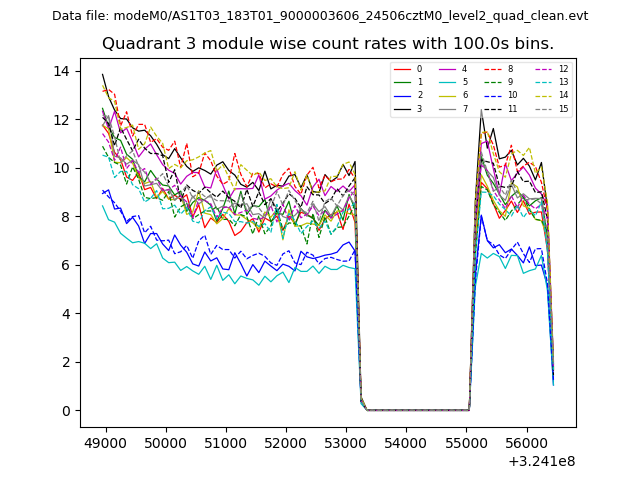 |
 |
| Parameter | Plot |
|---|---|
| CZT HV Monitor | 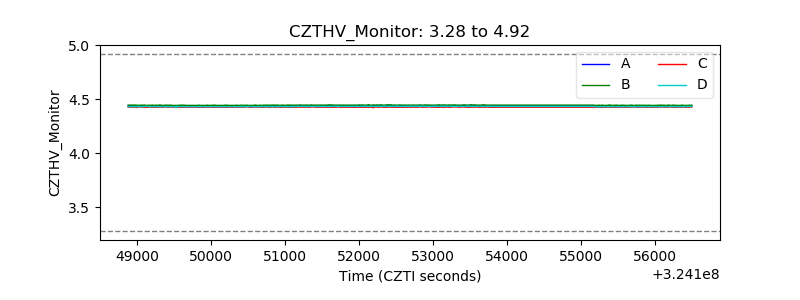 |
| D_VDD | 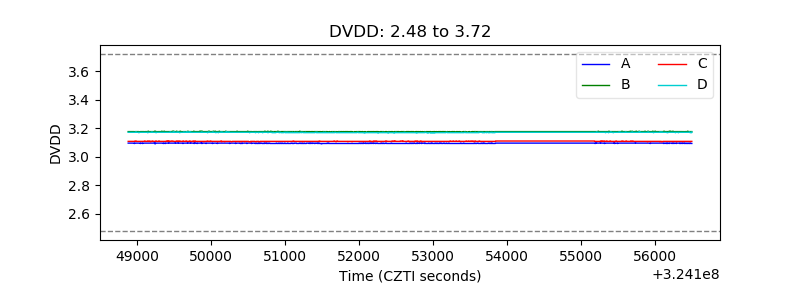 |
| Temperature 1 | 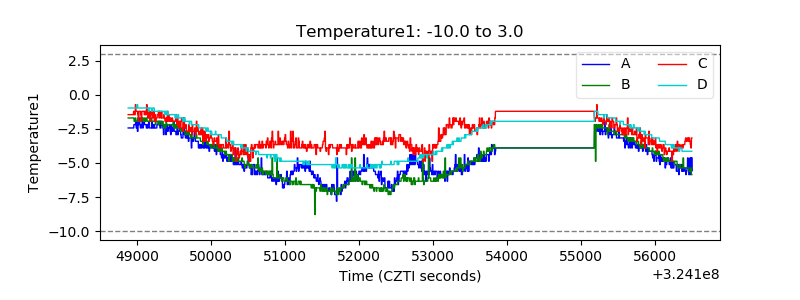 |
| Veto HV Monitor | 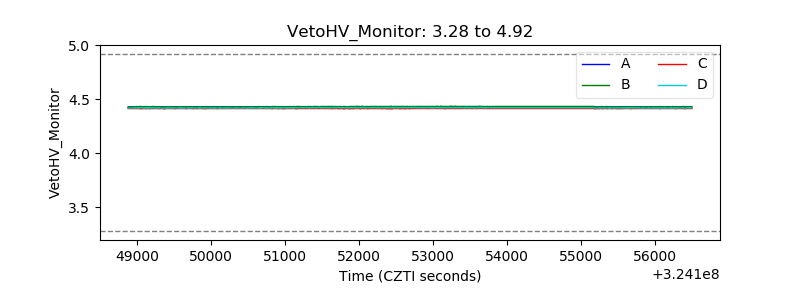 |
| Veto LLD | 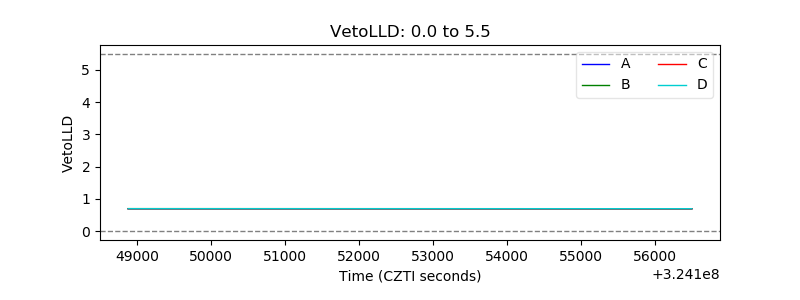 |
| Alpha Counter | 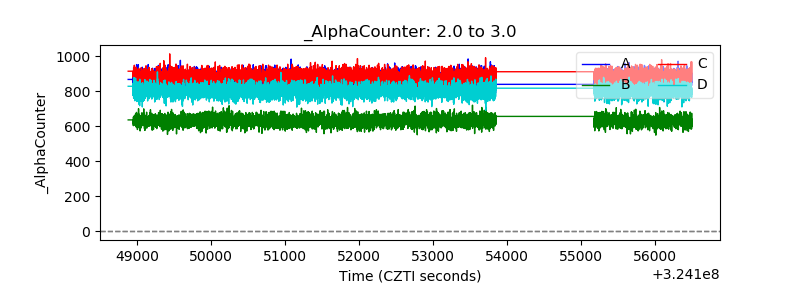 |
| _CPM_Rate | 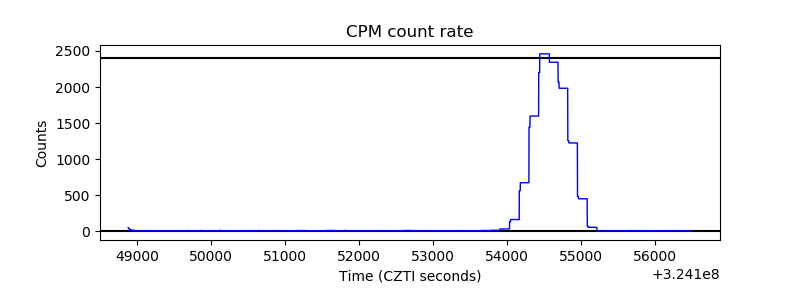 |
| CZT Counter |  |
| +2.5 Volts monitor |  |
| +5 Volts monitor | 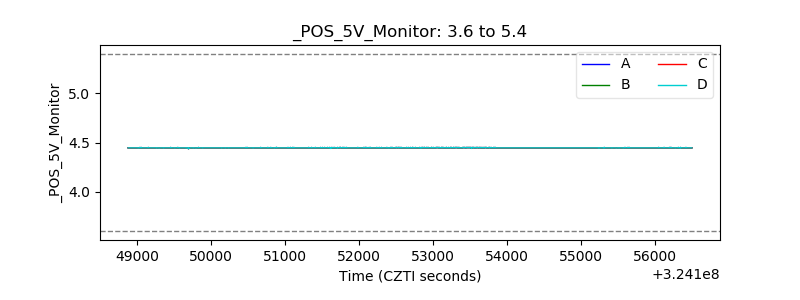 |
| _ROLL_ROT | 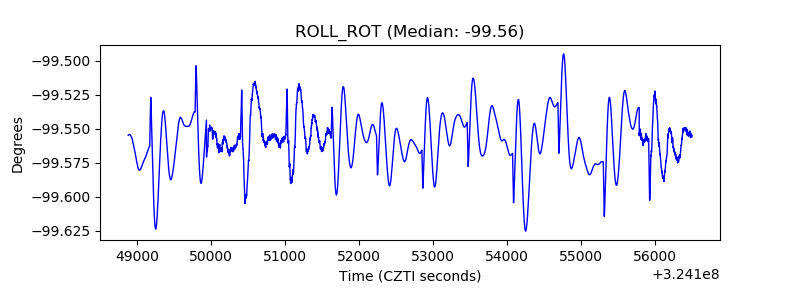 |
| _Roll_DEC | 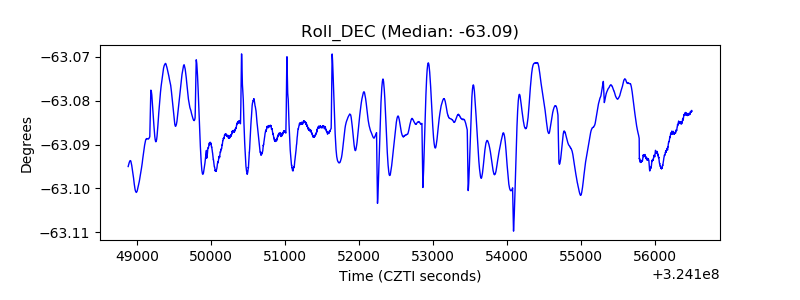 |
| _Roll_RA |  |
| Veto Counter | 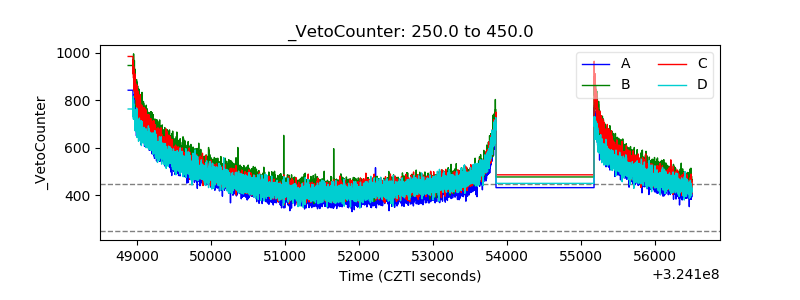 |