| Param | Original file | Final file |
|---|---|---|
| Filename | modeM0/AS1T03_183T01_9000003606_24507cztM0_level2.evt | modeM0/AS1T03_183T01_9000003606_24507cztM0_level2_quad_clean.evt |
| Size (bytes) | 590,754,240 | 119,237,760 |
| Size | 563.4 MB | 113.7 MB |
| Events in quadrant A | 3,957,738 | 810,422 |
| Events in quadrant B | 4,245,931 | 830,128 |
| Events in quadrant C | 3,493,670 | 788,654 |
| Events in quadrant D | 5,761,347 | 736,459 |
| Mode M0 | |||
|---|---|---|---|
| Quadrant | BADHDUFLAG | Total packets | Discarded packets |
| A | 0 | 15888 | 2 |
| B | 0 | 16773 | 6 |
| C | 0 | 14502 | 2 |
| D | 0 | 21541 | 2 |
| Mode SS | |||
|---|---|---|---|
| Quadrant | BADHDUFLAG | Total packets | Discarded packets |
| A | 0 | 130 | 0 |
| B | 0 | 130 | 0 |
| C | 0 | 130 | 0 |
| D | 0 | 130 | 0 |
| Mode M9 | |||
|---|---|---|---|
| Quadrant | BADHDUFLAG | Total packets | Discarded packets |
| A | 0 | 13 | 0 |
| B | 0 | 14 | 0 |
| C | 0 | 14 | 0 |
| D | 0 | 14 | 0 |
| Quadrant | Total seconds | Saturated seconds | Saturation percentage |
|---|---|---|---|
| A | 6378 | 406 | 6.365632% |
| B | 6377 | 291 | 4.563274% |
| C | 6377 | 115 | 1.803356% |
| D | 6377 | 452 | 7.087972% |
Noise dominated data is calculated using 1-second bins in cleaned event files. If a bin has >2000 counts, and if more than 50% of those come from <1% of pixels, then it is considered to be noise-dominated and hence unusable.
| Quadrant | # 1 sec bins | Bins with >0 counts | Bins with >2000 counts | High rate bins dominated by noise | Noise dominated (total time) | Noise dominated (detector-on time) | Marked lightcurve |
|---|---|---|---|---|---|---|---|
| A | 7618 | 6379 | 191 | 191 | 2.51% | 2.99% | 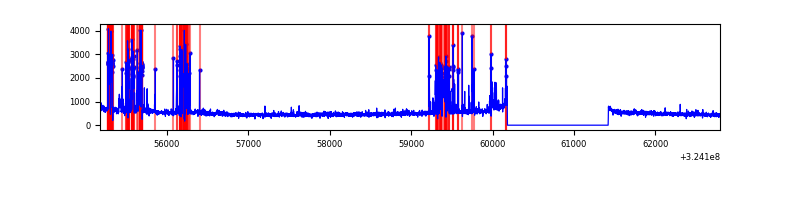 |
| B | 7617 | 6378 | 120 | 120 | 1.58% | 1.88% | 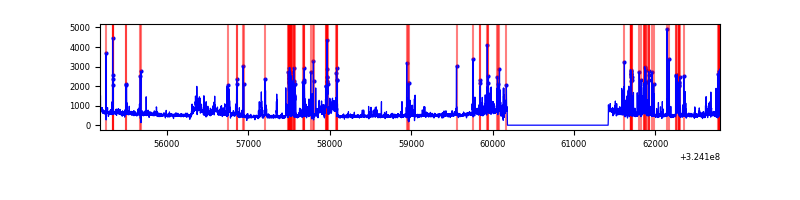 |
| C | 7617 | 6378 | 45 | 45 | 0.59% | 0.71% | 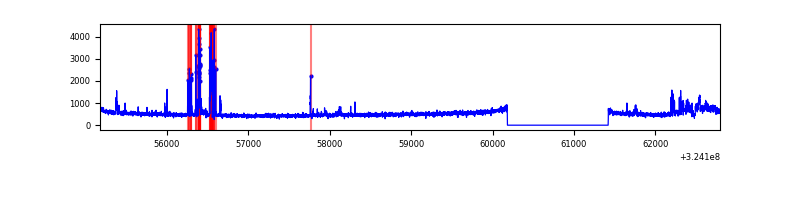 |
| D | 7617 | 6378 | 350 | 350 | 4.59% | 5.49% | 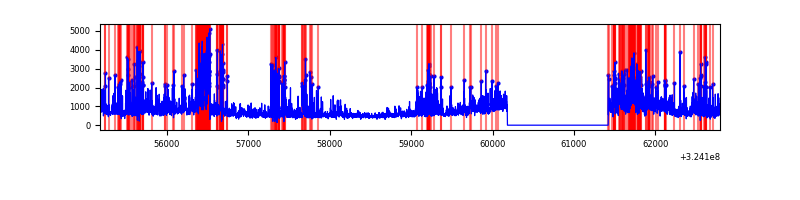 |
Top three noisy pixels from each quadrant. If the there are fewer than three noisy pixels in the level2.evt file, extra rows are filled as -1
| Pixel properties | Quadrant properties | ||||||
|---|---|---|---|---|---|---|---|
| Quadrant | DetID | PixID | Counts | Sigma | Mean | Median | Sigma |
| A | 14 | 111 | 898578 | 5784.66 | 774 | 761 | 155.2 |
| A | 4 | 2 | 76003 | 484.79 | 774 | 761 | 155.2 |
| A | 13 | 254 | 10086 | 60.08 | 774 | 761 | 155.2 |
| B | 3 | 64 | 1108251 | 7585.99 | 784 | 768 | 146.0 |
| B | 5 | 172 | 29287 | 195.35 | 784 | 768 | 146.0 |
| B | 10 | 249 | 28441 | 189.55 | 784 | 768 | 146.0 |
| C | 2 | 16 | 243431 | 1392.79 | 755 | 759 | 174.2 |
| C | 10 | 9 | 180016 | 1028.83 | 755 | 759 | 174.2 |
| C | 14 | 238 | 122659 | 699.63 | 755 | 759 | 174.2 |
| D | 1 | 52 | 1675869 | 9516.18 | 737 | 717 | 176.0 |
| D | 8 | 195 | 968383 | 5497.11 | 737 | 717 | 176.0 |
| D | 9 | 1 | 232777 | 1318.28 | 737 | 717 | 176.0 |
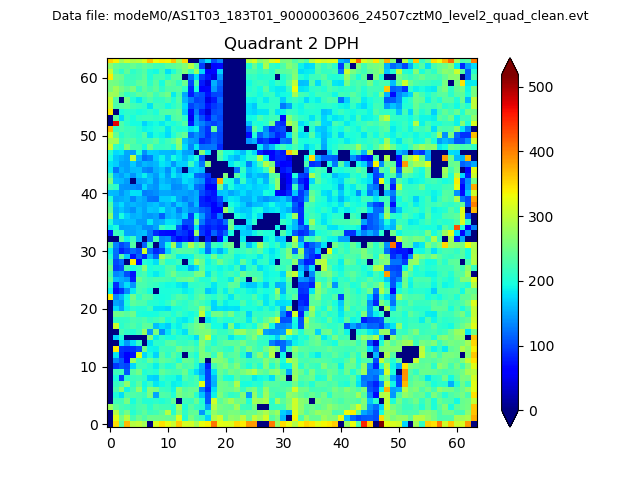
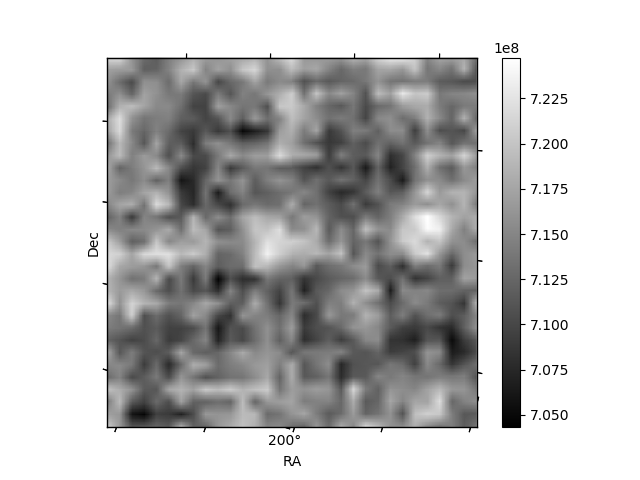
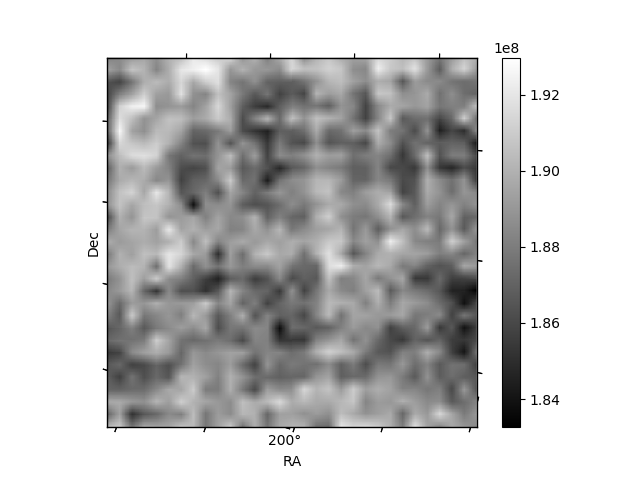
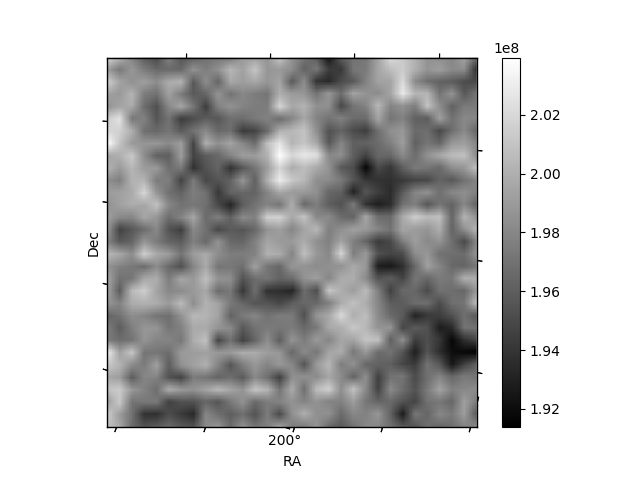
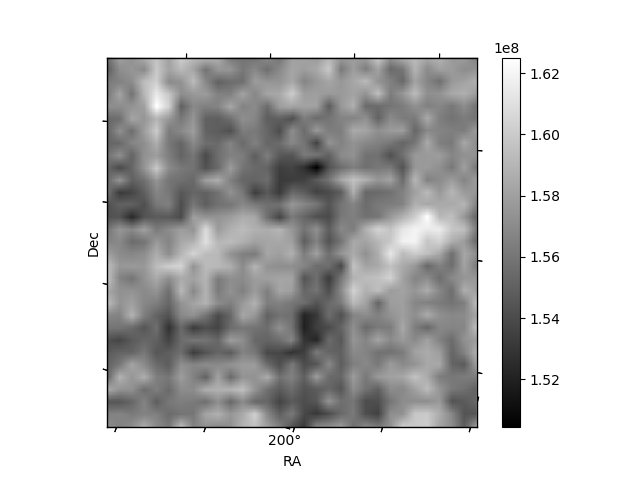
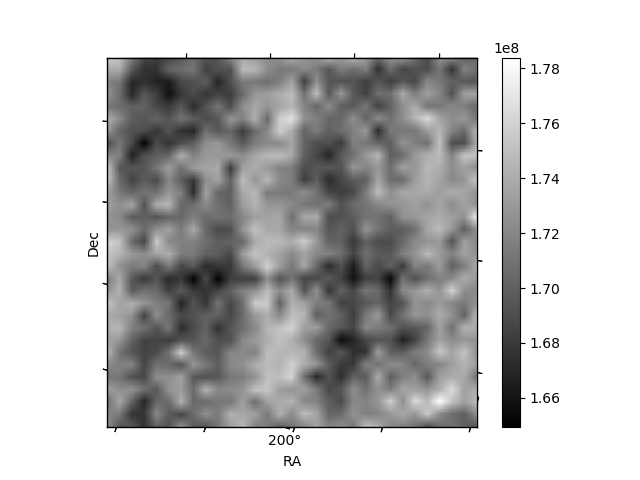
Histogram calculated using DETX and DETY for each event in the final _common_clean file
| Quadrant A | 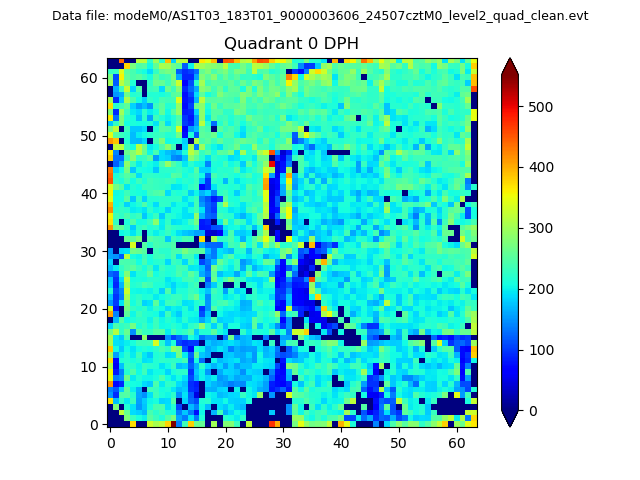 |
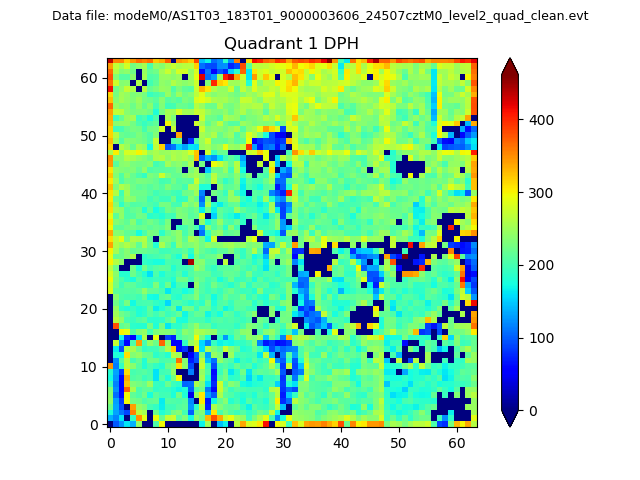 |
Quadrant B |
|---|---|---|---|
| Quadrant D | 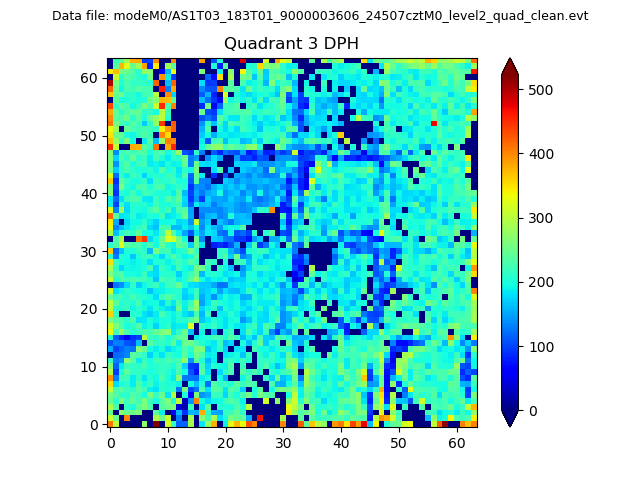 |
 |
Quadrant C |
| Plot type | Count rate plots | Images |
|---|---|---|
| Comparison with Poisson distribution Blue bars denote a histogram of data divided into 1 sec bins. Red curve is a Poisson curve with rate = median count rate of data. |
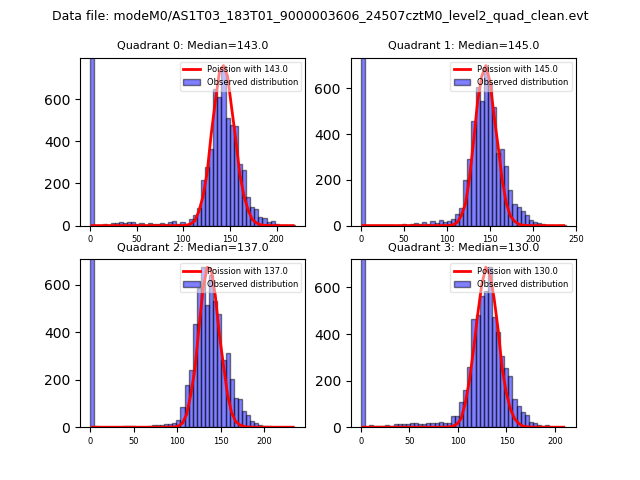 |
 |
| Quadrant-wise count rates Data is divided into 100 sec bins |
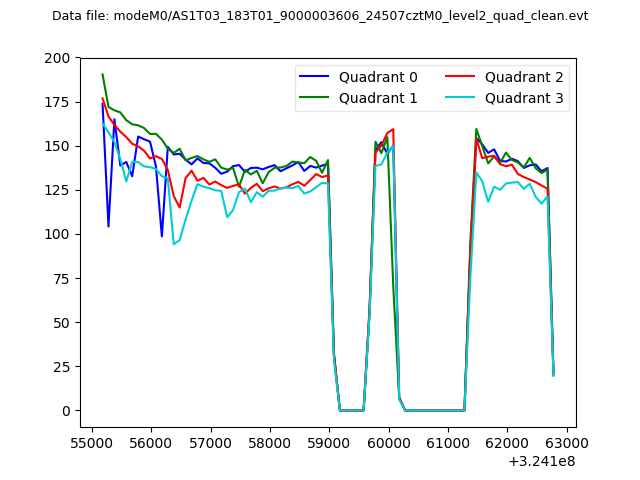 |
|
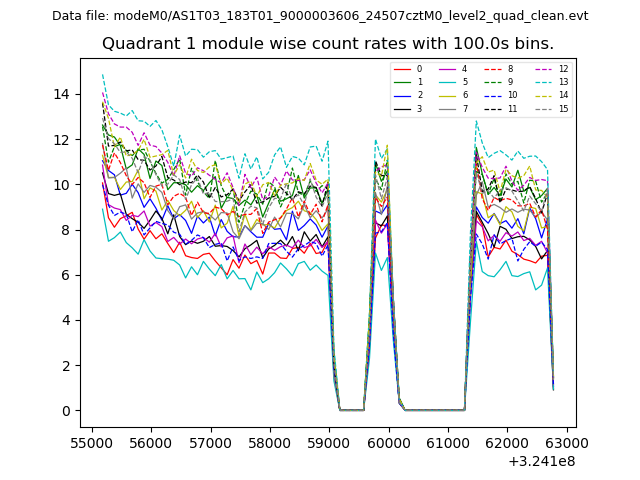
| Module-wise count rates for Quadrant A Data is divided into 100 sec bins |
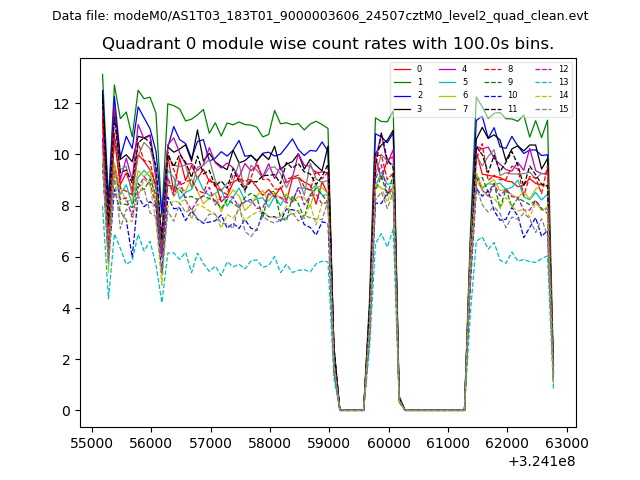 |
 |
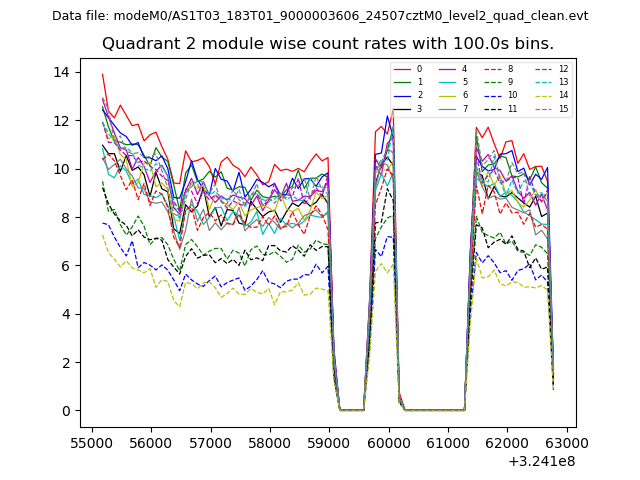
| Module-wise count rates for Quadrant B Data is divided into 100 sec bins |
 |
 |
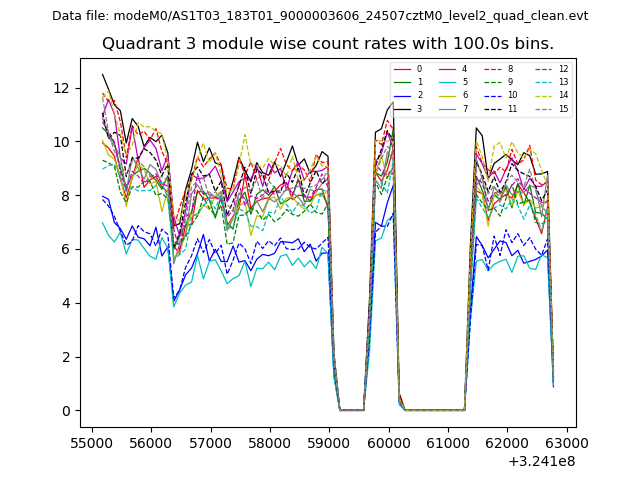
| Module-wise count rates for Quadrant C Data is divided into 100 sec bins |
 |
 |
| Module-wise count rates for Quadrant D Data is divided into 100 sec bins |
 |
 |
| Parameter | Plot |
|---|---|
| CZT HV Monitor | 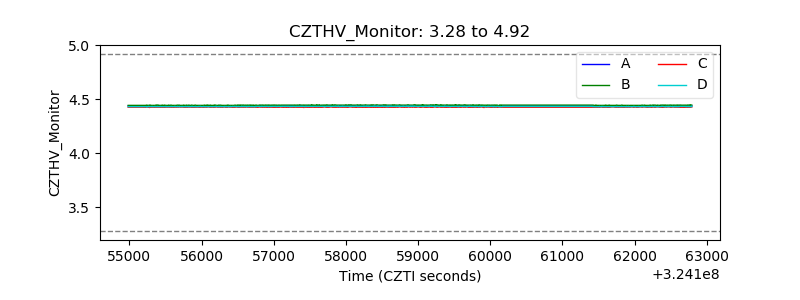 |
| D_VDD | 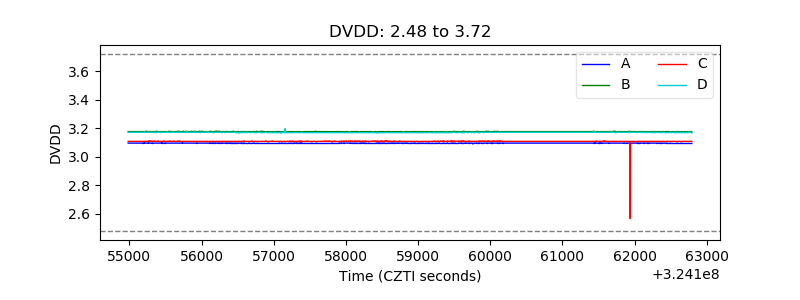 |
| Temperature 1 | 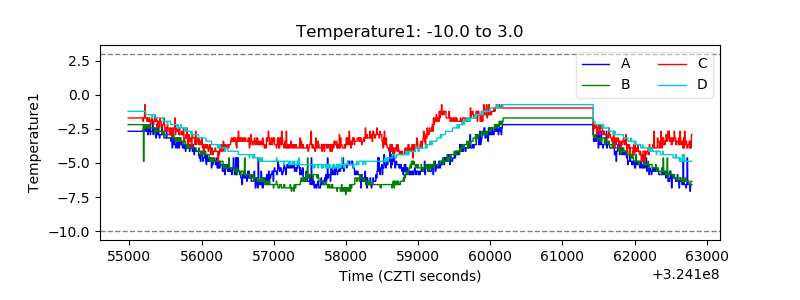 |
| Veto HV Monitor |  |
| Veto LLD | 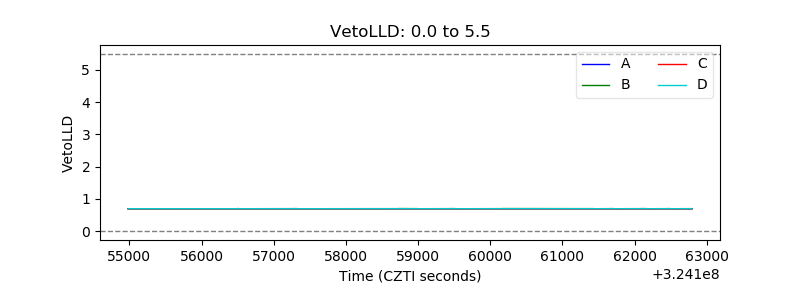 |
| Alpha Counter | 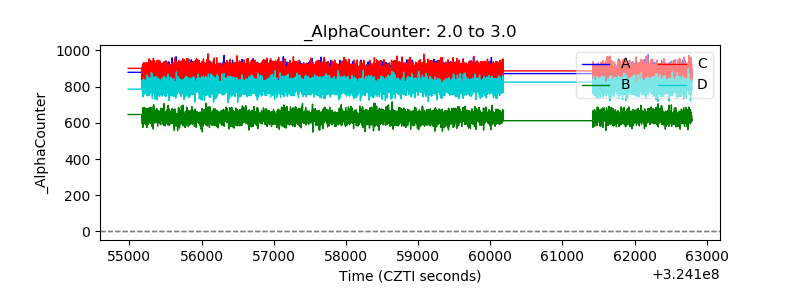 |
| _CPM_Rate | 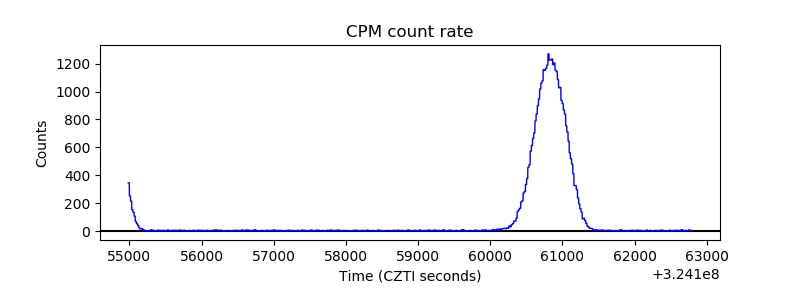 |
| CZT Counter |  |
| +2.5 Volts monitor |  |
| +5 Volts monitor |  |
| _ROLL_ROT | 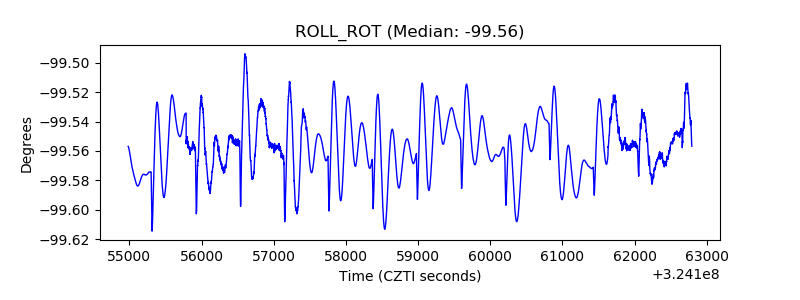 |
| _Roll_DEC | 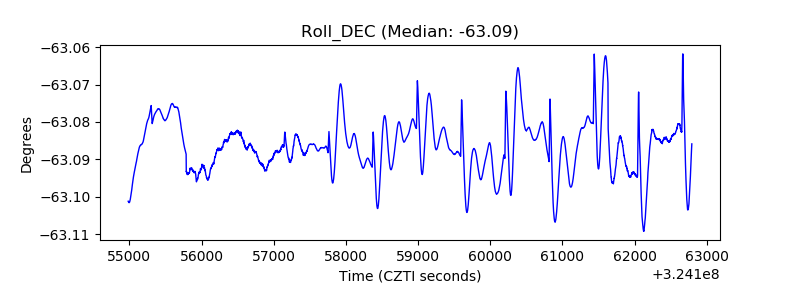 |
| _Roll_RA | 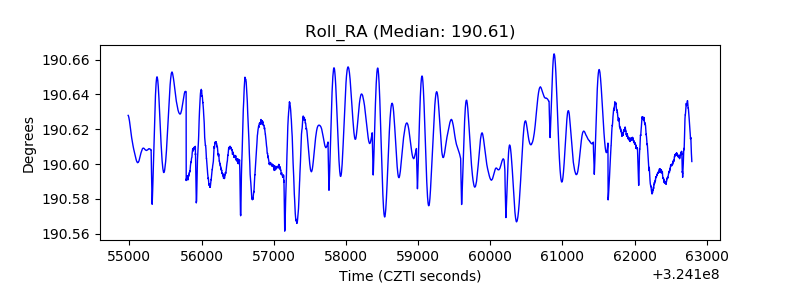 |
| Veto Counter | 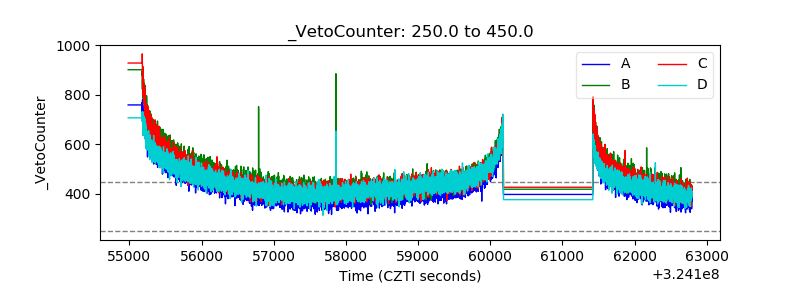 |