| Param | Original file | Final file |
|---|---|---|
| Filename | modeM0/AS1T03_183T01_9000003606_24510cztM0_level2.evt | modeM0/AS1T03_183T01_9000003606_24510cztM0_level2_quad_clean.evt |
| Size (bytes) | 567,976,320 | 131,757,120 |
| Size | 541.7 MB | 125.7 MB |
| Events in quadrant A | 4,719,273 | 882,912 |
| Events in quadrant B | 3,909,939 | 900,243 |
| Events in quadrant C | 3,583,963 | 852,944 |
| Events in quadrant D | 4,470,232 | 823,416 |
| Mode M0 | |||
|---|---|---|---|
| Quadrant | BADHDUFLAG | Total packets | Discarded packets |
| A | 0 | 19104 | 2 |
| B | 0 | 16577 | 2 |
| C | 0 | 15734 | 2 |
| D | 0 | 18504 | 2 |
| Mode SS | |||
|---|---|---|---|
| Quadrant | BADHDUFLAG | Total packets | Discarded packets |
| A | 0 | 154 | 0 |
| B | 0 | 154 | 0 |
| C | 0 | 154 | 0 |
| D | 0 | 154 | 0 |
| Mode M9 | |||
|---|---|---|---|
| Quadrant | BADHDUFLAG | Total packets | Discarded packets |
| A | 0 | 3 | 0 |
| B | 0 | 3 | 0 |
| C | 0 | 3 | 0 |
| D | 0 | 3 | 0 |
| Quadrant | Total seconds | Saturated seconds | Saturation percentage |
|---|---|---|---|
| A | 7641 | 116 | 1.518126% |
| B | 7641 | 169 | 2.211752% |
| C | 7641 | 152 | 1.989268% |
| D | 7641 | 252 | 3.297998% |
Noise dominated data is calculated using 1-second bins in cleaned event files. If a bin has >2000 counts, and if more than 50% of those come from <1% of pixels, then it is considered to be noise-dominated and hence unusable.
| Quadrant | # 1 sec bins | Bins with >0 counts | Bins with >2000 counts | High rate bins dominated by noise | Noise dominated (total time) | Noise dominated (detector-on time) | Marked lightcurve |
|---|---|---|---|---|---|---|---|
| A | 7831 | 7643 | 0 | 0 | 0.00% | 0.00% | 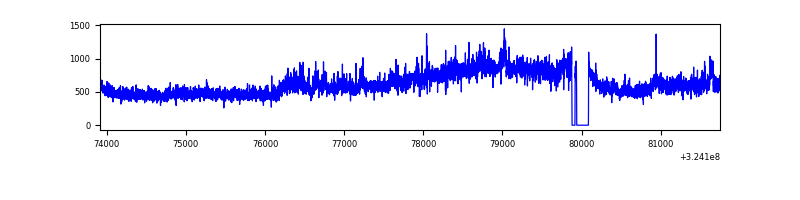 |
| B | 7831 | 7643 | 38 | 38 | 0.49% | 0.50% | 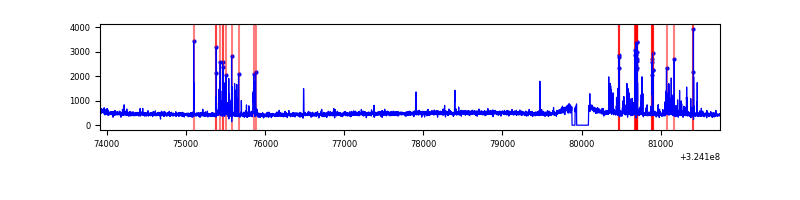 |
| C | 7831 | 7643 | 9 | 9 | 0.11% | 0.12% | 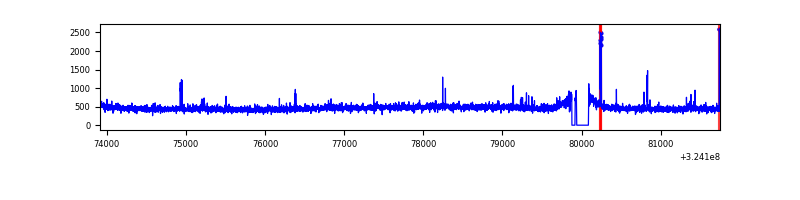 |
| D | 7831 | 7643 | 139 | 139 | 1.77% | 1.82% | 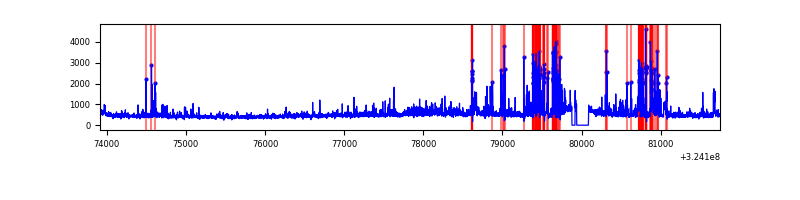 |
Top three noisy pixels from each quadrant. If the there are fewer than three noisy pixels in the level2.evt file, extra rows are filled as -1
| Pixel properties | Quadrant properties | ||||||
|---|---|---|---|---|---|---|---|
| Quadrant | DetID | PixID | Counts | Sigma | Mean | Median | Sigma |
| A | 14 | 111 | 1273612 | 7124.3 | 893 | 875 | 178.6 |
| A | 13 | 254 | 11904 | 61.74 | 893 | 875 | 178.6 |
| A | 3 | 137 | 8222 | 41.13 | 893 | 875 | 178.6 |
| B | 3 | 64 | 342789 | 1982.9 | 898 | 874 | 172.4 |
| B | 12 | 111 | 21397 | 119.02 | 898 | 874 | 172.4 |
| B | 11 | 111 | 18551 | 102.52 | 898 | 874 | 172.4 |
| C | 14 | 238 | 136819 | 683.3 | 859 | 863 | 199.0 |
| C | 2 | 16 | 70867 | 351.83 | 859 | 863 | 199.0 |
| C | 10 | 9 | 13404 | 63.03 | 859 | 863 | 199.0 |
| D | 12 | 218 | 516947 | 2502.15 | 855 | 827 | 206.3 |
| D | 8 | 195 | 272210 | 1315.67 | 855 | 827 | 206.3 |
| D | 1 | 52 | 252440 | 1219.82 | 855 | 827 | 206.3 |
Histogram calculated using DETX and DETY for each event in the final _common_clean file
| Quadrant A | 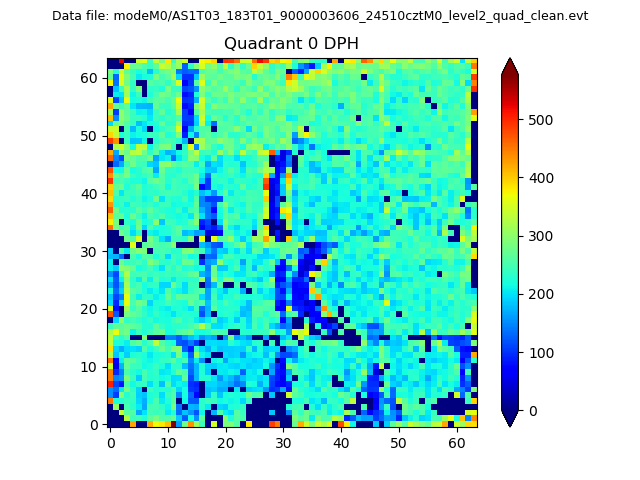 |
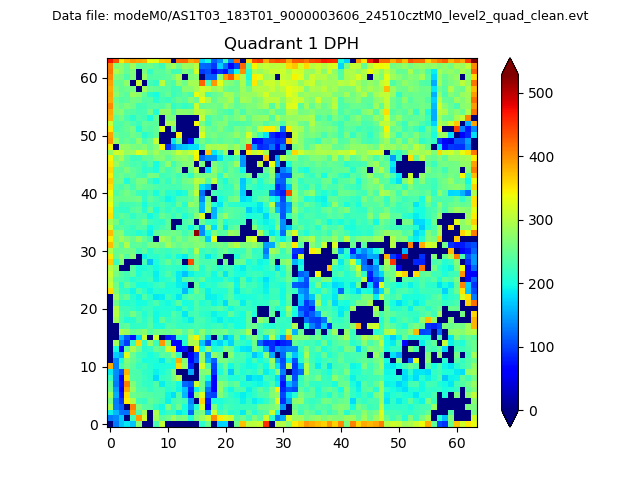 |
Quadrant B |
|---|---|---|---|
| Quadrant D | 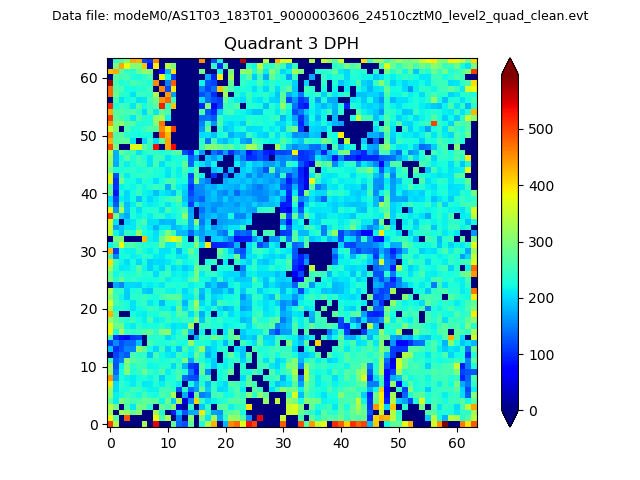 |
 |
Quadrant C |
| Plot type | Count rate plots | Images |
|---|---|---|
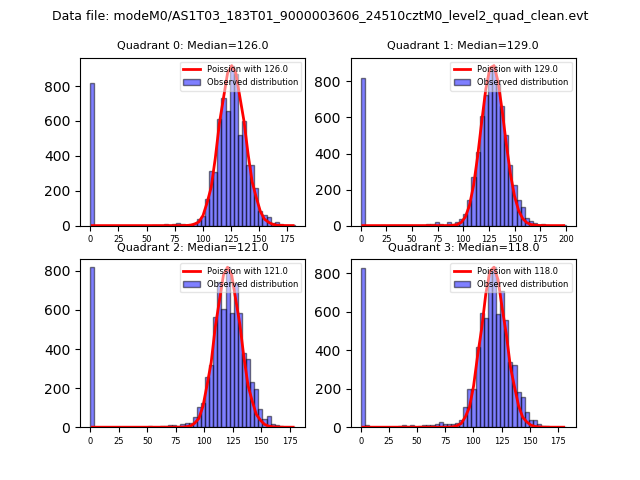
| Comparison with Poisson distribution Blue bars denote a histogram of data divided into 1 sec bins. Red curve is a Poisson curve with rate = median count rate of data. |
 |
 |
| Quadrant-wise count rates Data is divided into 100 sec bins |
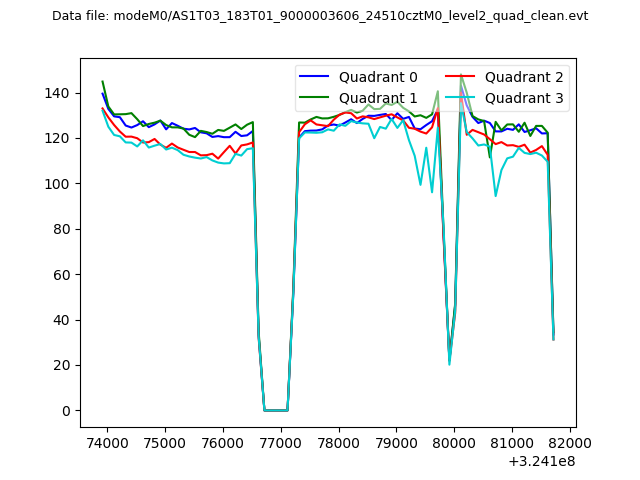 |
|
| Module-wise count rates for Quadrant A Data is divided into 100 sec bins |
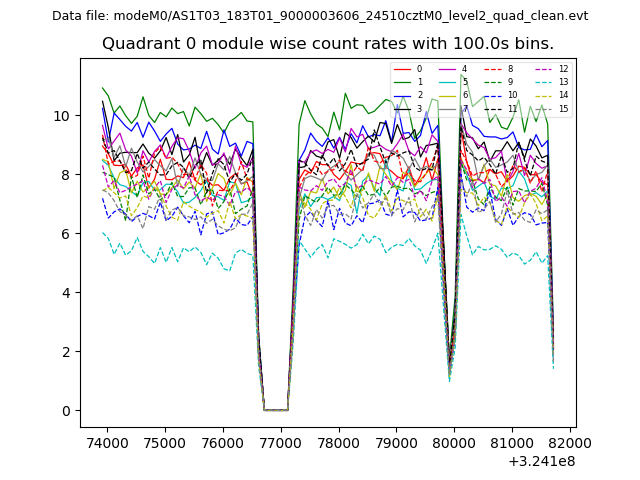 |
 |
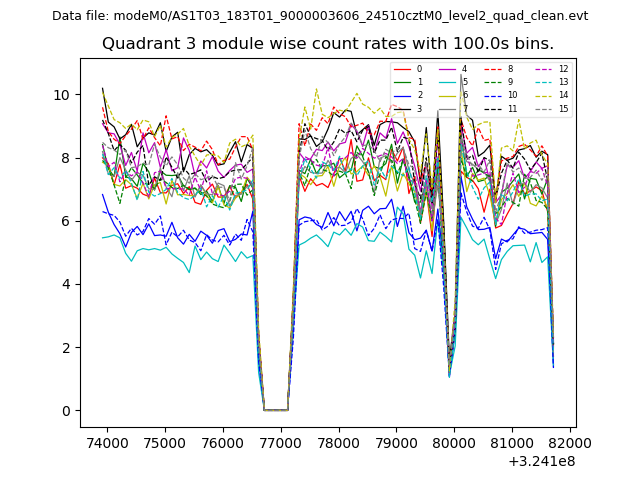
| Module-wise count rates for Quadrant B Data is divided into 100 sec bins |
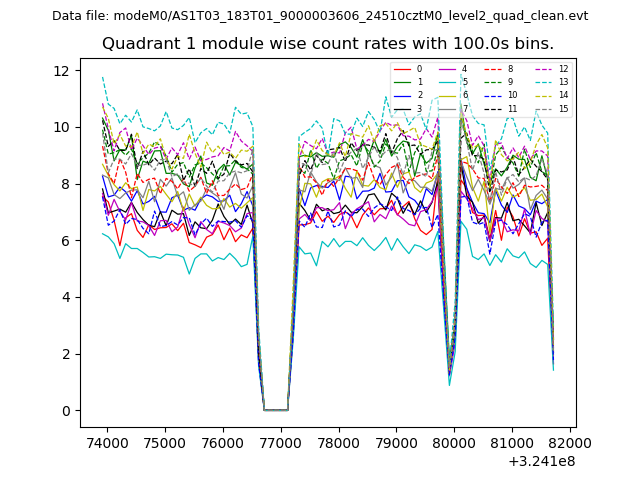 |
 |
| Module-wise count rates for Quadrant C Data is divided into 100 sec bins |
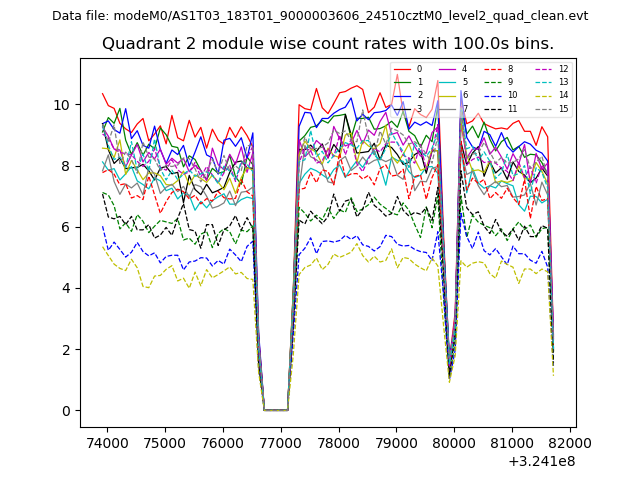 |
 |
| Module-wise count rates for Quadrant D Data is divided into 100 sec bins |
 |
 |
| Parameter | Plot |
|---|---|
| CZT HV Monitor | 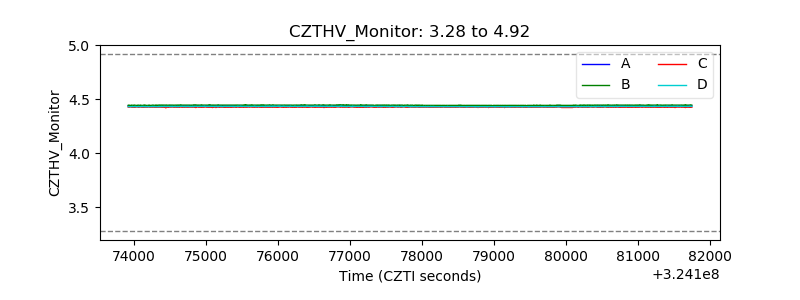 |
| D_VDD | 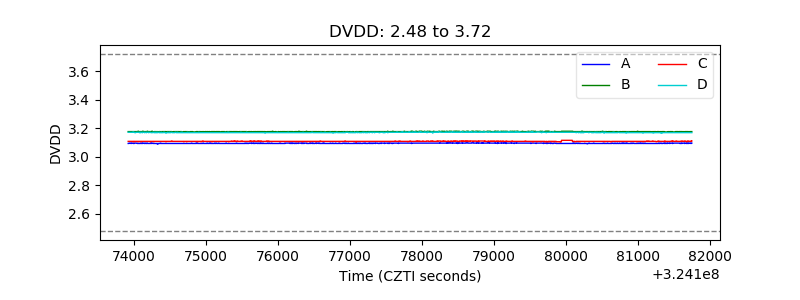 |
| Temperature 1 | 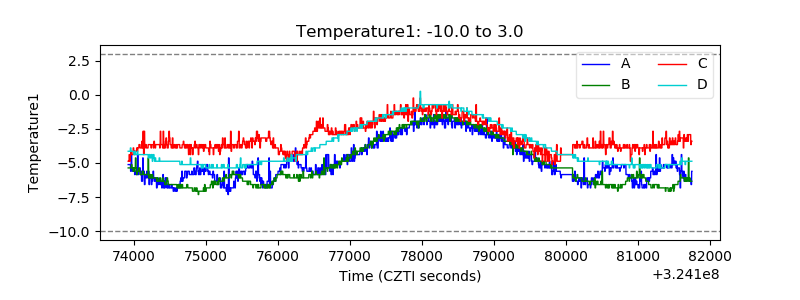 |
| Veto HV Monitor | 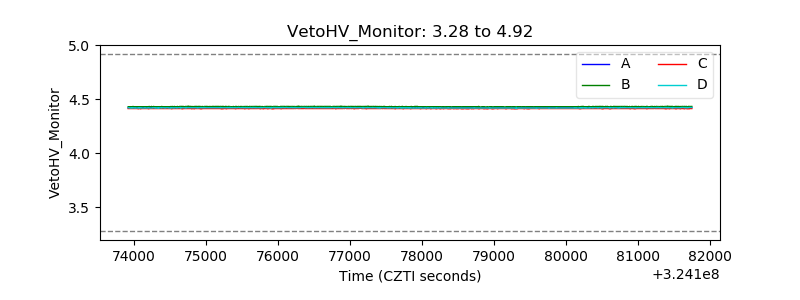 |
| Veto LLD | 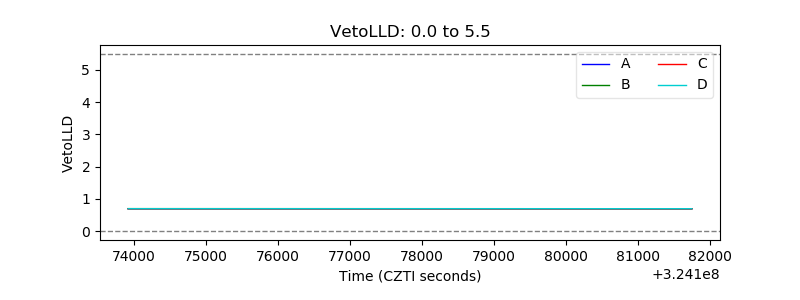 |
| Alpha Counter | 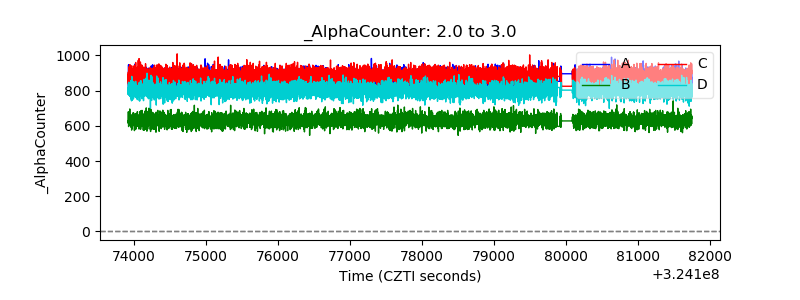 |
| _CPM_Rate | 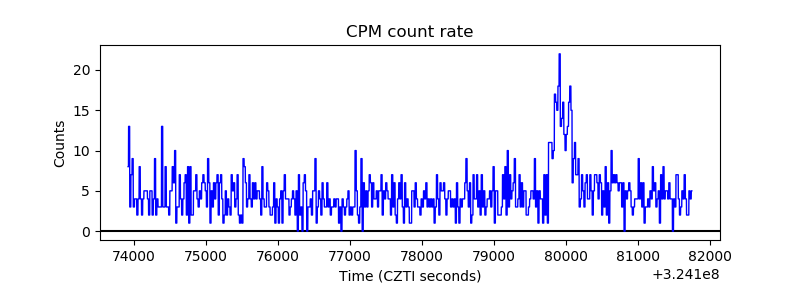 |
| CZT Counter |  |
| +2.5 Volts monitor |  |
| +5 Volts monitor | 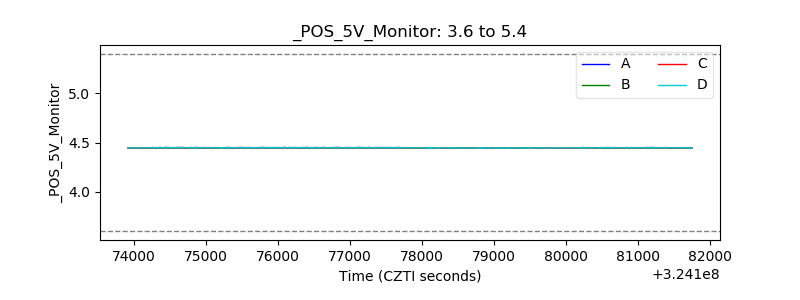 |
| _ROLL_ROT | 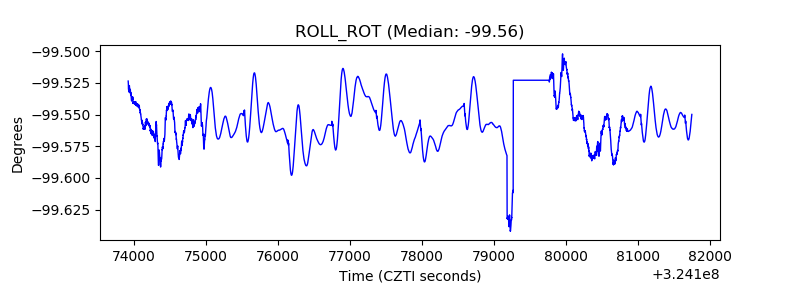 |
| _Roll_DEC | 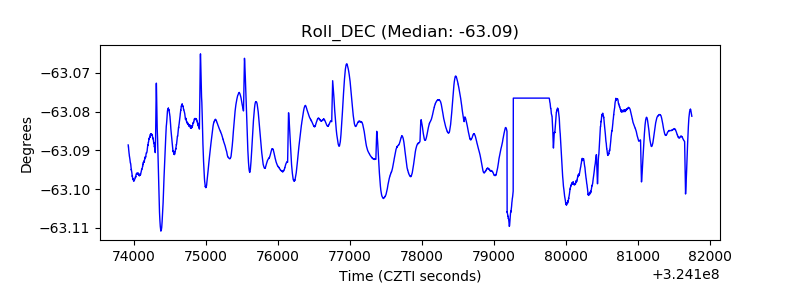 |
| _Roll_RA | 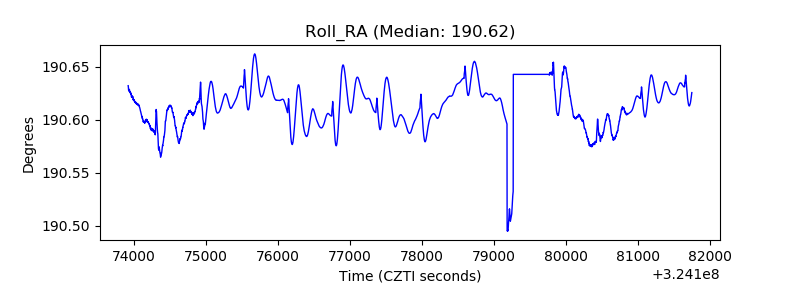 |
| Veto Counter | 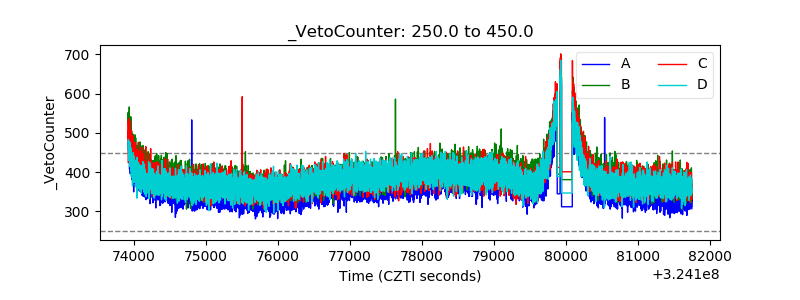 |