| Param | Original file | Final file |
|---|---|---|
| Filename | modeM0/AS1T03_183T01_9000003606_24514cztM0_level2.evt | modeM0/AS1T03_183T01_9000003606_24514cztM0_level2_quad_clean.evt |
| Size (bytes) | 1,029,029,760 | 190,794,240 |
| Size | 981.4 MB | 182.0 MB |
| Events in quadrant A | 5,589,152 | 1,312,561 |
| Events in quadrant B | 10,260,369 | 1,180,328 |
| Events in quadrant C | 5,658,772 | 1,272,764 |
| Events in quadrant D | 8,863,514 | 1,201,282 |
| Mode M0 | |||
|---|---|---|---|
| Quadrant | BADHDUFLAG | Total packets | Discarded packets |
| A | 0 | 24036 | 2 |
| B | 0 | 38240 | 2 |
| C | 0 | 24444 | 2 |
| D | 0 | 34045 | 2 |
| Mode SS | |||
|---|---|---|---|
| Quadrant | BADHDUFLAG | Total packets | Discarded packets |
| A | 0 | 240 | 0 |
| B | 0 | 240 | 0 |
| C | 0 | 240 | 0 |
| D | 0 | 240 | 0 |
| Mode M9 | |||
|---|---|---|---|
| Quadrant | BADHDUFLAG | Total packets | Discarded packets |
| A | 0 | 10 | 0 |
| B | 0 | 10 | 0 |
| C | 0 | 10 | 0 |
| D | 0 | 10 | 0 |
| Quadrant | Total seconds | Saturated seconds | Saturation percentage |
|---|---|---|---|
| A | 11713 | 180 | 1.536754% |
| B | 11714 | 2174 | 18.558989% |
| C | 11714 | 263 | 2.245177% |
| D | 11714 | 827 | 7.059928% |
Noise dominated data is calculated using 1-second bins in cleaned event files. If a bin has >2000 counts, and if more than 50% of those come from <1% of pixels, then it is considered to be noise-dominated and hence unusable.
| Quadrant | # 1 sec bins | Bins with >0 counts | Bins with >2000 counts | High rate bins dominated by noise | Noise dominated (total time) | Noise dominated (detector-on time) | Marked lightcurve |
|---|---|---|---|---|---|---|---|
| A | 12768 | 11715 | 0 | 0 | 0.00% | 0.00% | 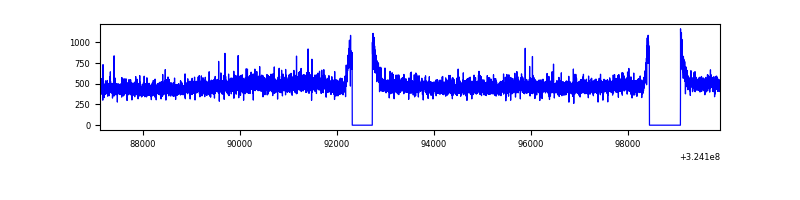 |
| B | 12768 | 11714 | 1247 | 1247 | 9.77% | 10.65% | 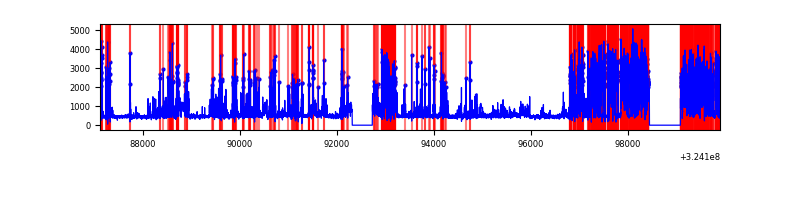 |
| C | 12769 | 11716 | 14 | 14 | 0.11% | 0.12% | 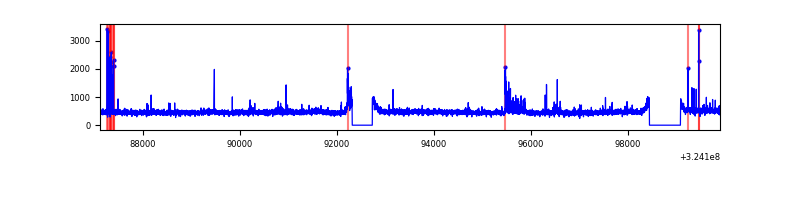 |
| D | 12769 | 11715 | 543 | 543 | 4.25% | 4.64% | 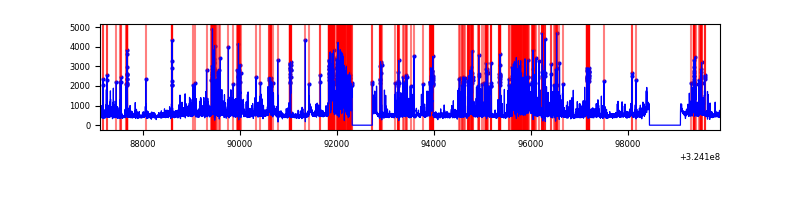 |
Top three noisy pixels from each quadrant. If the there are fewer than three noisy pixels in the level2.evt file, extra rows are filled as -1
| Pixel properties | Quadrant properties | ||||||
|---|---|---|---|---|---|---|---|
| Quadrant | DetID | PixID | Counts | Sigma | Mean | Median | Sigma |
| A | 14 | 111 | 223179 | 791.69 | 1389 | 1360 | 280.2 |
| A | 13 | 254 | 18838 | 62.38 | 1389 | 1360 | 280.2 |
| A | 3 | 137 | 12856 | 41.03 | 1389 | 1360 | 280.2 |
| B | 3 | 64 | 5317650 | 22178.2 | 1253 | 1217 | 239.7 |
| B | 12 | 111 | 29175 | 116.63 | 1253 | 1217 | 239.7 |
| B | 11 | 111 | 26354 | 104.86 | 1253 | 1217 | 239.7 |
| C | 14 | 238 | 212371 | 682.82 | 1335 | 1342 | 309.1 |
| C | 2 | 16 | 163828 | 525.75 | 1335 | 1342 | 309.1 |
| C | 10 | 9 | 71903 | 228.31 | 1335 | 1342 | 309.1 |
| D | 1 | 52 | 1574680 | 4942.43 | 1310 | 1267 | 318.3 |
| D | 12 | 218 | 1162253 | 3646.9 | 1310 | 1267 | 318.3 |
| D | 8 | 195 | 823151 | 2581.71 | 1310 | 1267 | 318.3 |
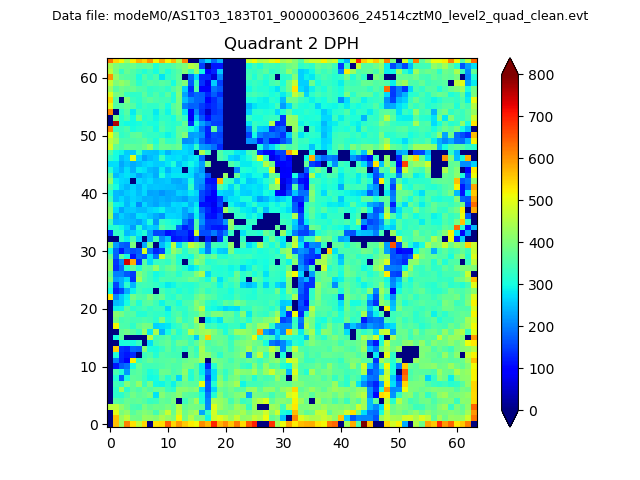
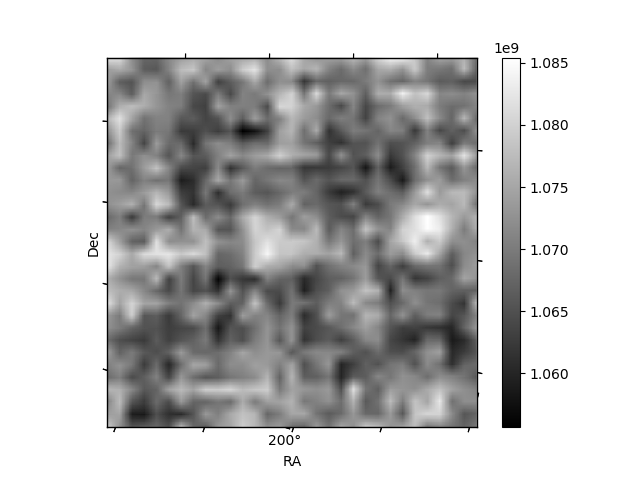
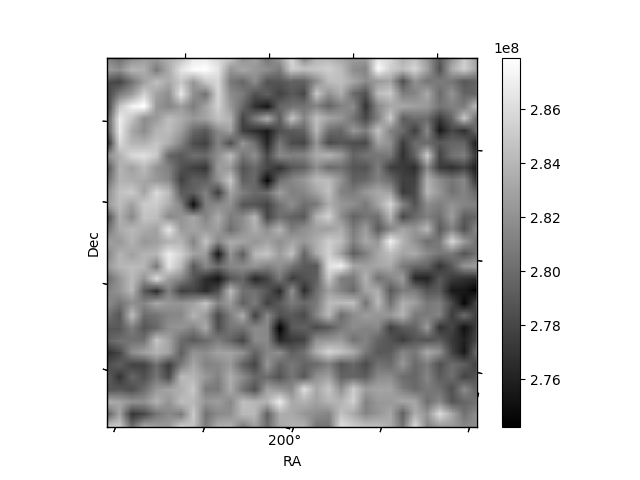
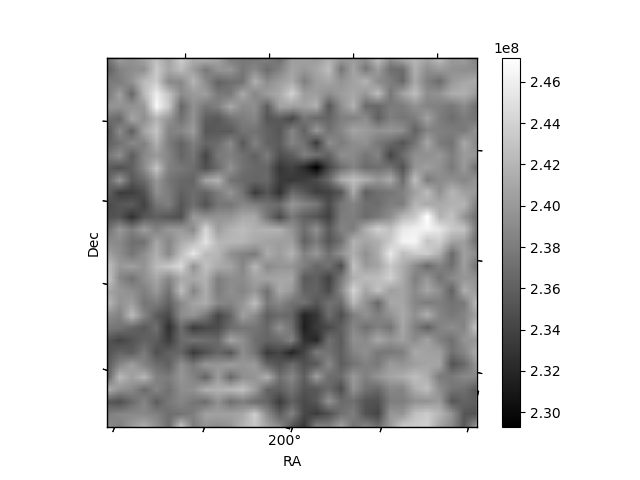
Histogram calculated using DETX and DETY for each event in the final _common_clean file
| Quadrant A | 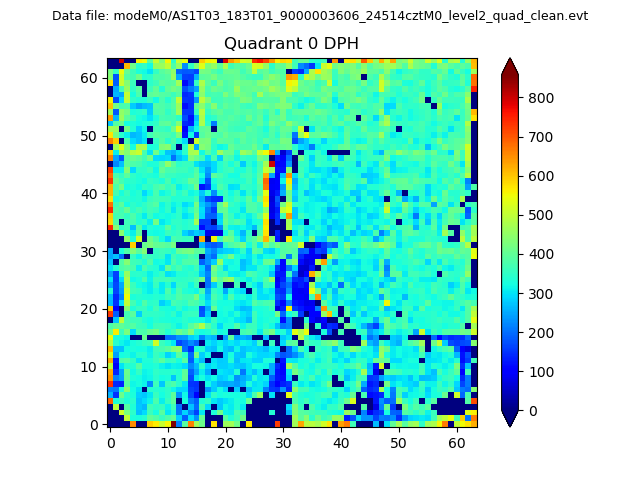 |
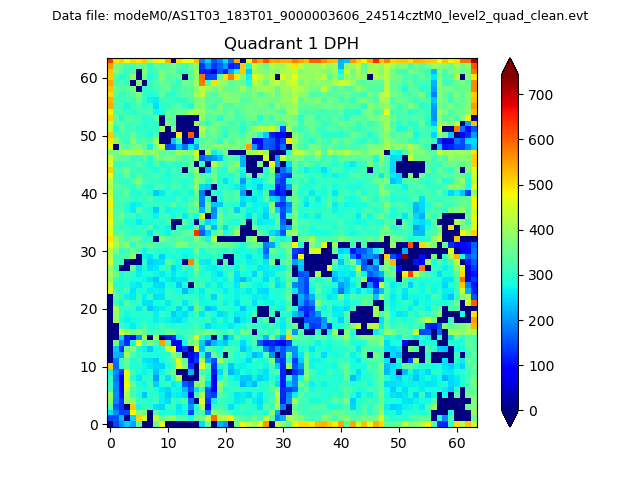 |
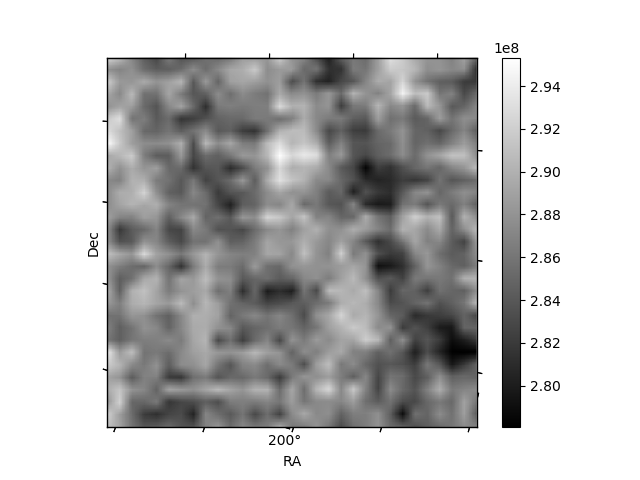
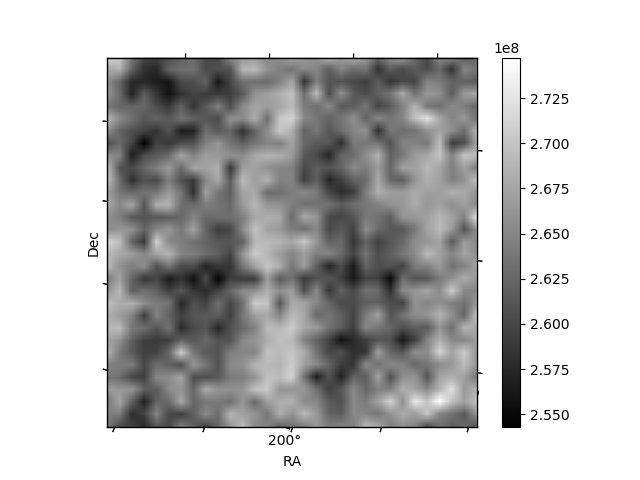
Quadrant B |
|---|---|---|---|
| Quadrant D | 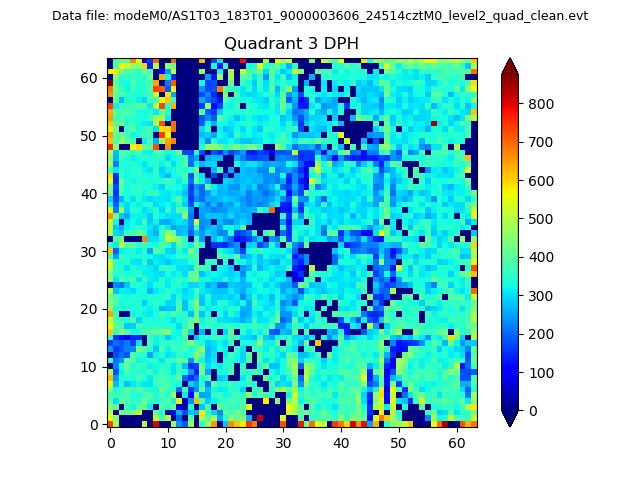 |
 |
Quadrant C |
| Plot type | Count rate plots | Images |
|---|---|---|
| Comparison with Poisson distribution Blue bars denote a histogram of data divided into 1 sec bins. Red curve is a Poisson curve with rate = median count rate of data. |
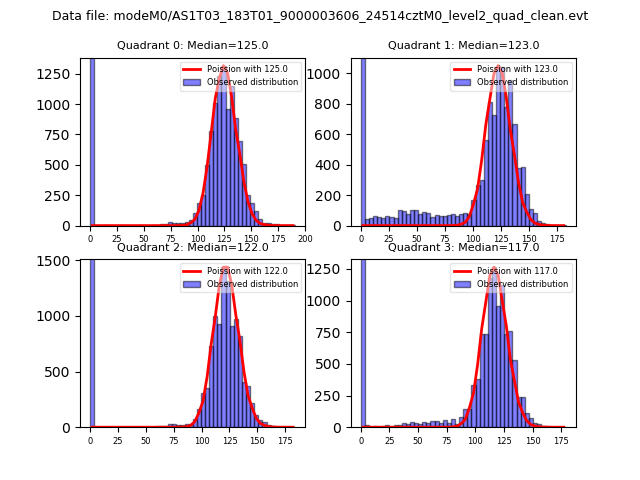 |
 |
| Quadrant-wise count rates Data is divided into 100 sec bins |
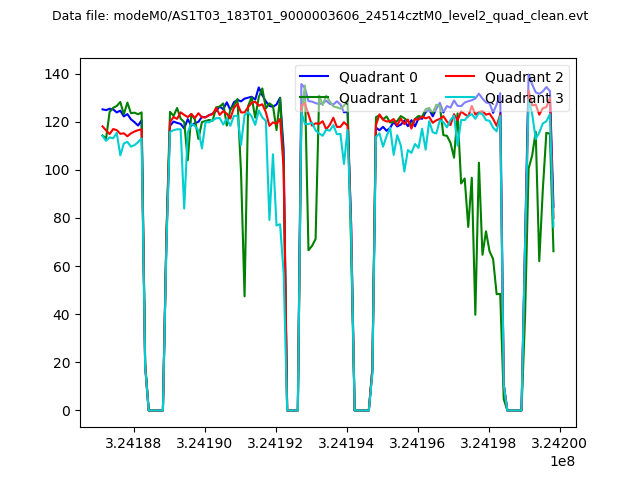 |
|
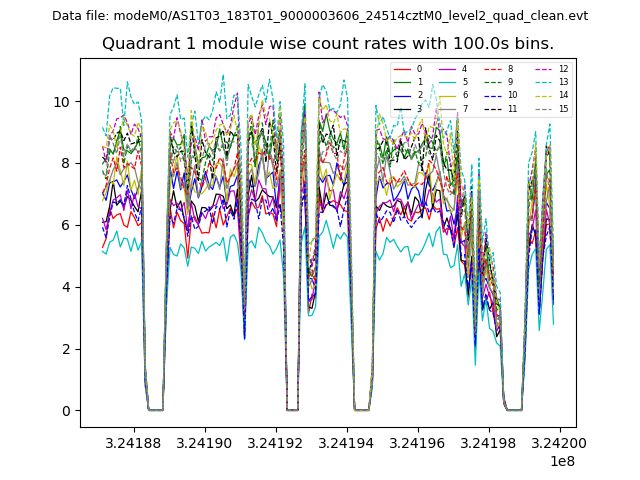
| Module-wise count rates for Quadrant A Data is divided into 100 sec bins |
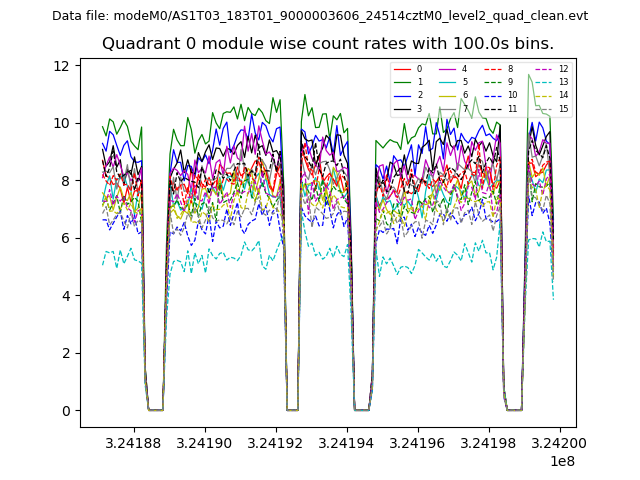 |
 |
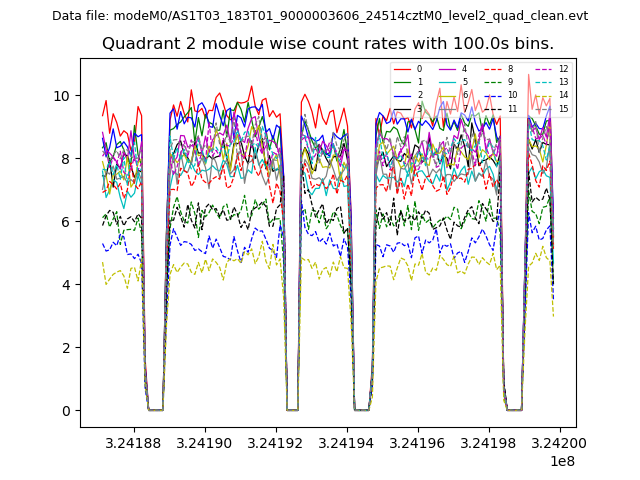
| Module-wise count rates for Quadrant B Data is divided into 100 sec bins |
 |
 |
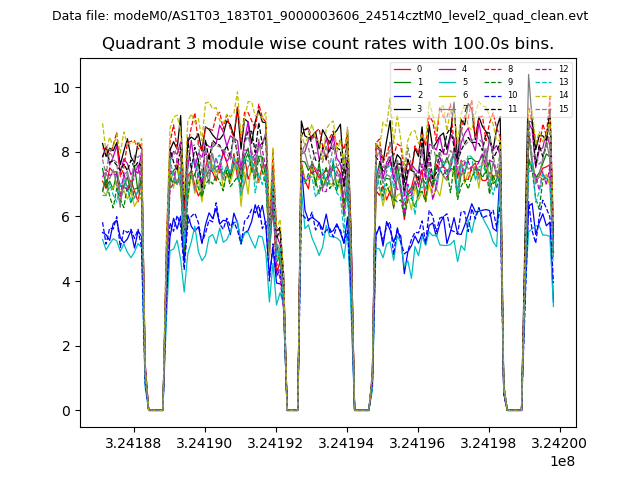
| Module-wise count rates for Quadrant C Data is divided into 100 sec bins |
 |
 |
| Module-wise count rates for Quadrant D Data is divided into 100 sec bins |
 |
 |
| Parameter | Plot |
|---|---|
| CZT HV Monitor | 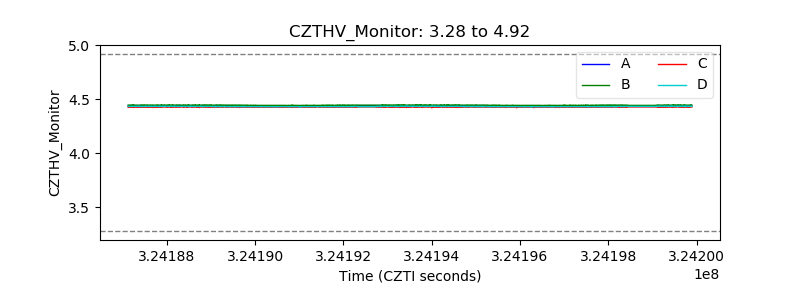 |
| D_VDD | 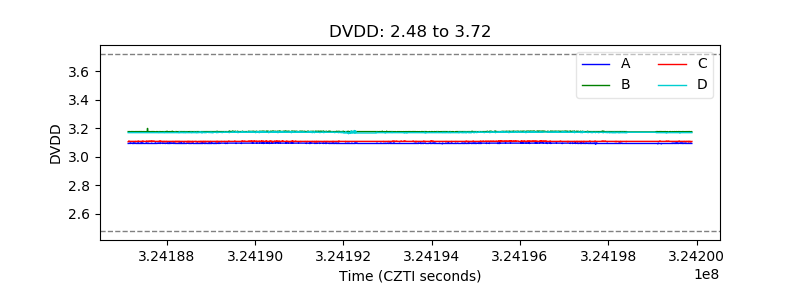 |
| Temperature 1 | 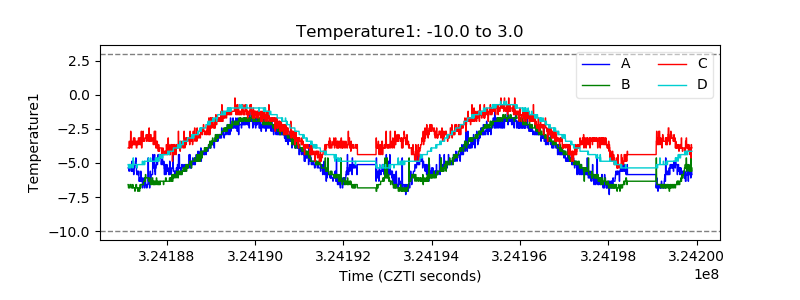 |
| Veto HV Monitor | 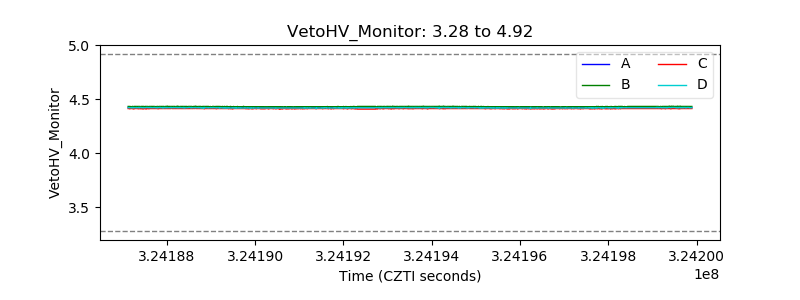 |
| Veto LLD | 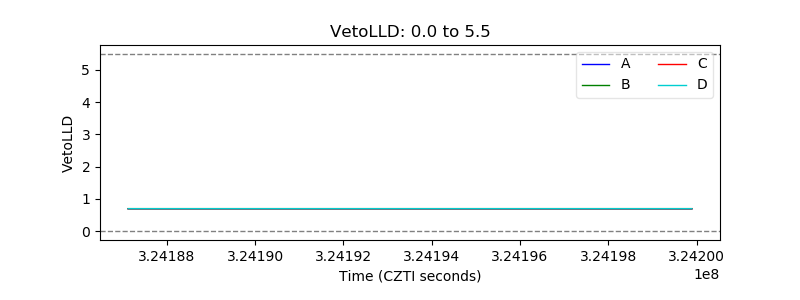 |
| Alpha Counter | 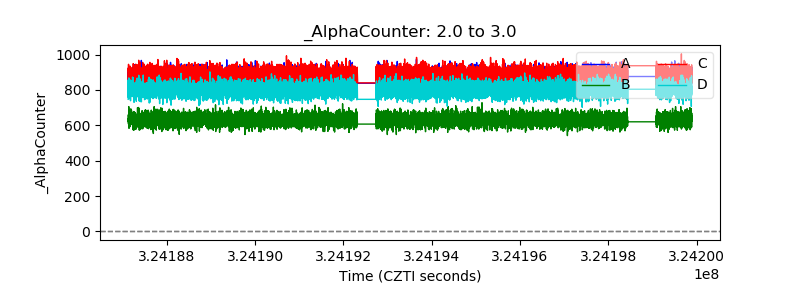 |
| _CPM_Rate | 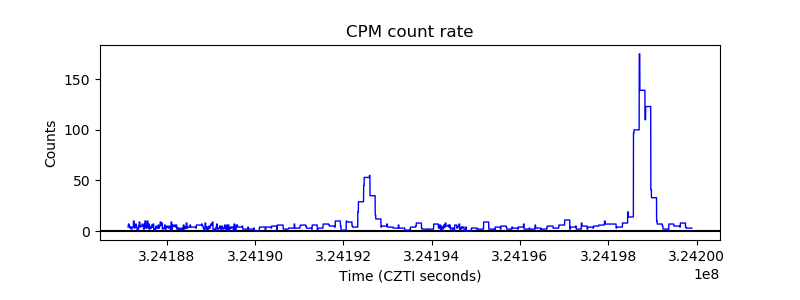 |
| CZT Counter |  |
| +2.5 Volts monitor |  |
| +5 Volts monitor | 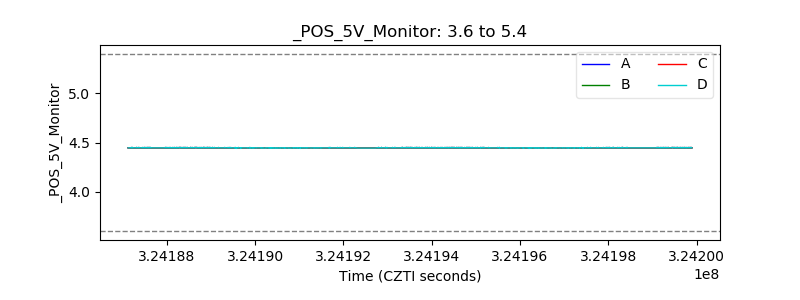 |
| _ROLL_ROT | 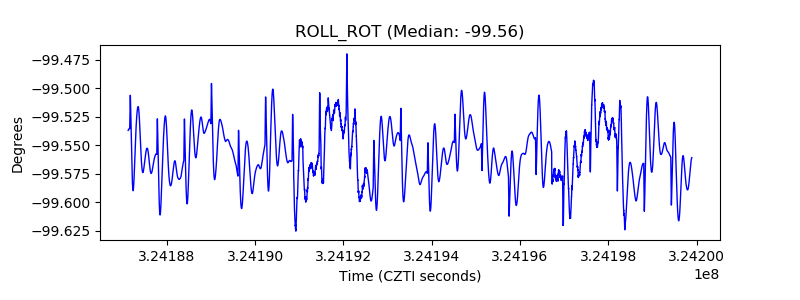 |
| _Roll_DEC | 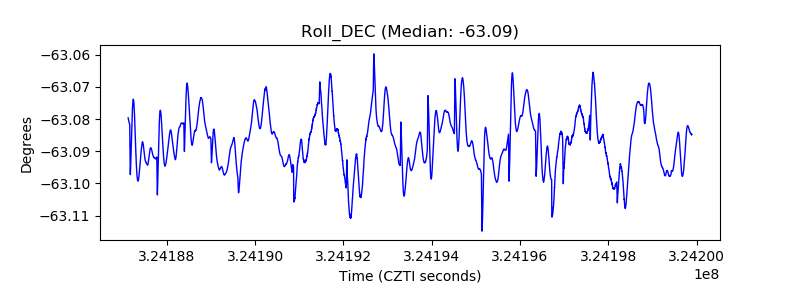 |
| _Roll_RA | 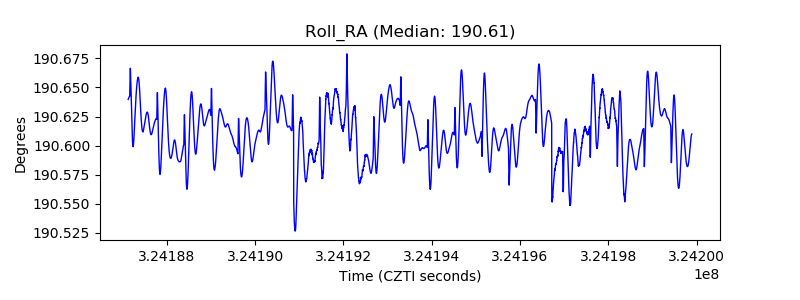 |
| Veto Counter | 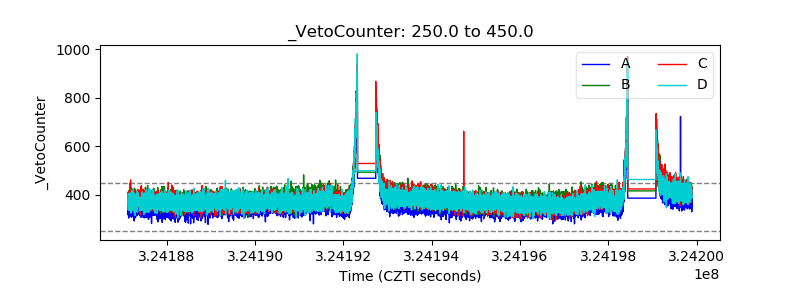 |