| Param | Original file | Final file |
|---|---|---|
| Filename | modeM0/AS1T03_183T01_9000003606_24515cztM0_level2.evt | modeM0/AS1T03_183T01_9000003606_24515cztM0_level2_quad_clean.evt |
| Size (bytes) | 1,165,423,680 | 187,629,120 |
| Size | 1.1 GB | 178.9 MB |
| Events in quadrant A | 6,282,254 | 1,281,279 |
| Events in quadrant B | 8,766,988 | 1,251,864 |
| Events in quadrant C | 6,230,608 | 1,245,988 |
| Events in quadrant D | 13,214,067 | 1,081,439 |
| Mode M0 | |||
|---|---|---|---|
| Quadrant | BADHDUFLAG | Total packets | Discarded packets |
| A | 0 | 26162 | 2 |
| B | 0 | 33836 | 2 |
| C | 0 | 26324 | 2 |
| D | 0 | 47237 | 2 |
| Mode SS | |||
|---|---|---|---|
| Quadrant | BADHDUFLAG | Total packets | Discarded packets |
| A | 0 | 240 | 0 |
| B | 0 | 240 | 0 |
| C | 0 | 240 | 0 |
| D | 0 | 240 | 0 |
| Mode M9 | |||
|---|---|---|---|
| Quadrant | BADHDUFLAG | Total packets | Discarded packets |
| A | 0 | 19 | 0 |
| B | 0 | 19 | 0 |
| C | 0 | 19 | 0 |
| D | 0 | 19 | 0 |
| Quadrant | Total seconds | Saturated seconds | Saturation percentage |
|---|---|---|---|
| A | 11878 | 107 | 0.900825% |
| B | 11879 | 1128 | 9.495749% |
| C | 11879 | 251 | 2.112972% |
| D | 11879 | 2339 | 19.690210% |
Noise dominated data is calculated using 1-second bins in cleaned event files. If a bin has >2000 counts, and if more than 50% of those come from <1% of pixels, then it is considered to be noise-dominated and hence unusable.
| Quadrant | # 1 sec bins | Bins with >0 counts | Bins with >2000 counts | High rate bins dominated by noise | Noise dominated (total time) | Noise dominated (detector-on time) | Marked lightcurve |
|---|---|---|---|---|---|---|---|
| A | 13693 | 11880 | 0 | 0 | 0.00% | 0.00% |  |
| B | 13694 | 11881 | 678 | 678 | 4.95% | 5.71% |  |
| C | 13694 | 11880 | 27 | 27 | 0.20% | 0.23% |  |
| D | 13694 | 11881 | 1922 | 1922 | 14.04% | 16.18% |  |
Top three noisy pixels from each quadrant. If the there are fewer than three noisy pixels in the level2.evt file, extra rows are filled as -1
| Pixel properties | Quadrant properties | ||||||
|---|---|---|---|---|---|---|---|
| Quadrant | DetID | PixID | Counts | Sigma | Mean | Median | Sigma |
| A | 14 | 111 | 700466 | 2429.28 | 1438 | 1405 | 287.8 |
| A | 6 | 16 | 39143 | 131.14 | 1438 | 1405 | 287.8 |
| A | 13 | 254 | 18390 | 59.02 | 1438 | 1405 | 287.8 |
| B | 3 | 64 | 3301582 | 12738.94 | 1379 | 1344 | 259.1 |
| B | 0 | 190 | 34725 | 128.85 | 1379 | 1344 | 259.1 |
| B | 12 | 111 | 31812 | 117.61 | 1379 | 1344 | 259.1 |
| C | 10 | 9 | 324842 | 1013.69 | 1376 | 1383 | 319.1 |
| C | 2 | 16 | 309213 | 964.71 | 1376 | 1383 | 319.1 |
| C | 14 | 238 | 221184 | 688.84 | 1376 | 1383 | 319.1 |
| D | 1 | 52 | 6938878 | 23032.79 | 1252 | 1218 | 301.2 |
| D | 12 | 218 | 609971 | 2021.04 | 1252 | 1218 | 301.2 |
| D | 8 | 195 | 599514 | 1986.32 | 1252 | 1218 | 301.2 |
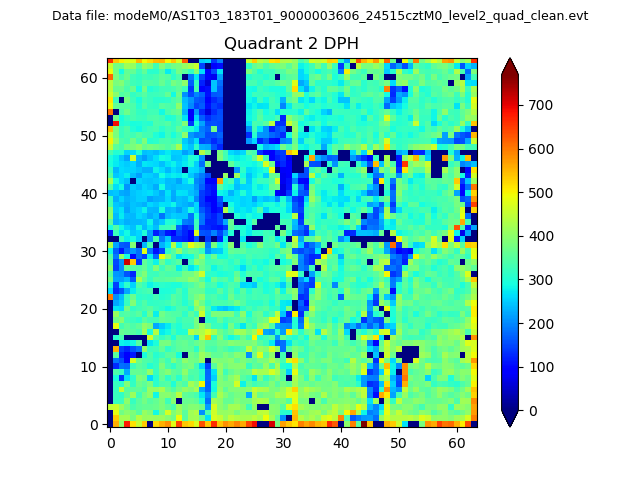
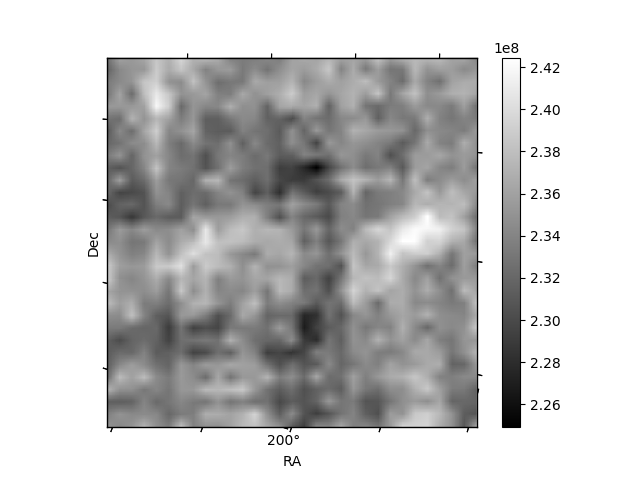
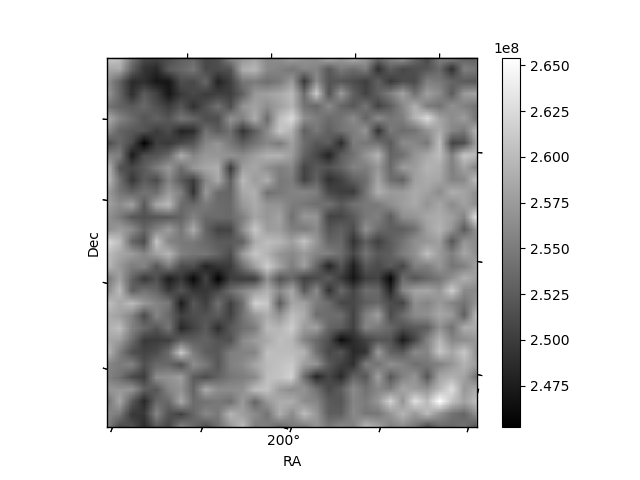
Histogram calculated using DETX and DETY for each event in the final _common_clean file
| Quadrant A | 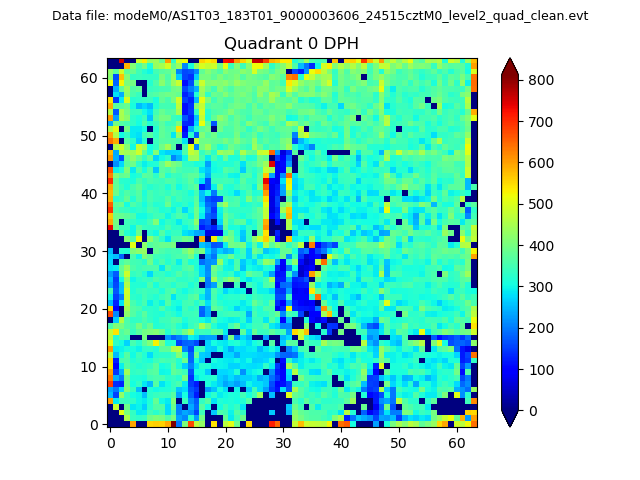 |
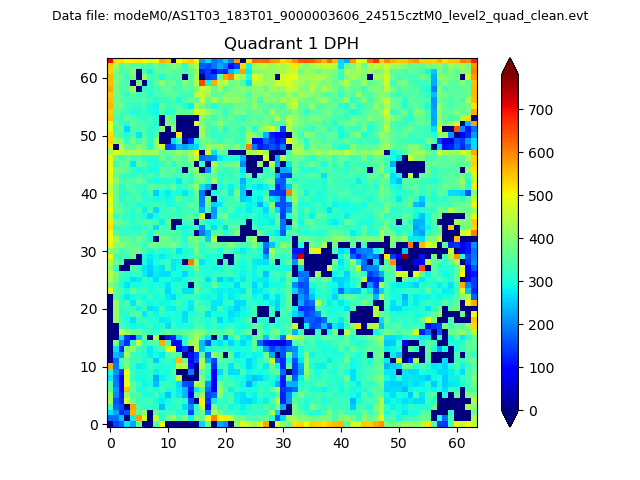 |
Quadrant B |
|---|---|---|---|
| Quadrant D | 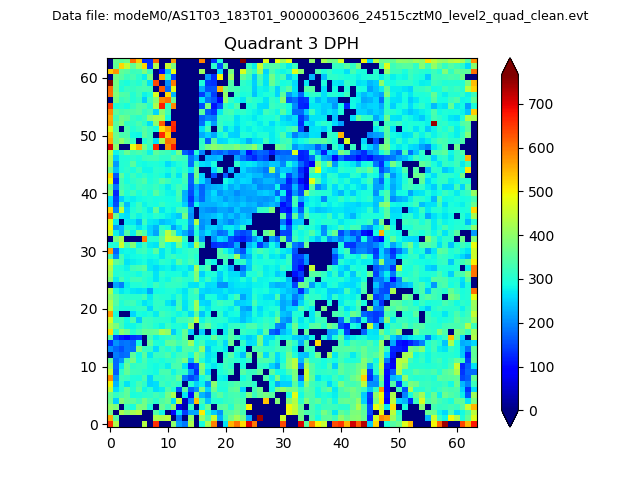 |
 |
Quadrant C |
| Plot type | Count rate plots | Images |
|---|---|---|
| Comparison with Poisson distribution Blue bars denote a histogram of data divided into 1 sec bins. Red curve is a Poisson curve with rate = median count rate of data. |
 |
 |
| Quadrant-wise count rates Data is divided into 100 sec bins |
 |
|
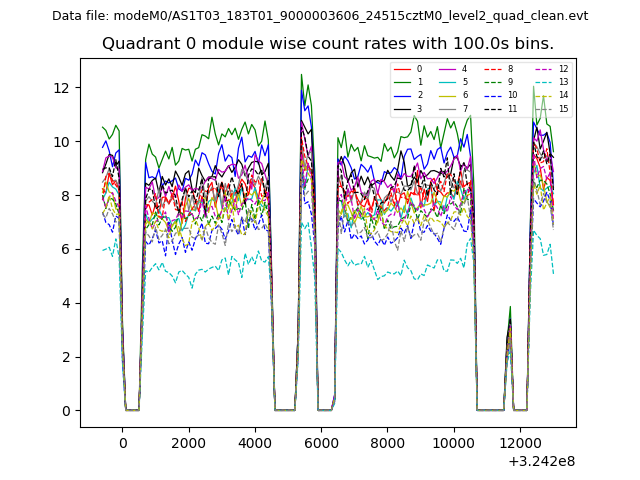
| Module-wise count rates for Quadrant A Data is divided into 100 sec bins |
 |
 |
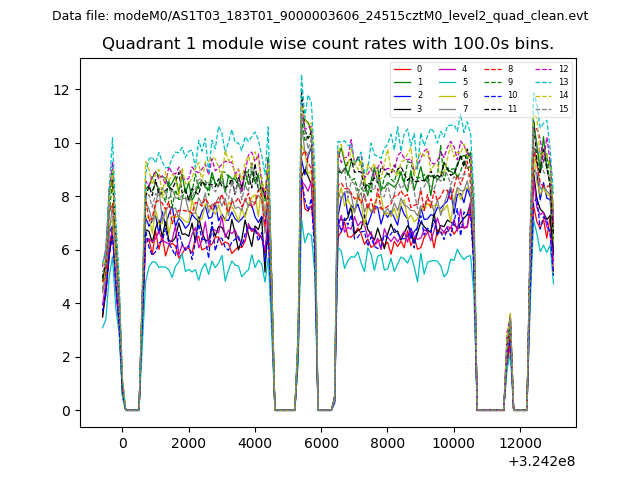
| Module-wise count rates for Quadrant B Data is divided into 100 sec bins |
 |
 |
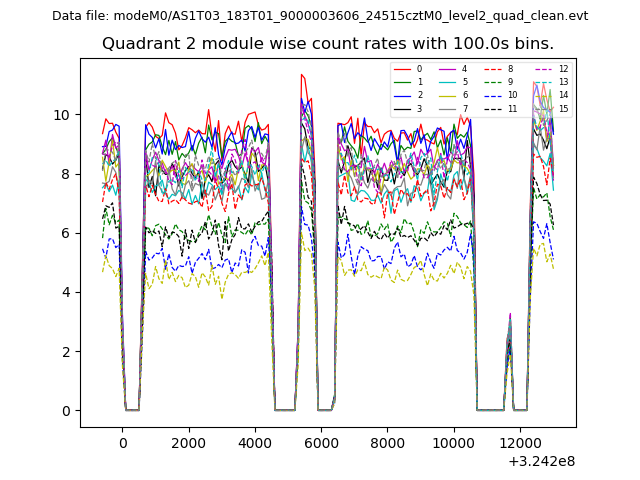
| Module-wise count rates for Quadrant C Data is divided into 100 sec bins |
 |
 |
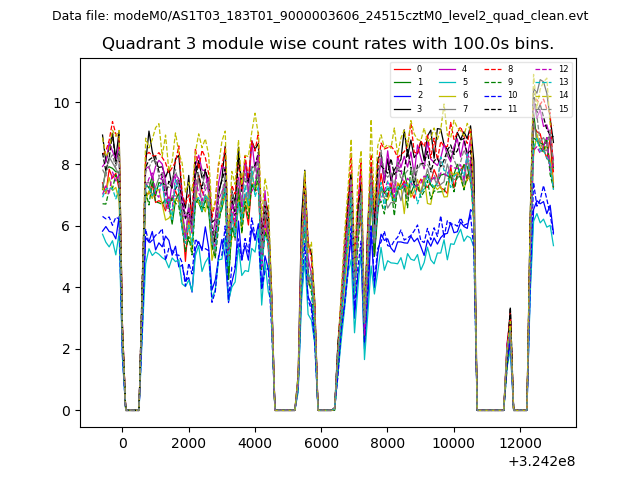
| Module-wise count rates for Quadrant D Data is divided into 100 sec bins |
 |
 |
| Parameter | Plot |
|---|---|
| CZT HV Monitor | 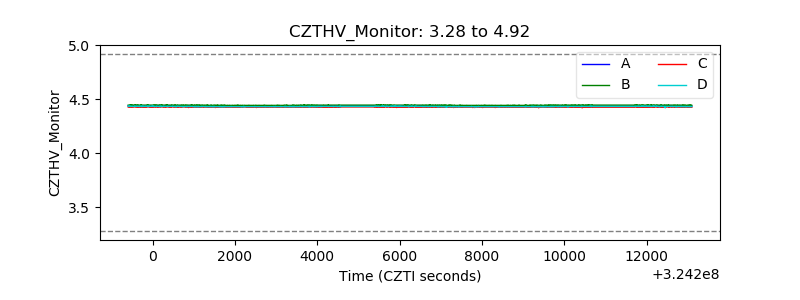 |
| D_VDD | 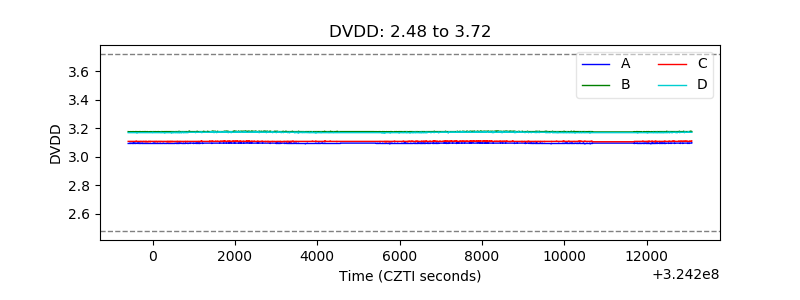 |
| Temperature 1 | 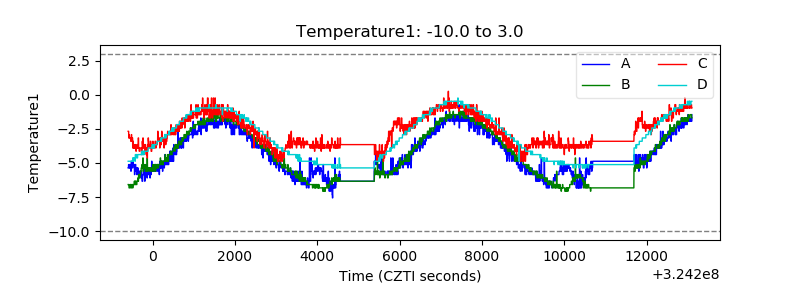 |
| Veto HV Monitor | 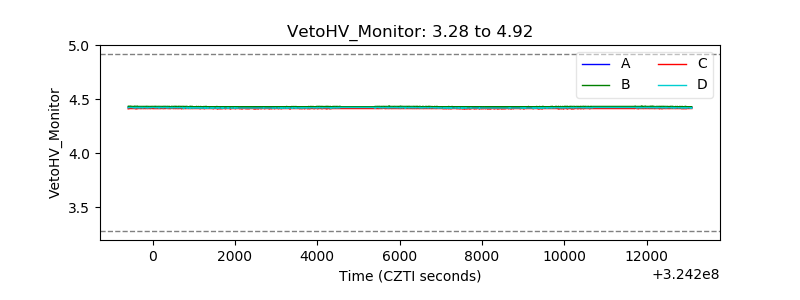 |
| Veto LLD | 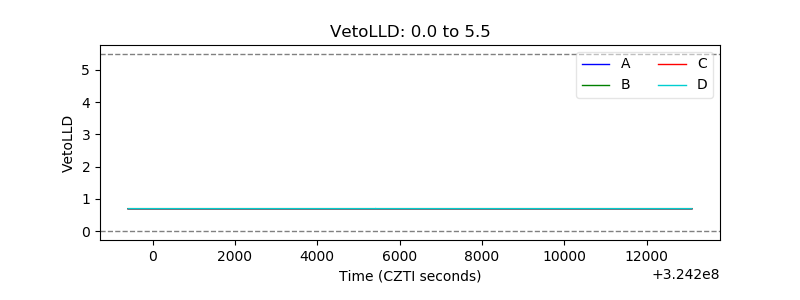 |
| Alpha Counter |  |
| _CPM_Rate | 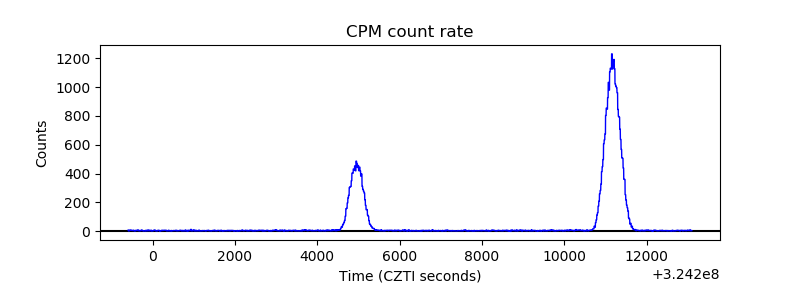 |
| CZT Counter | 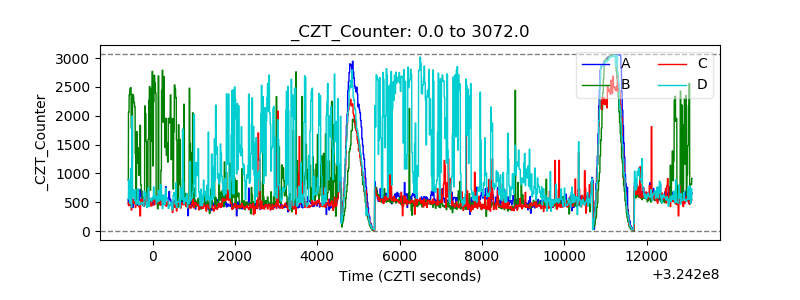 |
| +2.5 Volts monitor |  |
| +5 Volts monitor |  |
| _ROLL_ROT | 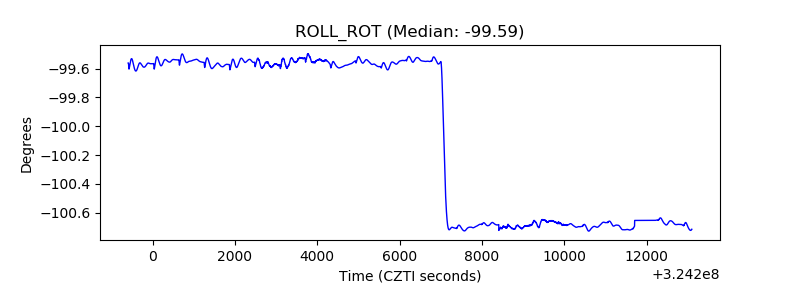 |
| _Roll_DEC | 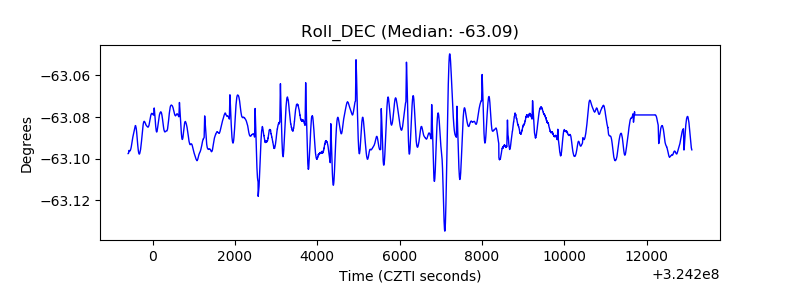 |
| _Roll_RA |  |
| Veto Counter | 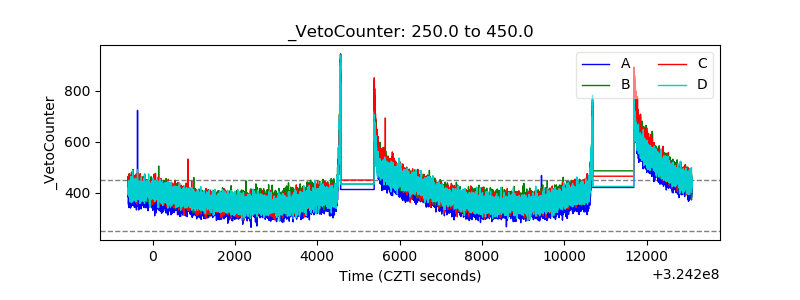 |