| Param | Original file | Final file |
|---|---|---|
| Filename | modeM0/AS1T03_183T01_9000003606_24517cztM0_level2.evt | modeM0/AS1T03_183T01_9000003606_24517cztM0_level2_quad_clean.evt |
| Size (bytes) | 552,182,400 | 118,480,320 |
| Size | 526.6 MB | 113.0 MB |
| Events in quadrant A | 3,422,249 | 817,562 |
| Events in quadrant B | 5,622,433 | 783,178 |
| Events in quadrant C | 3,099,915 | 790,230 |
| Events in quadrant D | 4,163,333 | 769,529 |
| Mode M0 | |||
|---|---|---|---|
| Quadrant | BADHDUFLAG | Total packets | Discarded packets |
| A | 0 | 14228 | 1 |
| B | 0 | 20830 | 3 |
| C | 0 | 13267 | 1 |
| D | 0 | 16390 | 1 |
| Mode SS | |||
|---|---|---|---|
| Quadrant | BADHDUFLAG | Total packets | Discarded packets |
| A | 0 | 124 | 0 |
| B | 0 | 124 | 0 |
| C | 0 | 124 | 0 |
| D | 0 | 124 | 0 |
| Mode M9 | |||
|---|---|---|---|
| Quadrant | BADHDUFLAG | Total packets | Discarded packets |
| A | 0 | 11 | 0 |
| B | 0 | 11 | 0 |
| C | 0 | 11 | 0 |
| D | 0 | 11 | 0 |
| Quadrant | Total seconds | Saturated seconds | Saturation percentage |
|---|---|---|---|
| A | 6130 | 45 | 0.734095% |
| B | 6130 | 759 | 12.381729% |
| C | 6130 | 72 | 1.174551% |
| D | 6130 | 106 | 1.729201% |
Noise dominated data is calculated using 1-second bins in cleaned event files. If a bin has >2000 counts, and if more than 50% of those come from <1% of pixels, then it is considered to be noise-dominated and hence unusable.
| Quadrant | # 1 sec bins | Bins with >0 counts | Bins with >2000 counts | High rate bins dominated by noise | Noise dominated (total time) | Noise dominated (detector-on time) | Marked lightcurve |
|---|---|---|---|---|---|---|---|
| A | 7260 | 6131 | 0 | 0 | 0.00% | 0.00% | 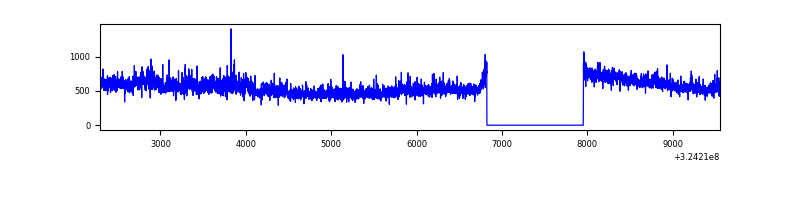 |
| B | 7260 | 6131 | 465 | 465 | 6.40% | 7.58% | 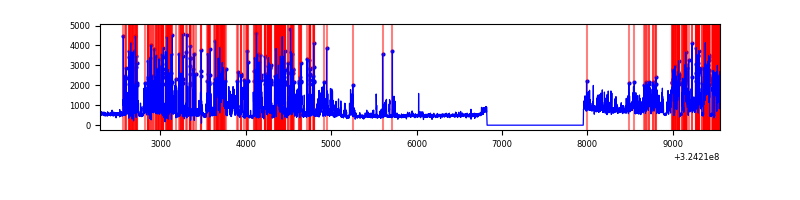 |
| C | 7260 | 6131 | 1 | 1 | 0.01% | 0.02% | 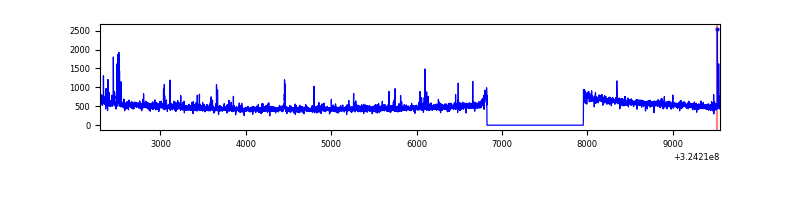 |
| D | 7260 | 6131 | 90 | 90 | 1.24% | 1.47% | 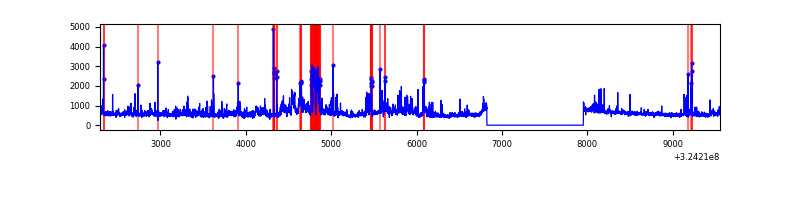 |
Top three noisy pixels from each quadrant. If the there are fewer than three noisy pixels in the level2.evt file, extra rows are filled as -1
| Pixel properties | Quadrant properties | ||||||
|---|---|---|---|---|---|---|---|
| Quadrant | DetID | PixID | Counts | Sigma | Mean | Median | Sigma |
| A | 14 | 111 | 389515 | 2496.89 | 781 | 768 | 155.7 |
| A | 6 | 16 | 23355 | 145.07 | 781 | 768 | 155.7 |
| A | 13 | 254 | 9768 | 57.81 | 781 | 768 | 155.7 |
| B | 3 | 64 | 2564194 | 18465.91 | 744 | 727 | 138.8 |
| B | 0 | 190 | 127514 | 913.31 | 744 | 727 | 138.8 |
| B | 12 | 111 | 16320 | 112.32 | 744 | 727 | 138.8 |
| C | 14 | 238 | 119216 | 698.31 | 737 | 743 | 169.7 |
| C | 10 | 9 | 57121 | 332.31 | 737 | 743 | 169.7 |
| C | 2 | 16 | 38803 | 224.34 | 737 | 743 | 169.7 |
| D | 1 | 52 | 745274 | 4143.99 | 748 | 727 | 179.7 |
| D | 12 | 218 | 327602 | 1819.32 | 748 | 727 | 179.7 |
| D | 8 | 195 | 209855 | 1163.96 | 748 | 727 | 179.7 |
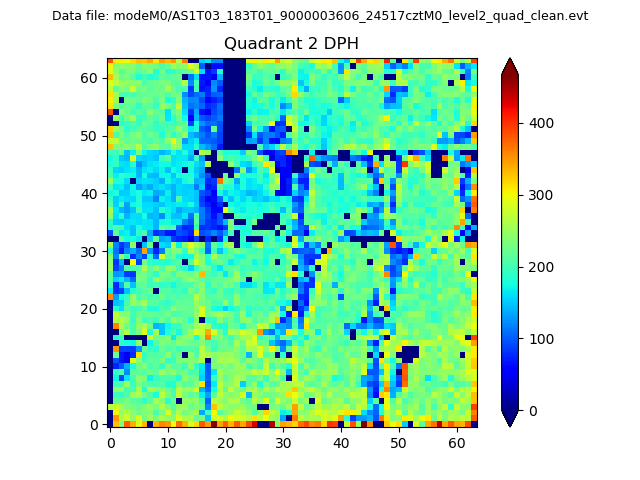
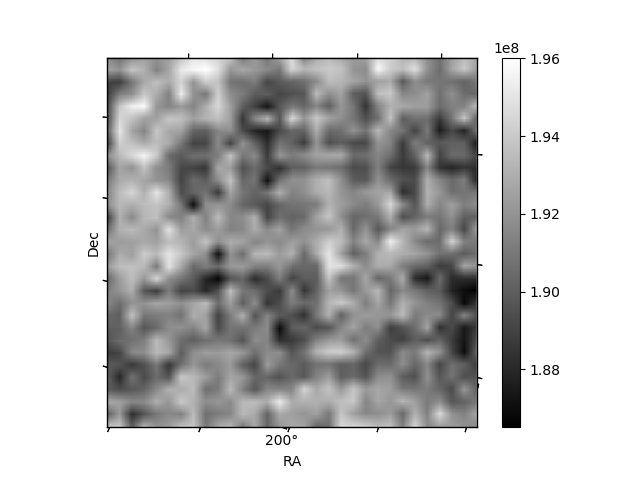
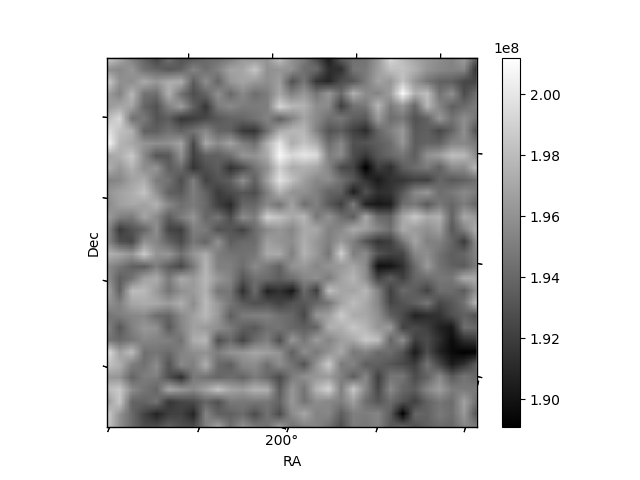
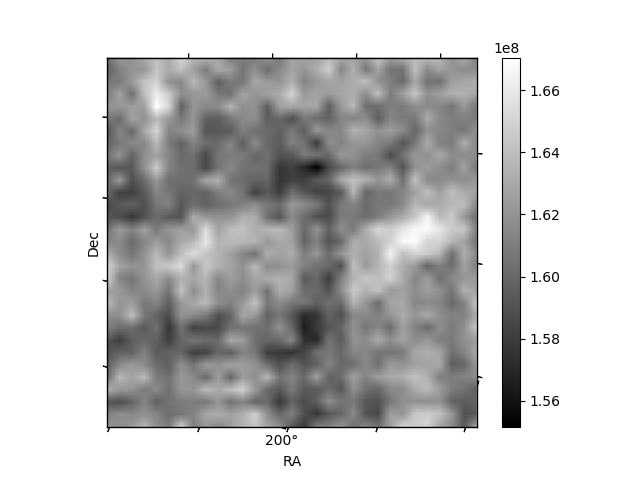
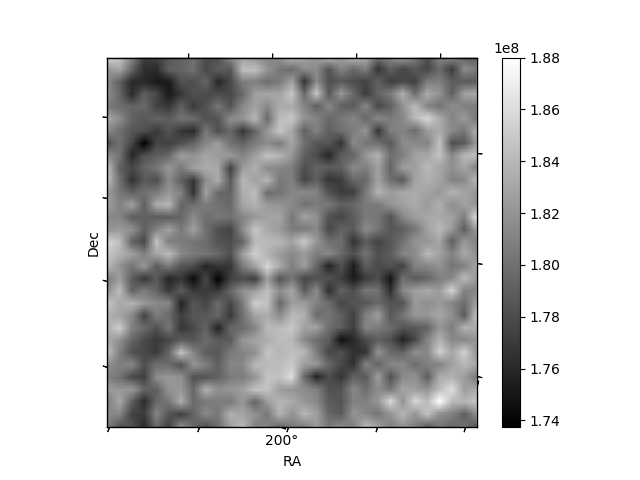
Histogram calculated using DETX and DETY for each event in the final _common_clean file
| Quadrant A |  |
 |
Quadrant B |
|---|---|---|---|
| Quadrant D |  |
 |
Quadrant C |
| Plot type | Count rate plots | Images |
|---|---|---|
| Comparison with Poisson distribution Blue bars denote a histogram of data divided into 1 sec bins. Red curve is a Poisson curve with rate = median count rate of data. |
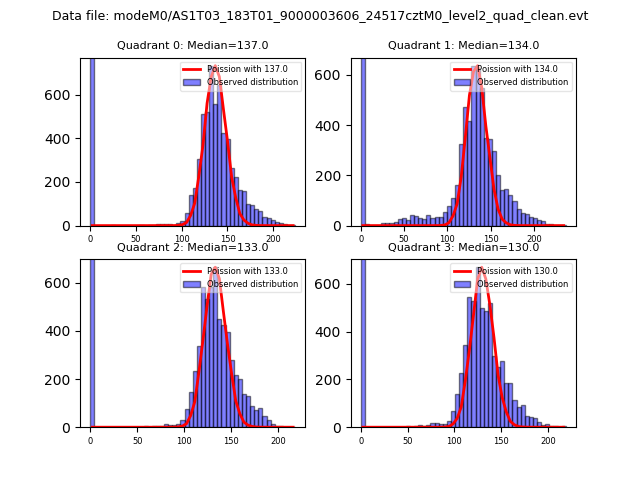 |
 |
| Quadrant-wise count rates Data is divided into 100 sec bins |
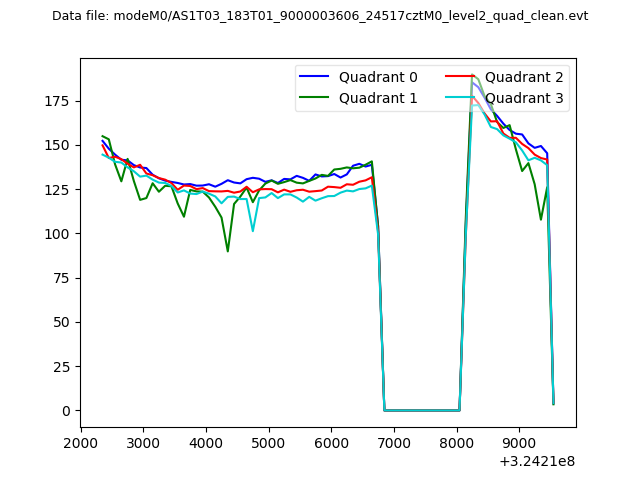 |
|
| Module-wise count rates for Quadrant A Data is divided into 100 sec bins |
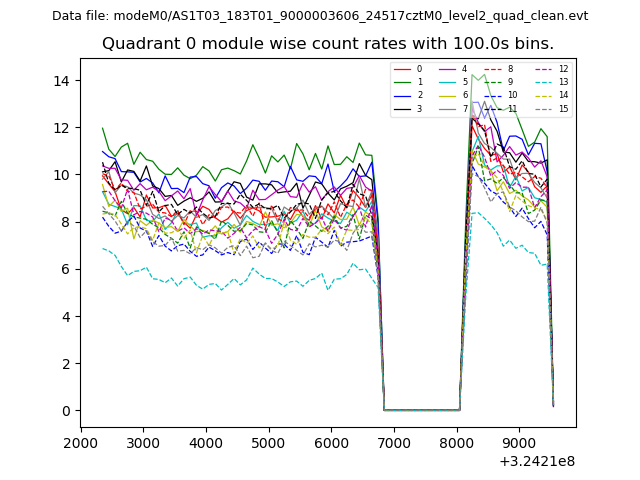 |
 |
| Module-wise count rates for Quadrant B Data is divided into 100 sec bins |
 |
 |
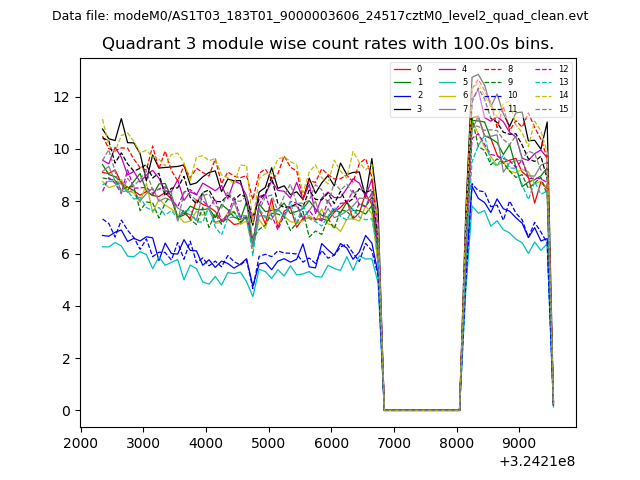
| Module-wise count rates for Quadrant C Data is divided into 100 sec bins |
 |
 |
| Module-wise count rates for Quadrant D Data is divided into 100 sec bins |
 |
 |
| Parameter | Plot |
|---|---|
| CZT HV Monitor |  |
| D_VDD | 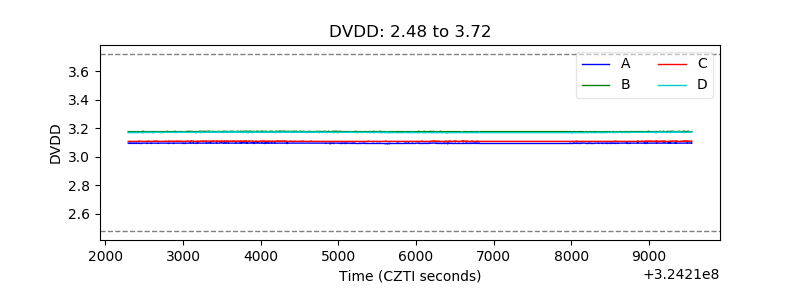 |
| Temperature 1 | 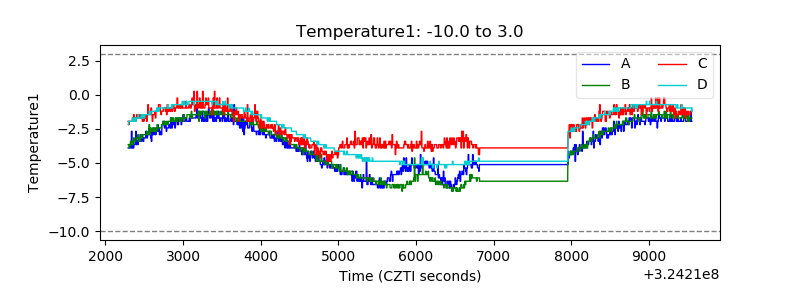 |
| Veto HV Monitor | 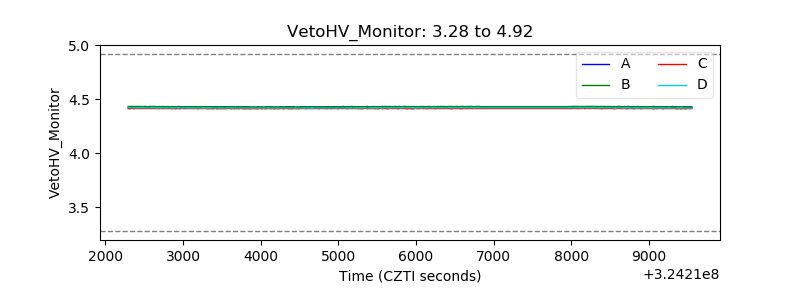 |
| Veto LLD | 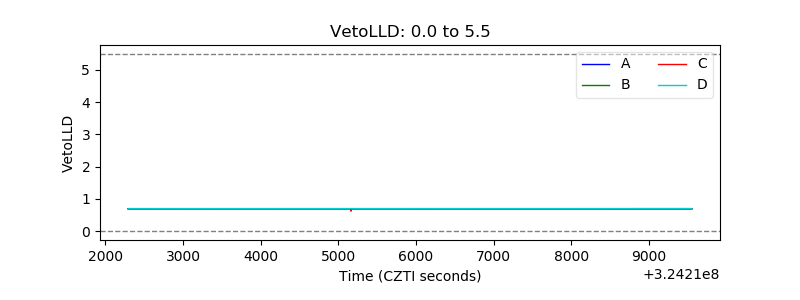 |
| Alpha Counter | 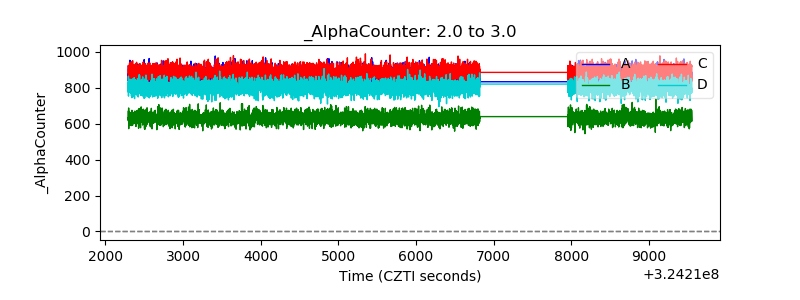 |
| _CPM_Rate | 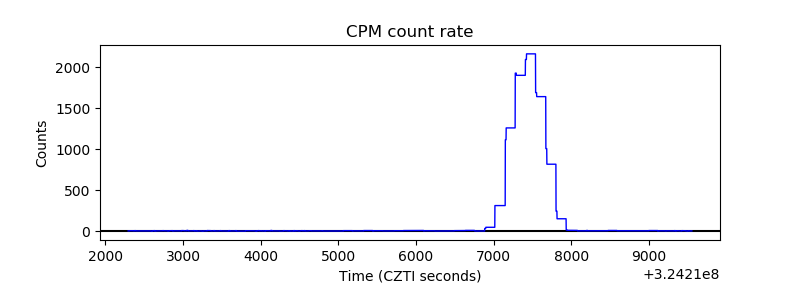 |
| CZT Counter | 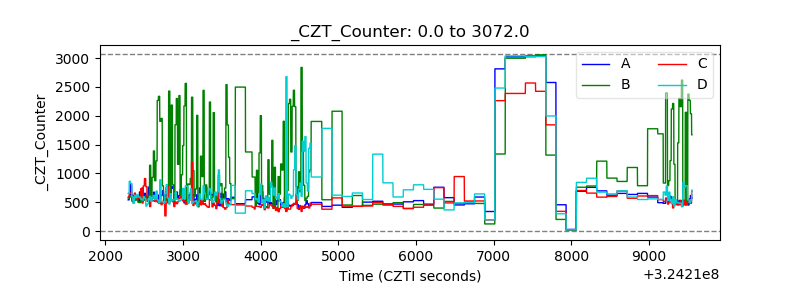 |
| +2.5 Volts monitor |  |
| +5 Volts monitor | 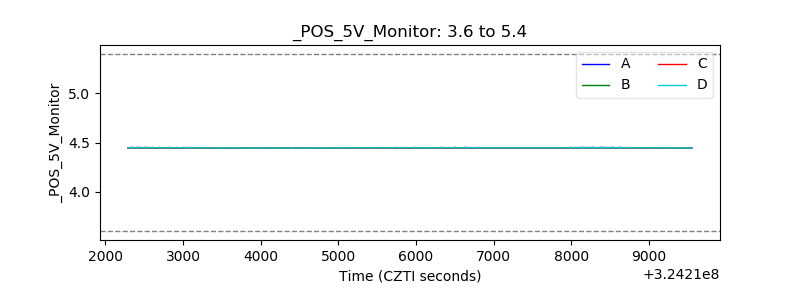 |
| _ROLL_ROT | 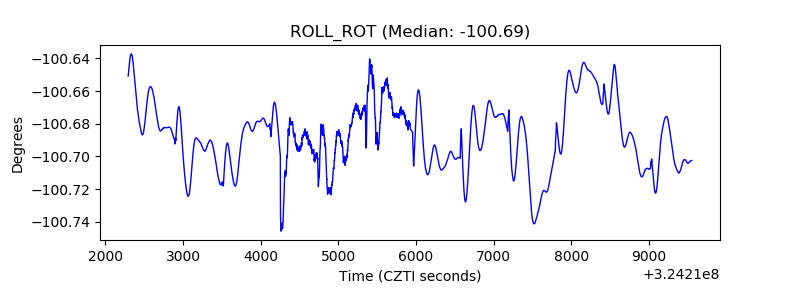 |
| _Roll_DEC | 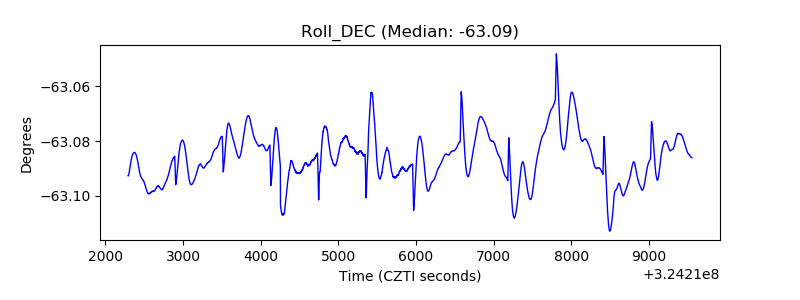 |
| _Roll_RA | 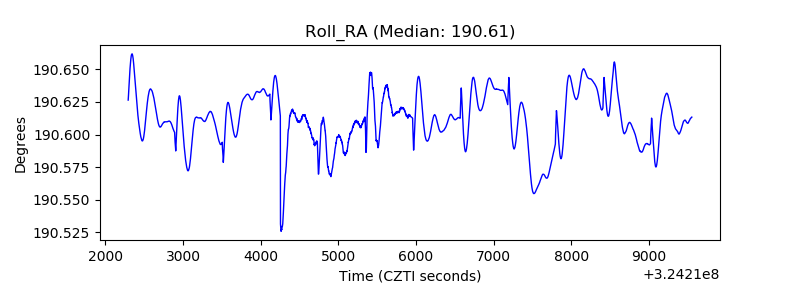 |
| Veto Counter | 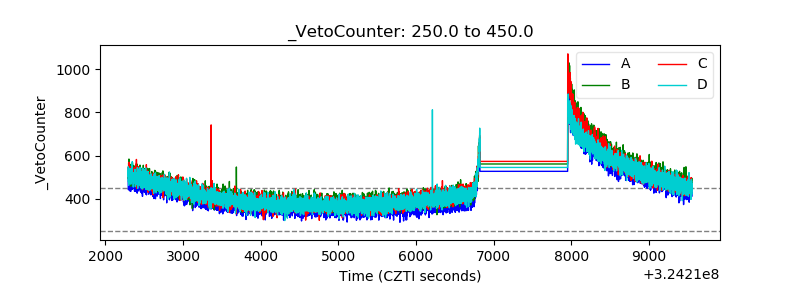 |