| Param | Original file | Final file |
|---|---|---|
| Filename | modeM0/AS1T03_183T01_9000003606_24518cztM0_level2.evt | modeM0/AS1T03_183T01_9000003606_24518cztM0_level2_quad_clean.evt |
| Size (bytes) | 740,246,400 | 130,636,800 |
| Size | 706.0 MB | 124.6 MB |
| Events in quadrant A | 3,581,994 | 968,275 |
| Events in quadrant B | 9,059,681 | 776,777 |
| Events in quadrant C | 3,372,899 | 921,626 |
| Events in quadrant D | 5,979,028 | 849,691 |
| Mode M0 | |||
|---|---|---|---|
| Quadrant | BADHDUFLAG | Total packets | Discarded packets |
| A | 0 | 14893 | 1 |
| B | 0 | 31295 | 7 |
| C | 0 | 14121 | 1 |
| D | 0 | 22020 | 1 |
| Mode SS | |||
|---|---|---|---|
| Quadrant | BADHDUFLAG | Total packets | Discarded packets |
| A | 0 | 128 | 0 |
| B | 0 | 128 | 0 |
| C | 0 | 128 | 0 |
| D | 0 | 128 | 0 |
| Mode M9 | |||
|---|---|---|---|
| Quadrant | BADHDUFLAG | Total packets | Discarded packets |
| A | 0 | 12 | 0 |
| B | 0 | 12 | 0 |
| C | 0 | 12 | 0 |
| D | 0 | 12 | 0 |
| Quadrant | Total seconds | Saturated seconds | Saturation percentage |
|---|---|---|---|
| A | 6293 | 74 | 1.175910% |
| B | 6293 | 2413 | 38.344192% |
| C | 6293 | 99 | 1.573177% |
| D | 6293 | 439 | 6.976005% |
Noise dominated data is calculated using 1-second bins in cleaned event files. If a bin has >2000 counts, and if more than 50% of those come from <1% of pixels, then it is considered to be noise-dominated and hence unusable.
| Quadrant | # 1 sec bins | Bins with >0 counts | Bins with >2000 counts | High rate bins dominated by noise | Noise dominated (total time) | Noise dominated (detector-on time) | Marked lightcurve |
|---|---|---|---|---|---|---|---|
| A | 7508 | 6294 | 1 | 1 | 0.01% | 0.02% | 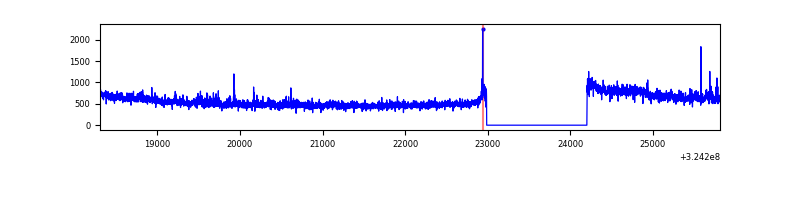 |
| B | 7508 | 6294 | 1753 | 1753 | 23.35% | 27.85% | 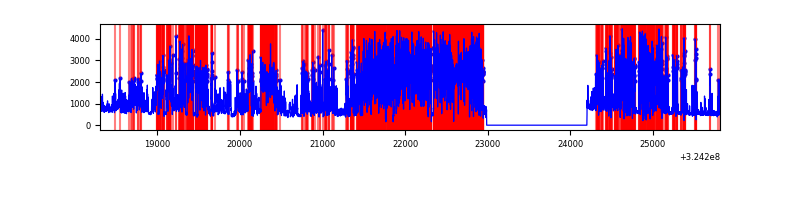 |
| C | 7508 | 6294 | 6 | 6 | 0.08% | 0.10% | 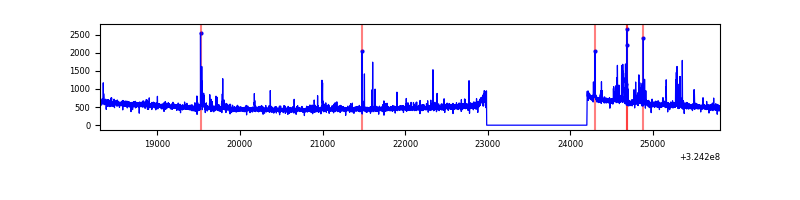 |
| D | 7508 | 6294 | 418 | 418 | 5.57% | 6.64% | 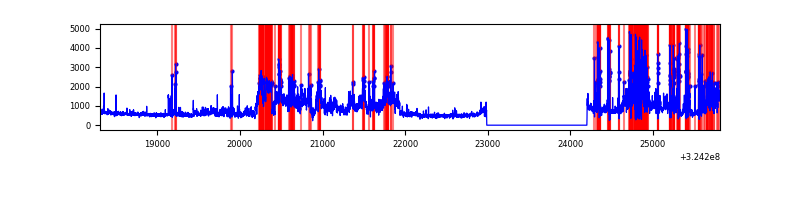 |
Top three noisy pixels from each quadrant. If the there are fewer than three noisy pixels in the level2.evt file, extra rows are filled as -1
| Pixel properties | Quadrant properties | ||||||
|---|---|---|---|---|---|---|---|
| Quadrant | DetID | PixID | Counts | Sigma | Mean | Median | Sigma |
| A | 14 | 111 | 313512 | 1884.33 | 840 | 827 | 165.9 |
| A | 6 | 16 | 23380 | 135.91 | 840 | 827 | 165.9 |
| A | 13 | 254 | 9890 | 54.62 | 840 | 827 | 165.9 |
| B | 3 | 64 | 6133066 | 49186.73 | 681 | 667 | 124.7 |
| B | 12 | 17 | 160779 | 1284.22 | 681 | 667 | 124.7 |
| B | 5 | 172 | 42114 | 332.43 | 681 | 667 | 124.7 |
| C | 14 | 238 | 129801 | 722.81 | 784 | 789 | 178.5 |
| C | 10 | 9 | 123576 | 687.93 | 784 | 789 | 178.5 |
| C | 2 | 16 | 52825 | 291.54 | 784 | 789 | 178.5 |
| D | 1 | 52 | 2909649 | 15844.33 | 765 | 744 | 183.6 |
| D | 8 | 195 | 98552 | 532.74 | 765 | 744 | 183.6 |
| D | 9 | 1 | 35666 | 190.21 | 765 | 744 | 183.6 |
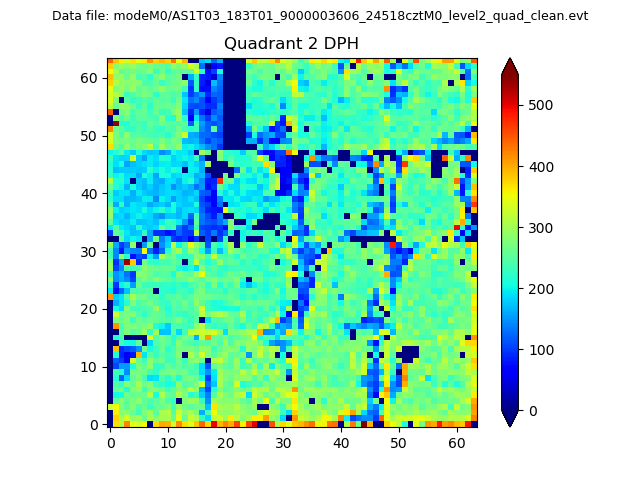
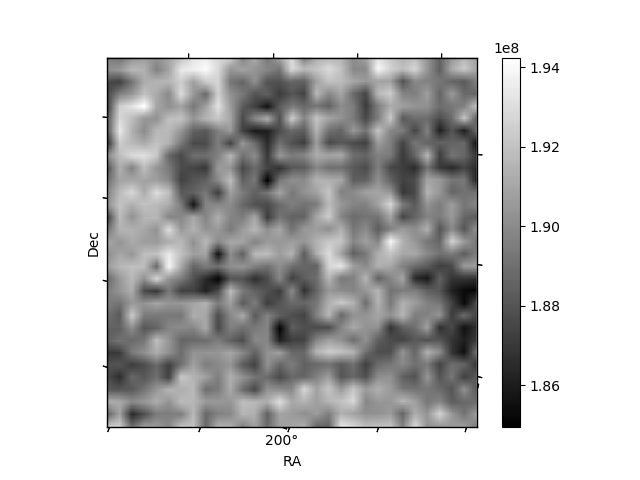
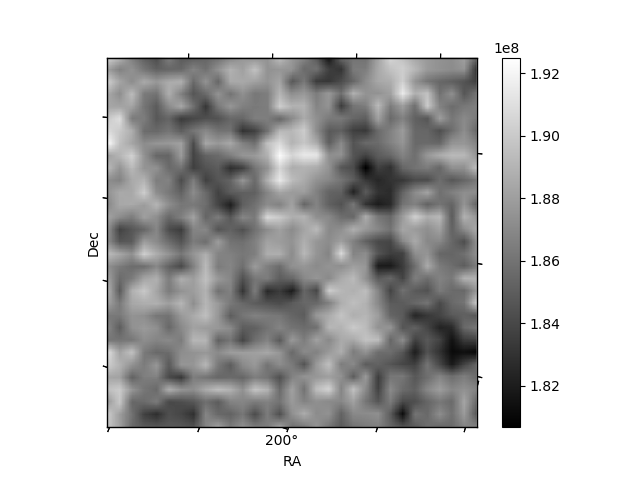
Histogram calculated using DETX and DETY for each event in the final _common_clean file
| Quadrant A |  |
 |
Quadrant B |
|---|---|---|---|
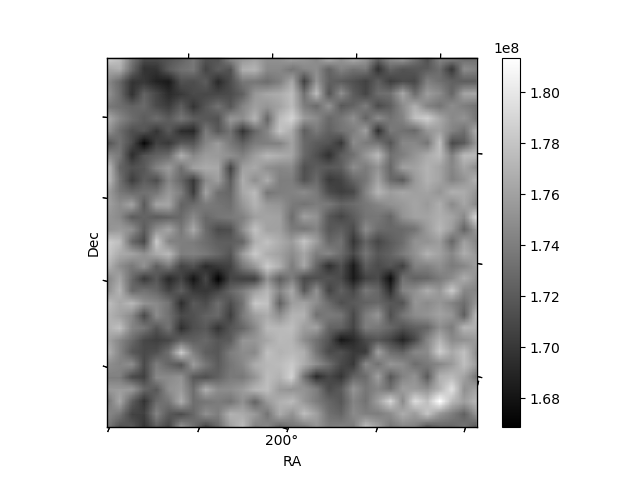
| Quadrant D | 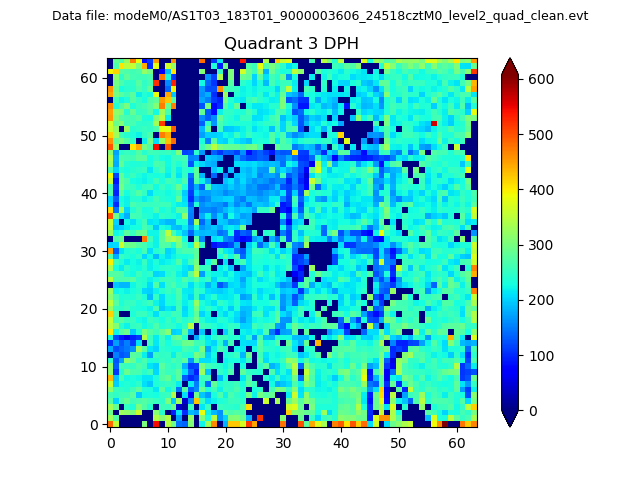 |
 |
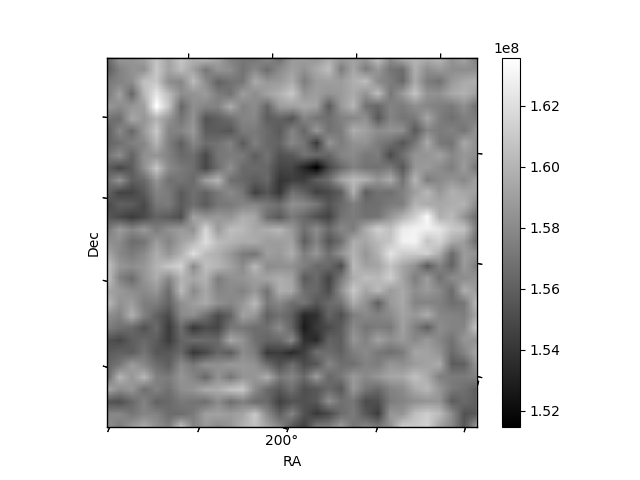
Quadrant C |
| Plot type | Count rate plots | Images |
|---|---|---|
| Comparison with Poisson distribution Blue bars denote a histogram of data divided into 1 sec bins. Red curve is a Poisson curve with rate = median count rate of data. |
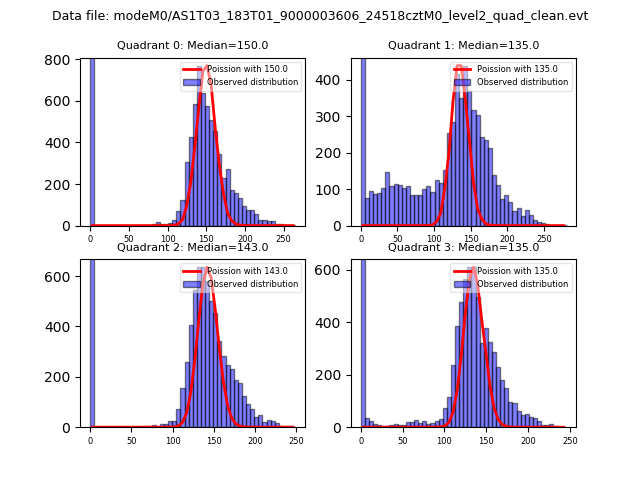 |
 |
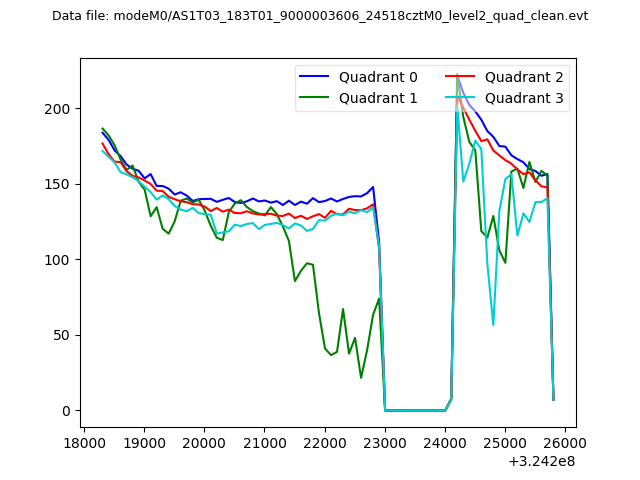
| Quadrant-wise count rates Data is divided into 100 sec bins |
 |
|
| Module-wise count rates for Quadrant A Data is divided into 100 sec bins |
 |
 |
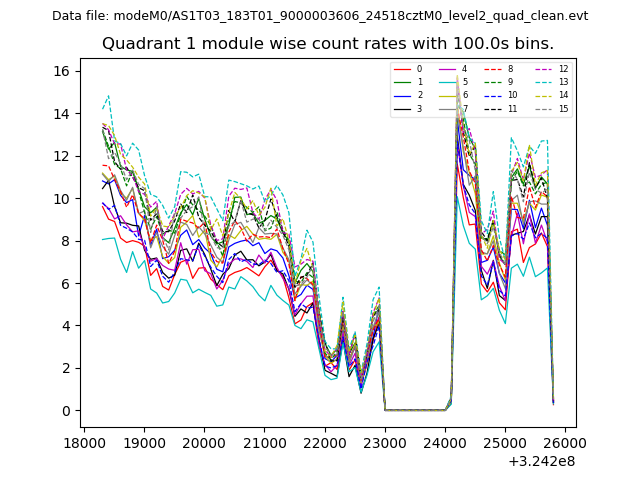
| Module-wise count rates for Quadrant B Data is divided into 100 sec bins |
 |
 |
| Module-wise count rates for Quadrant C Data is divided into 100 sec bins |
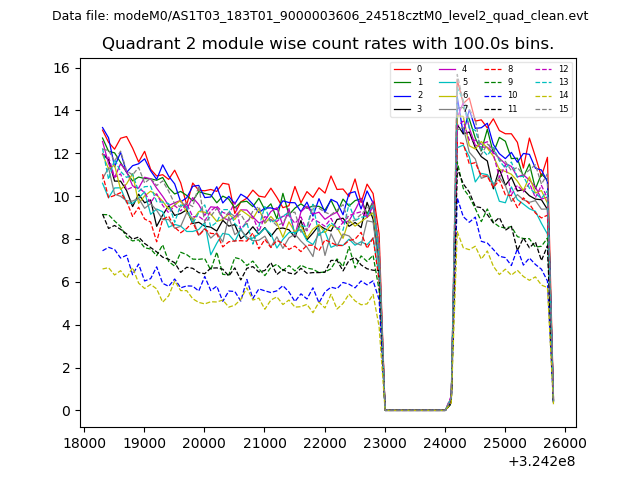 |
 |
| Module-wise count rates for Quadrant D Data is divided into 100 sec bins |
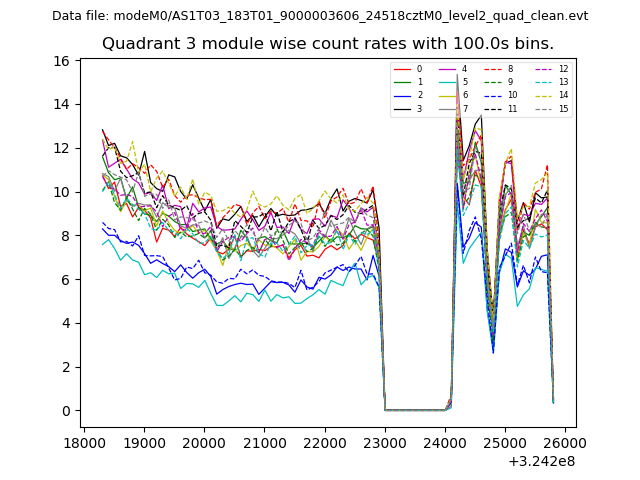 |
 |
| Parameter | Plot |
|---|---|
| CZT HV Monitor |  |
| D_VDD | 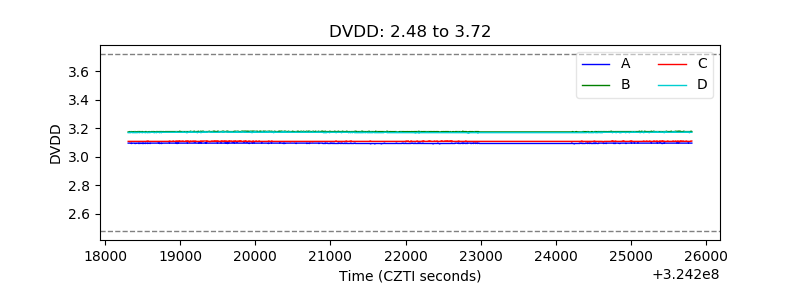 |
| Temperature 1 | 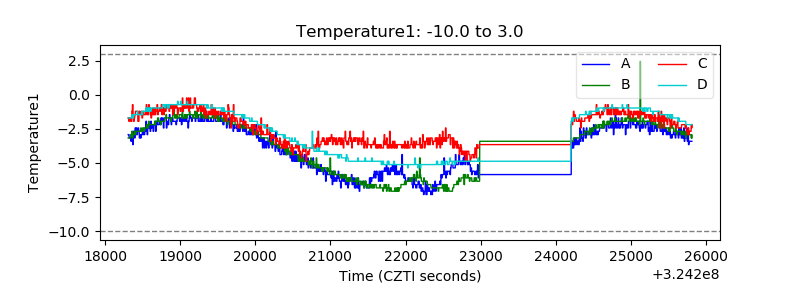 |
| Veto HV Monitor | 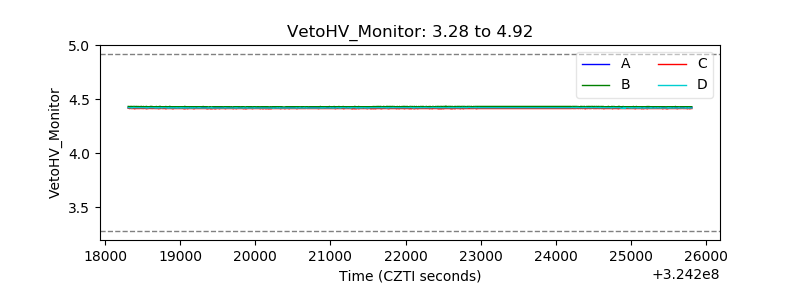 |
| Veto LLD | 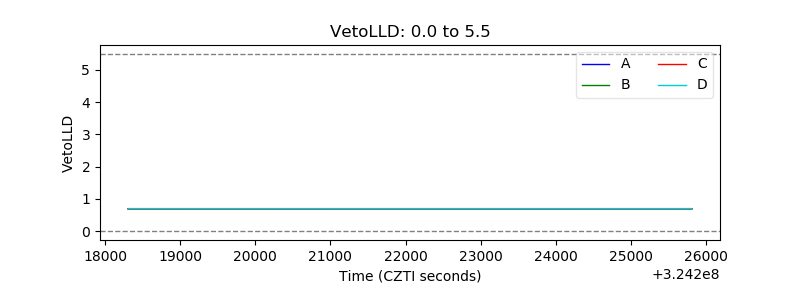 |
| Alpha Counter | 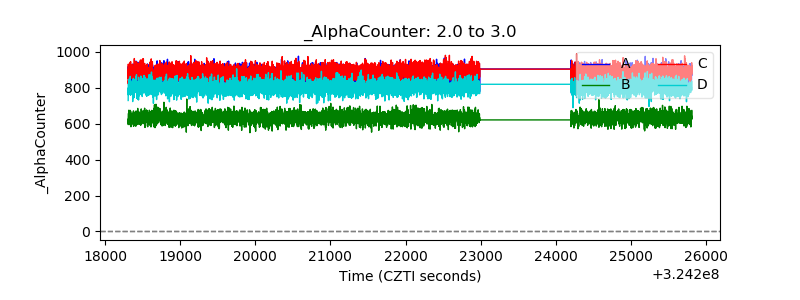 |
| _CPM_Rate | 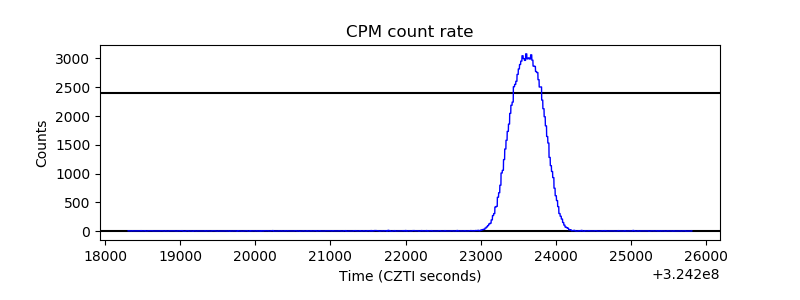 |
| CZT Counter | 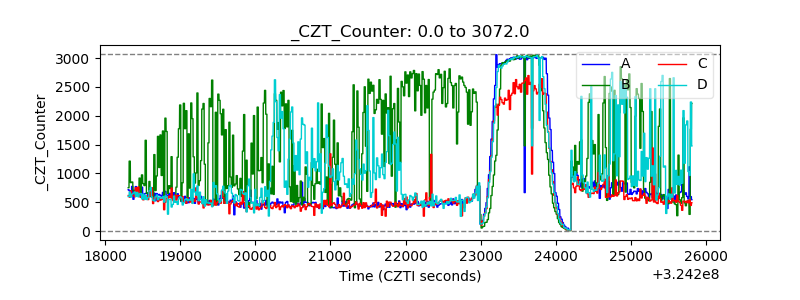 |
| +2.5 Volts monitor |  |
| +5 Volts monitor | 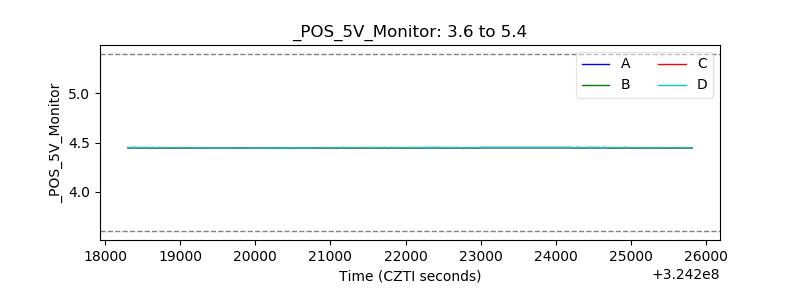 |
| _ROLL_ROT | 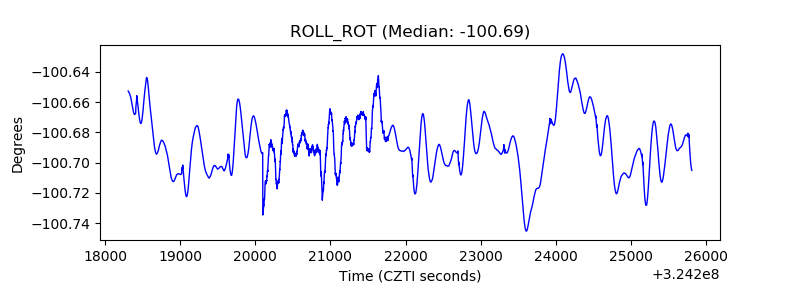 |
| _Roll_DEC | 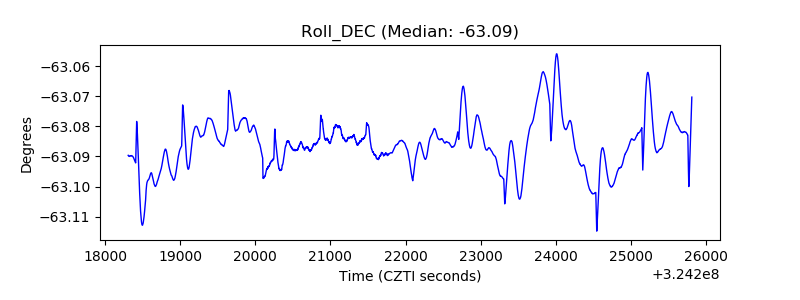 |
| _Roll_RA | 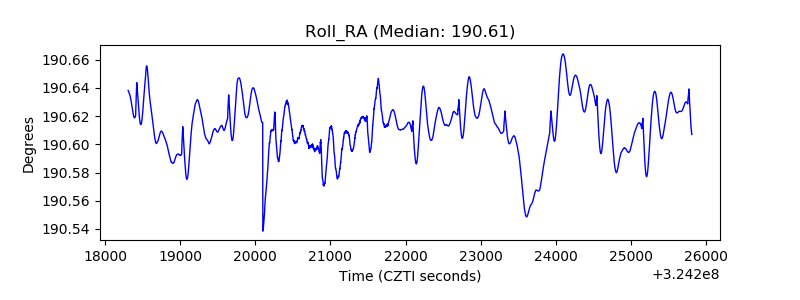 |
| Veto Counter | 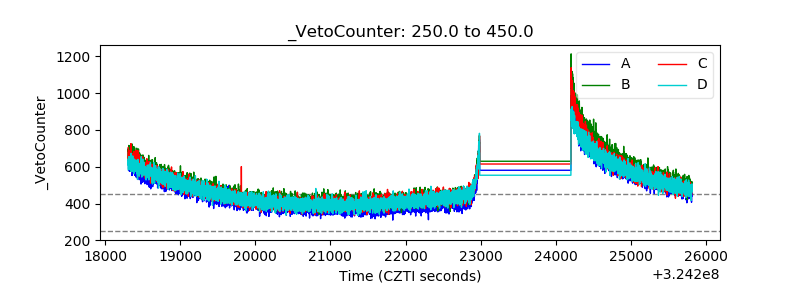 |