| Param | Original file | Final file |
|---|---|---|
| Filename | modeM0/AS1T03_183T01_9000003606_24519cztM0_level2.evt | modeM0/AS1T03_183T01_9000003606_24519cztM0_level2_quad_clean.evt |
| Size (bytes) | 675,014,400 | 123,912,000 |
| Size | 643.7 MB | 118.2 MB |
| Events in quadrant A | 3,633,253 | 924,898 |
| Events in quadrant B | 7,240,753 | 759,848 |
| Events in quadrant C | 3,781,768 | 840,469 |
| Events in quadrant D | 5,389,951 | 816,130 |
| Mode M0 | |||
|---|---|---|---|
| Quadrant | BADHDUFLAG | Total packets | Discarded packets |
| A | 0 | 14788 | 1 |
| B | 0 | 25420 | 2 |
| C | 0 | 15016 | 1 |
| D | 0 | 20148 | 1 |
| Mode SS | |||
|---|---|---|---|
| Quadrant | BADHDUFLAG | Total packets | Discarded packets |
| A | 0 | 120 | 0 |
| B | 0 | 120 | 0 |
| C | 0 | 120 | 0 |
| D | 0 | 120 | 0 |
| Mode M9 | |||
|---|---|---|---|
| Quadrant | BADHDUFLAG | Total packets | Discarded packets |
| A | 0 | 13 | 0 |
| B | 0 | 13 | 0 |
| C | 0 | 13 | 0 |
| D | 0 | 13 | 0 |
| Quadrant | Total seconds | Saturated seconds | Saturation percentage |
|---|---|---|---|
| A | 5875 | 91 | 1.548936% |
| B | 5875 | 1884 | 32.068085% |
| C | 5875 | 408 | 6.944681% |
| D | 5875 | 388 | 6.604255% |
Noise dominated data is calculated using 1-second bins in cleaned event files. If a bin has >2000 counts, and if more than 50% of those come from <1% of pixels, then it is considered to be noise-dominated and hence unusable.
| Quadrant | # 1 sec bins | Bins with >0 counts | Bins with >2000 counts | High rate bins dominated by noise | Noise dominated (total time) | Noise dominated (detector-on time) | Marked lightcurve |
|---|---|---|---|---|---|---|---|
| A | 7180 | 5876 | 0 | 0 | 0.00% | 0.00% | 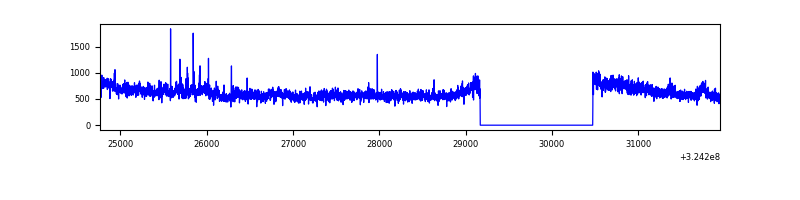 |
| B | 7180 | 5875 | 1359 | 1359 | 18.93% | 23.13% | 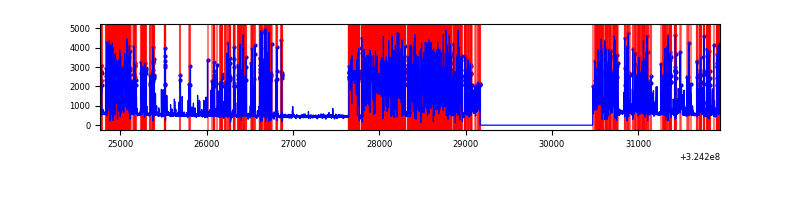 |
| C | 7180 | 5876 | 227 | 227 | 3.16% | 3.86% | 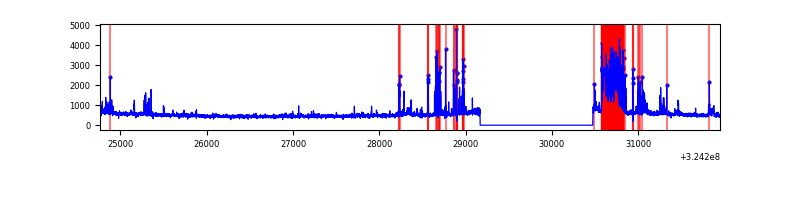 |
| D | 7180 | 5876 | 335 | 335 | 4.67% | 5.70% | 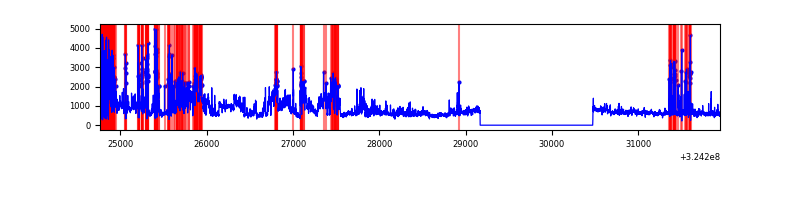 |
Top three noisy pixels from each quadrant. If the there are fewer than three noisy pixels in the level2.evt file, extra rows are filled as -1
| Pixel properties | Quadrant properties | ||||||
|---|---|---|---|---|---|---|---|
| Quadrant | DetID | PixID | Counts | Sigma | Mean | Median | Sigma |
| A | 14 | 111 | 596811 | 3856.28 | 786 | 776 | 154.6 |
| A | 13 | 254 | 9224 | 54.66 | 786 | 776 | 154.6 |
| A | 0 | 226 | 6858 | 39.35 | 786 | 776 | 154.6 |
| B | 3 | 64 | 4692677 | 39140.82 | 648 | 635 | 119.9 |
| B | 0 | 190 | 14393 | 114.77 | 648 | 635 | 119.9 |
| B | 12 | 111 | 13321 | 105.83 | 648 | 635 | 119.9 |
| C | 2 | 16 | 712862 | 4384.66 | 710 | 716 | 162.4 |
| C | 10 | 9 | 176743 | 1083.79 | 710 | 716 | 162.4 |
| C | 14 | 238 | 116391 | 712.21 | 710 | 716 | 162.4 |
| D | 1 | 52 | 2539316 | 14854.51 | 721 | 701 | 170.9 |
| D | 9 | 1 | 63560 | 367.81 | 721 | 701 | 170.9 |
| D | 8 | 195 | 32432 | 185.67 | 721 | 701 | 170.9 |
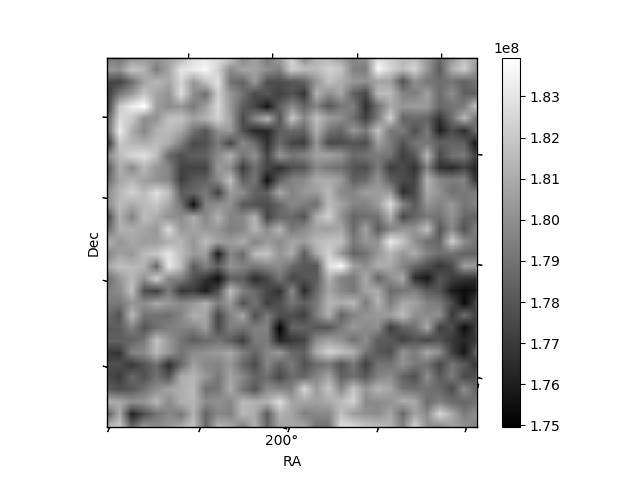
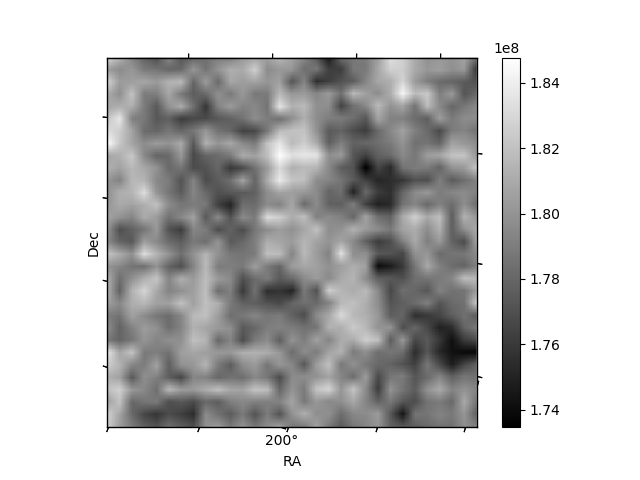
Histogram calculated using DETX and DETY for each event in the final _common_clean file
| Quadrant A | 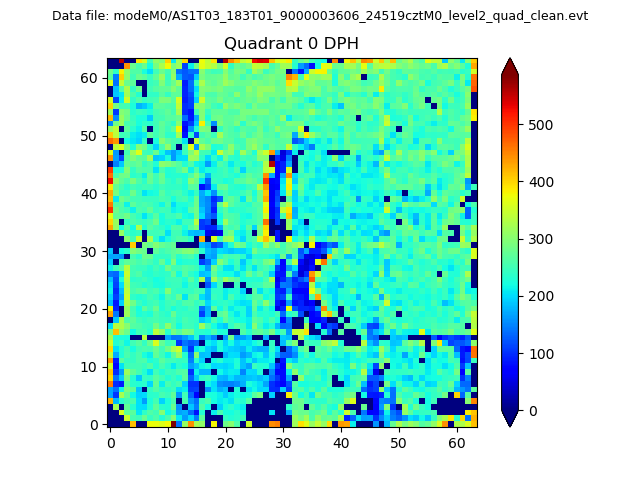 |
 |
Quadrant B |
|---|---|---|---|
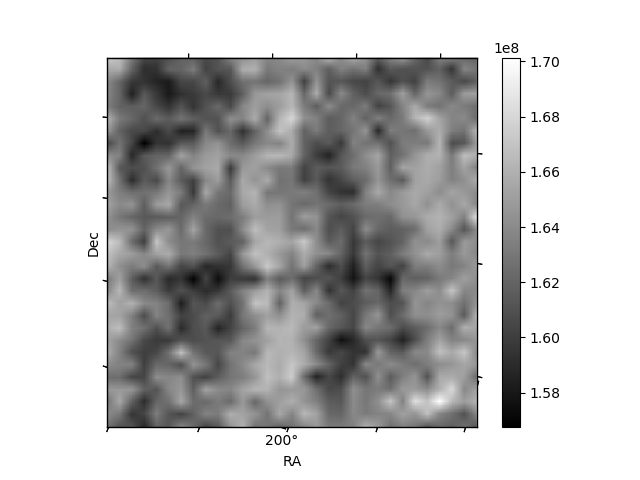
| Quadrant D | 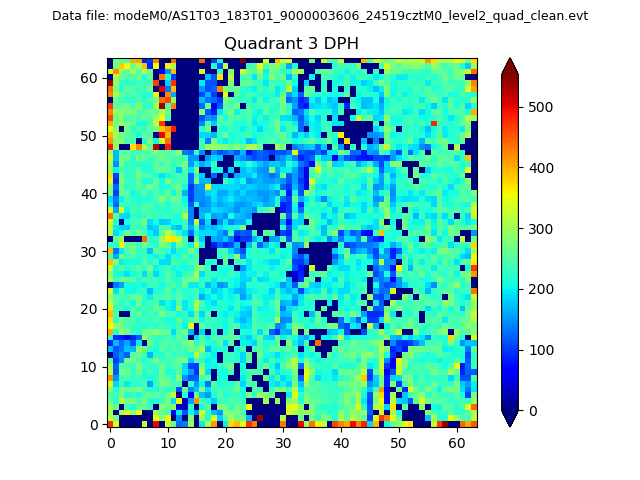 |
 |
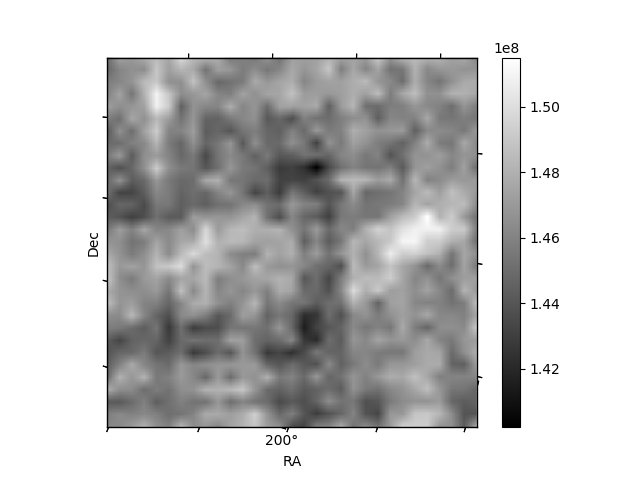
Quadrant C |
| Plot type | Count rate plots | Images |
|---|---|---|
| Comparison with Poisson distribution Blue bars denote a histogram of data divided into 1 sec bins. Red curve is a Poisson curve with rate = median count rate of data. |
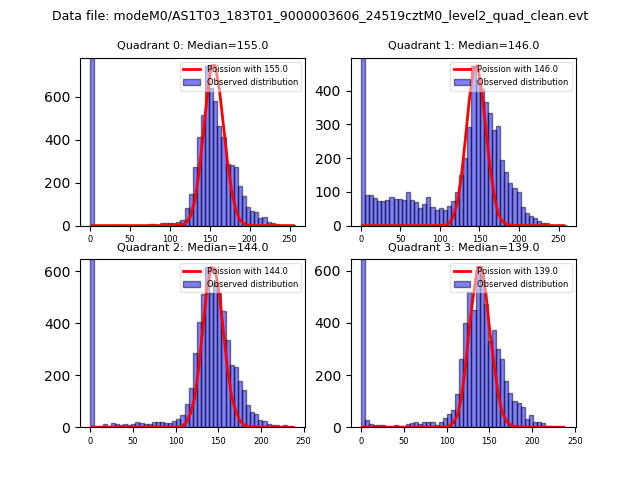 |
 |
| Quadrant-wise count rates Data is divided into 100 sec bins |
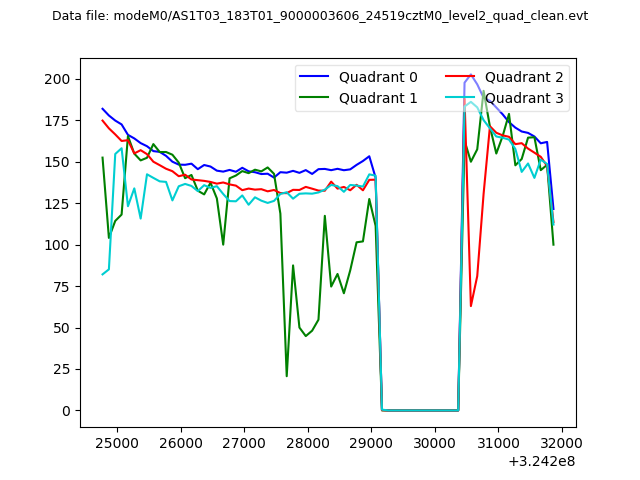 |
|
| Module-wise count rates for Quadrant A Data is divided into 100 sec bins |
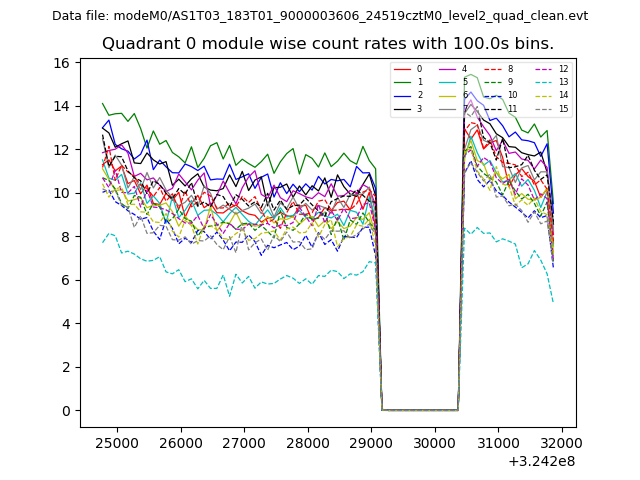 |
 |
| Module-wise count rates for Quadrant B Data is divided into 100 sec bins |
 |
 |
| Module-wise count rates for Quadrant C Data is divided into 100 sec bins |
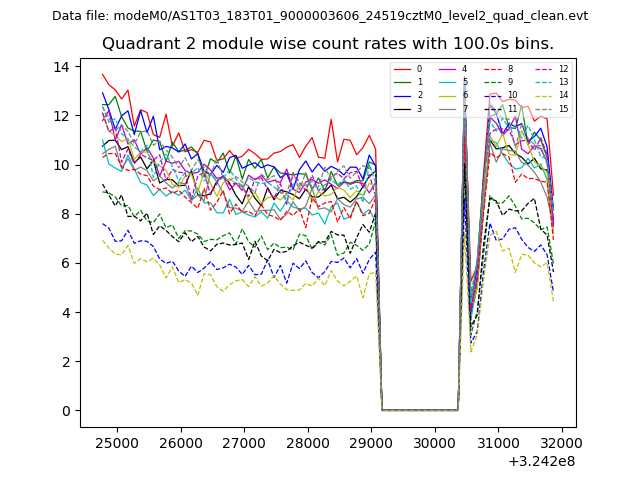 |
 |
| Module-wise count rates for Quadrant D Data is divided into 100 sec bins |
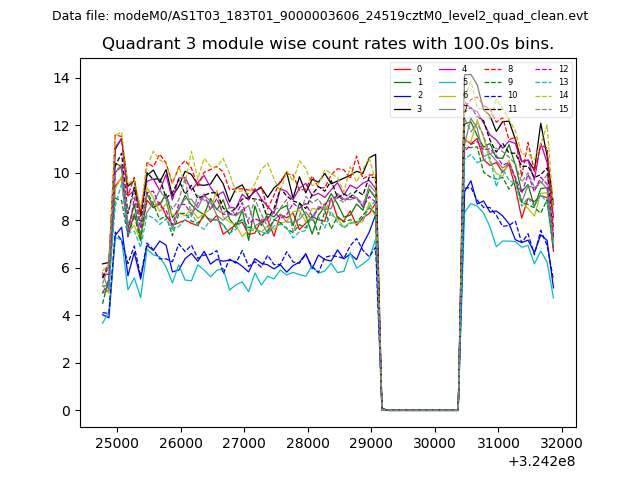 |
 |
| Parameter | Plot |
|---|---|
| CZT HV Monitor |  |
| D_VDD | 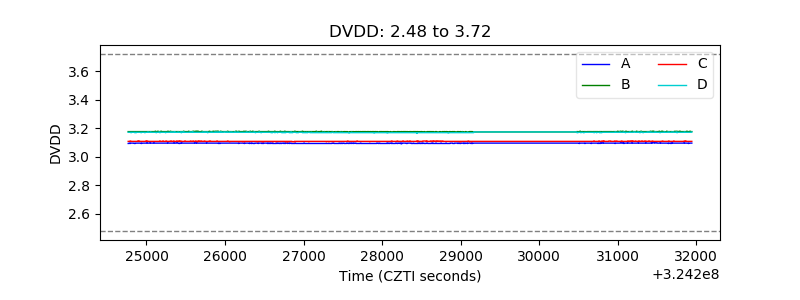 |
| Temperature 1 | 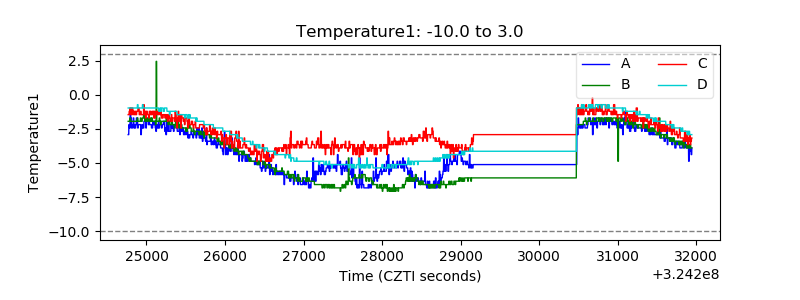 |
| Veto HV Monitor | 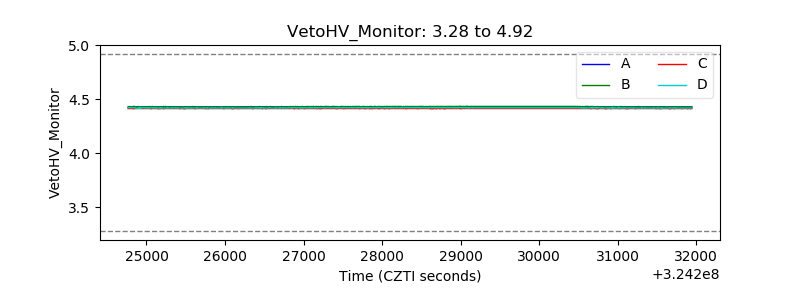 |
| Veto LLD | 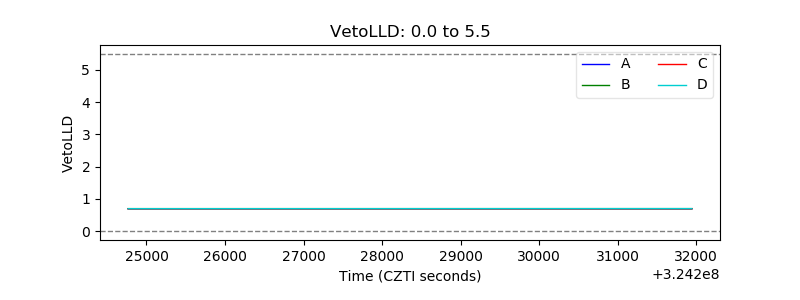 |
| Alpha Counter | 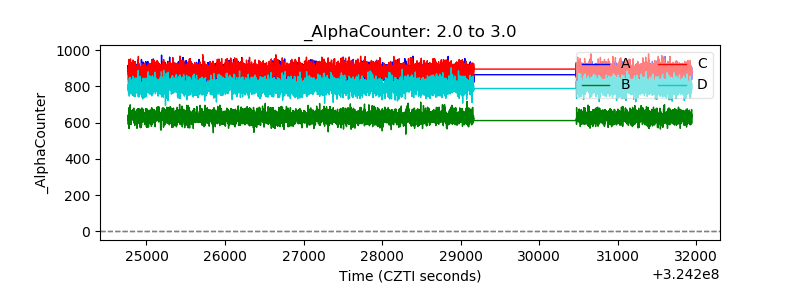 |
| _CPM_Rate | 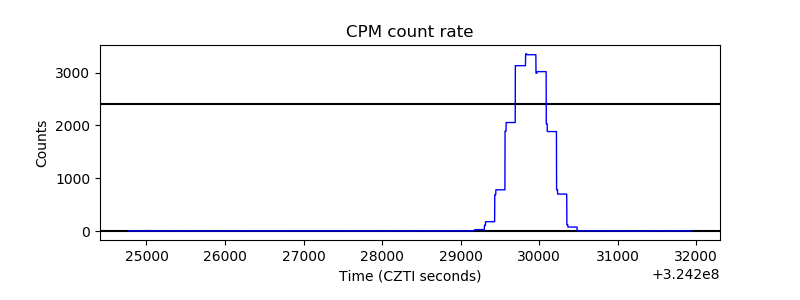 |
| CZT Counter | 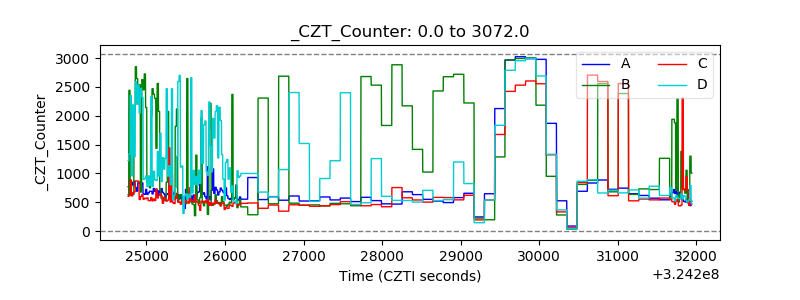 |
| +2.5 Volts monitor |  |
| +5 Volts monitor |  |
| _ROLL_ROT | 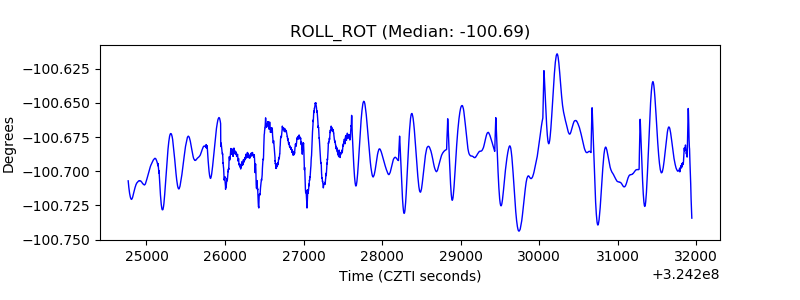 |
| _Roll_DEC | 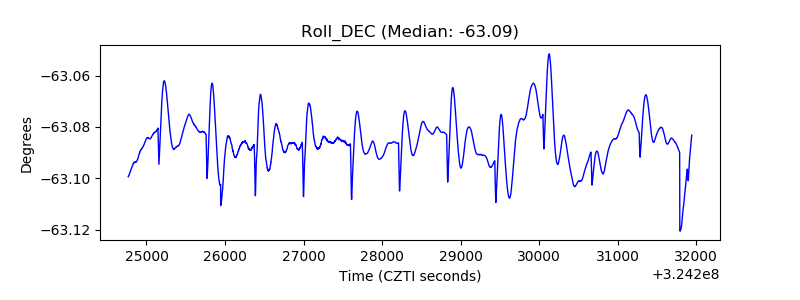 |
| _Roll_RA | 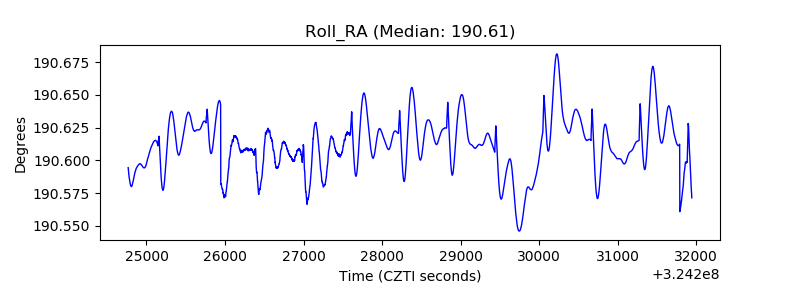 |
| Veto Counter | 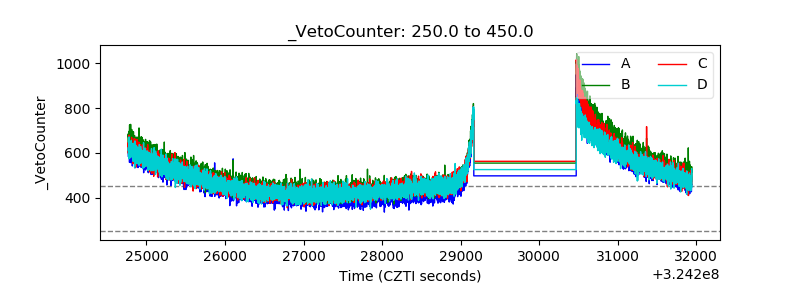 |