| Param | Original file | Final file |
|---|---|---|
| Filename | modeM0/AS1T03_183T01_9000003606_24520cztM0_level2.evt | modeM0/AS1T03_183T01_9000003606_24520cztM0_level2_quad_clean.evt |
| Size (bytes) | 616,170,240 | 127,785,600 |
| Size | 587.6 MB | 121.9 MB |
| Events in quadrant A | 3,672,072 | 927,415 |
| Events in quadrant B | 6,453,612 | 832,485 |
| Events in quadrant C | 4,078,891 | 837,927 |
| Events in quadrant D | 4,043,691 | 846,203 |
| Mode M0 | |||
|---|---|---|---|
| Quadrant | BADHDUFLAG | Total packets | Discarded packets |
| A | 0 | 14989 | 1 |
| B | 0 | 23143 | 1 |
| C | 0 | 16009 | 1 |
| D | 0 | 16046 | 1 |
| Mode SS | |||
|---|---|---|---|
| Quadrant | BADHDUFLAG | Total packets | Discarded packets |
| A | 0 | 124 | 0 |
| B | 0 | 124 | 0 |
| C | 0 | 124 | 0 |
| D | 0 | 124 | 0 |
| Mode M9 | |||
|---|---|---|---|
| Quadrant | BADHDUFLAG | Total packets | Discarded packets |
| A | 0 | 14 | 0 |
| B | 0 | 14 | 0 |
| C | 0 | 14 | 0 |
| D | 0 | 14 | 0 |
| Quadrant | Total seconds | Saturated seconds | Saturation percentage |
|---|---|---|---|
| A | 6097 | 82 | 1.344924% |
| B | 6097 | 1324 | 21.715598% |
| C | 6098 | 448 | 7.346671% |
| D | 6098 | 93 | 1.525090% |
Noise dominated data is calculated using 1-second bins in cleaned event files. If a bin has >2000 counts, and if more than 50% of those come from <1% of pixels, then it is considered to be noise-dominated and hence unusable.
| Quadrant | # 1 sec bins | Bins with >0 counts | Bins with >2000 counts | High rate bins dominated by noise | Noise dominated (total time) | Noise dominated (detector-on time) | Marked lightcurve |
|---|---|---|---|---|---|---|---|
| A | 7467 | 6098 | 3 | 3 | 0.04% | 0.05% | 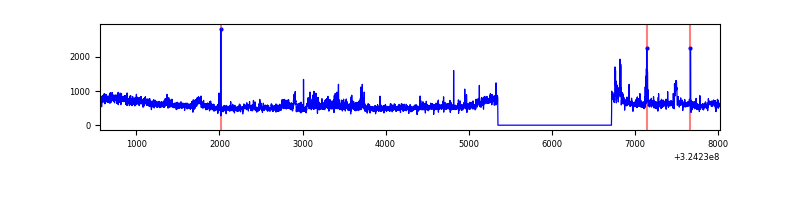 |
| B | 7467 | 6098 | 969 | 969 | 12.98% | 15.89% | 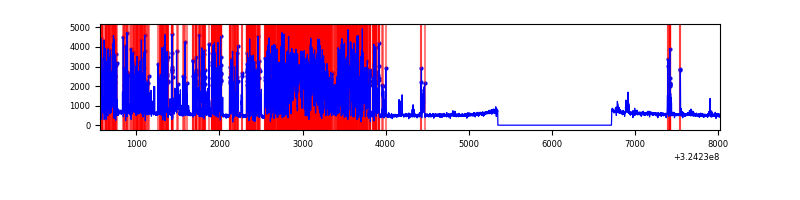 |
| C | 7468 | 6099 | 276 | 276 | 3.70% | 4.53% | 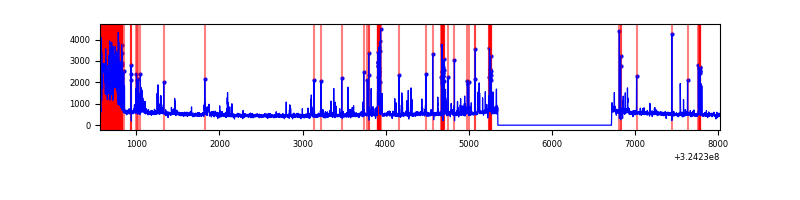 |
| D | 7468 | 6099 | 49 | 49 | 0.66% | 0.80% | 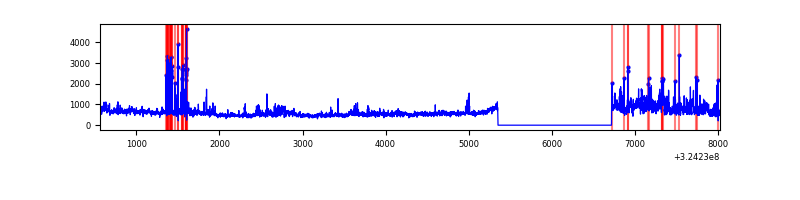 |
Top three noisy pixels from each quadrant. If the there are fewer than three noisy pixels in the level2.evt file, extra rows are filled as -1
| Pixel properties | Quadrant properties | ||||||
|---|---|---|---|---|---|---|---|
| Quadrant | DetID | PixID | Counts | Sigma | Mean | Median | Sigma |
| A | 14 | 111 | 520757 | 3236.91 | 816 | 803 | 160.6 |
| A | 13 | 254 | 10552 | 60.69 | 816 | 803 | 160.6 |
| A | 4 | 2 | 7985 | 44.71 | 816 | 803 | 160.6 |
| B | 3 | 64 | 3564089 | 26264.8 | 735 | 719 | 135.7 |
| B | 12 | 111 | 15626 | 109.88 | 735 | 719 | 135.7 |
| B | 7 | 202 | 14614 | 102.42 | 735 | 719 | 135.7 |
| C | 2 | 16 | 729327 | 4321.85 | 734 | 739 | 168.6 |
| C | 10 | 9 | 358675 | 2123.21 | 734 | 739 | 168.6 |
| C | 14 | 238 | 120669 | 711.4 | 734 | 739 | 168.6 |
| D | 1 | 52 | 999500 | 5470.97 | 769 | 748 | 182.6 |
| D | 8 | 195 | 93048 | 505.6 | 769 | 748 | 182.6 |
| D | 2 | 234 | 24482 | 130.01 | 769 | 748 | 182.6 |
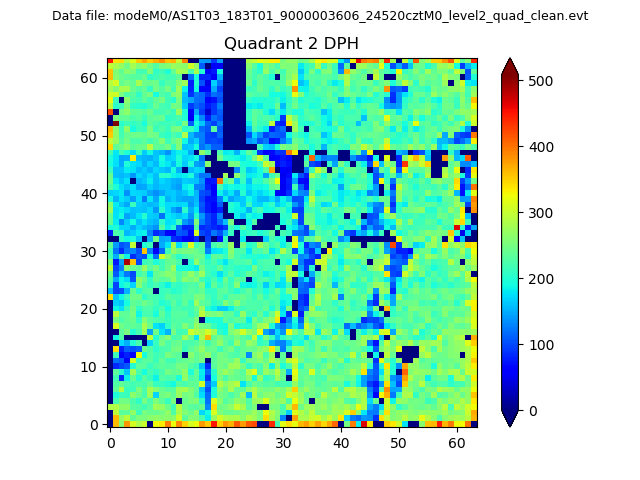
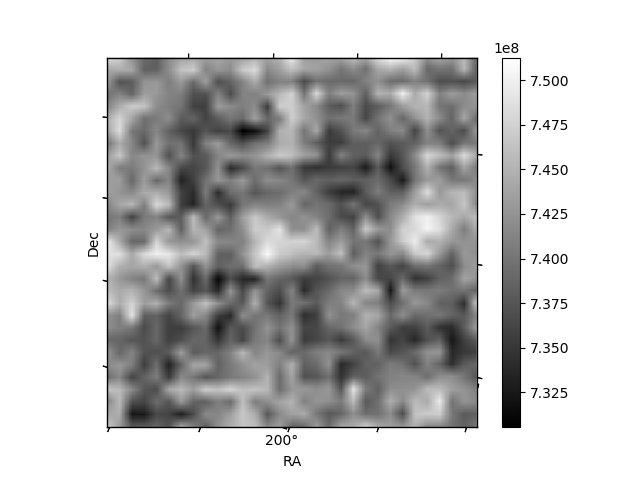
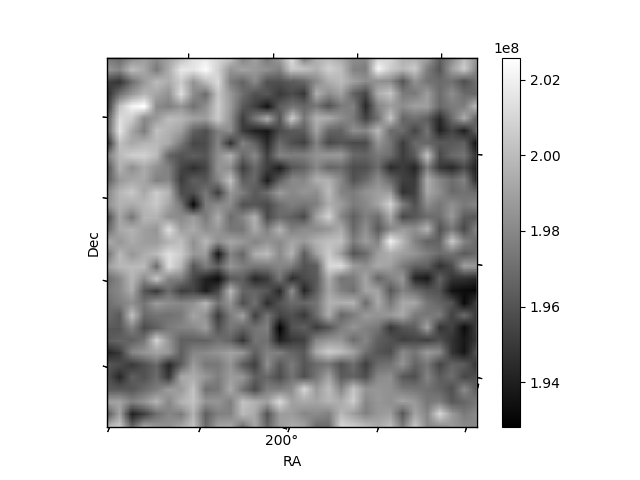
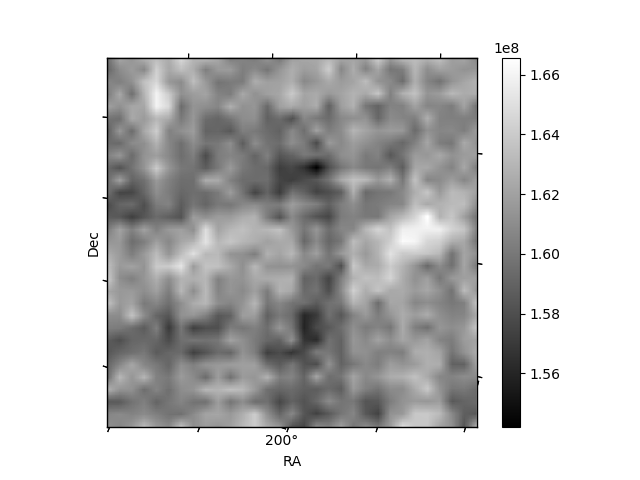
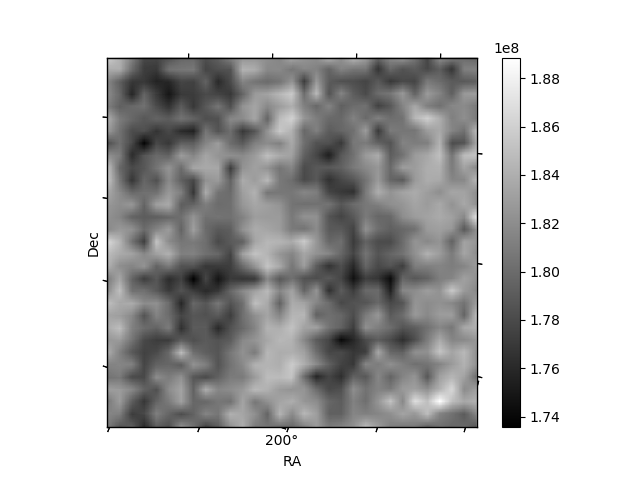
Histogram calculated using DETX and DETY for each event in the final _common_clean file
| Quadrant A | 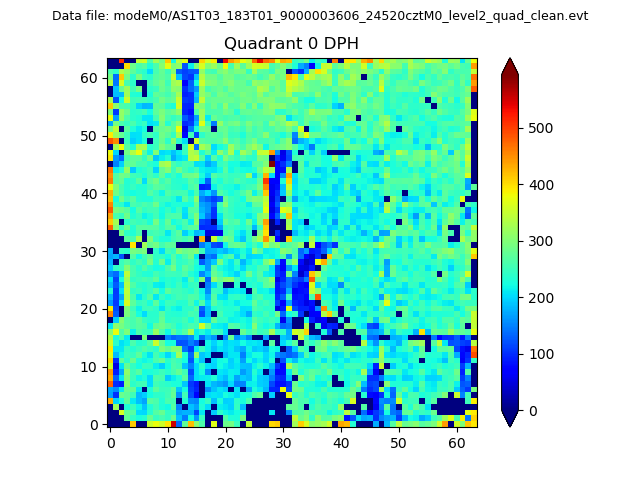 |
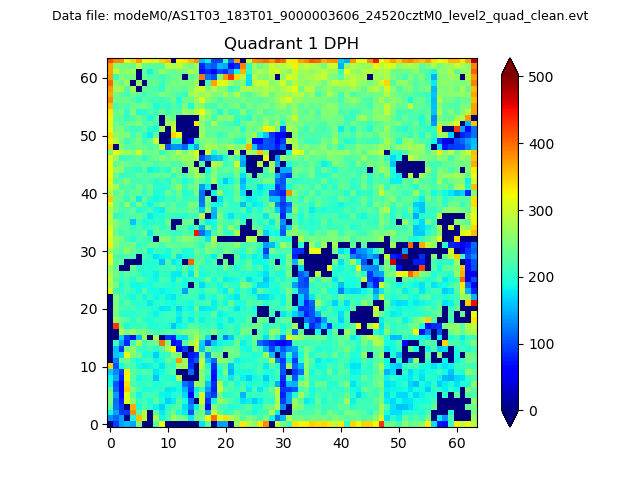 |
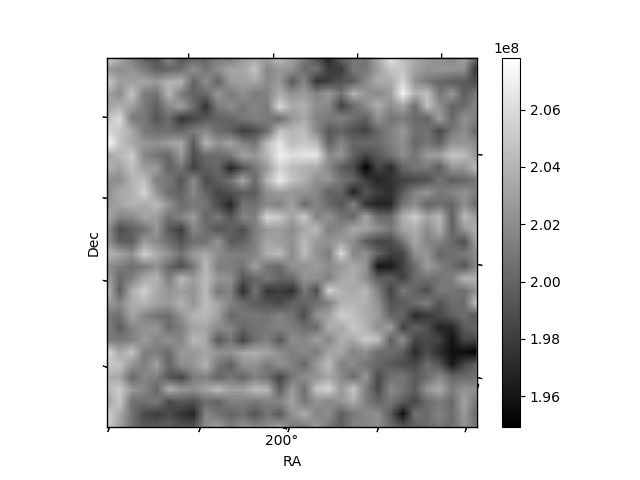
Quadrant B |
|---|---|---|---|
| Quadrant D | 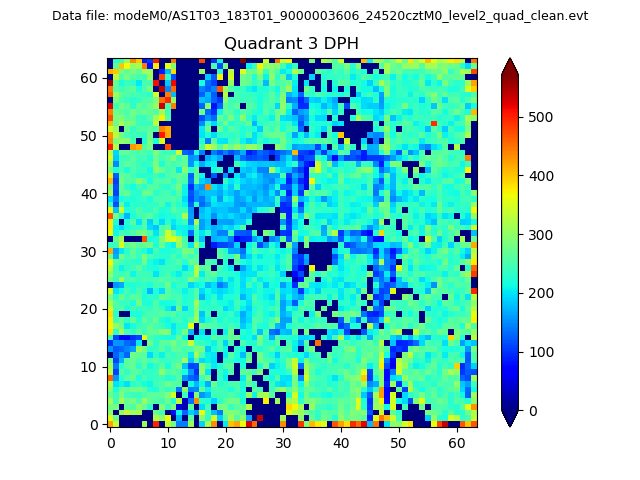 |
 |
Quadrant C |
| Plot type | Count rate plots | Images |
|---|---|---|
| Comparison with Poisson distribution Blue bars denote a histogram of data divided into 1 sec bins. Red curve is a Poisson curve with rate = median count rate of data. |
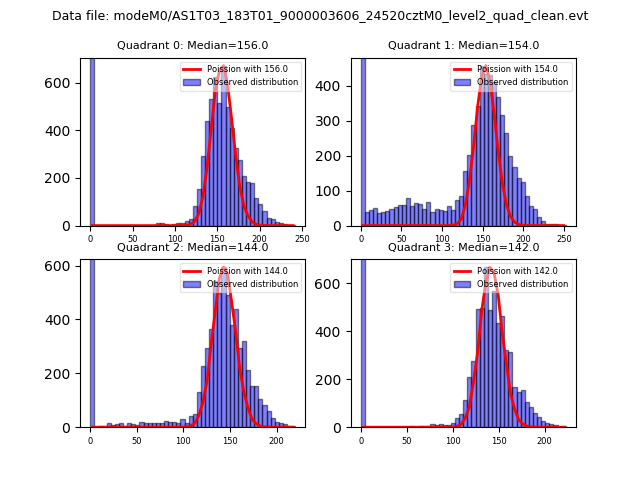 |
 |
| Quadrant-wise count rates Data is divided into 100 sec bins |
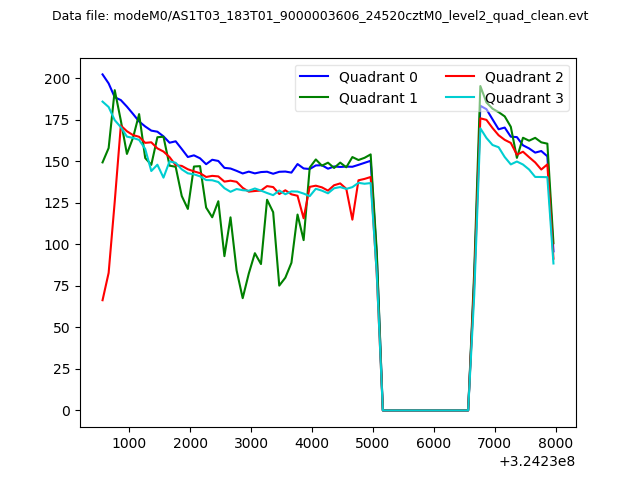 |
|
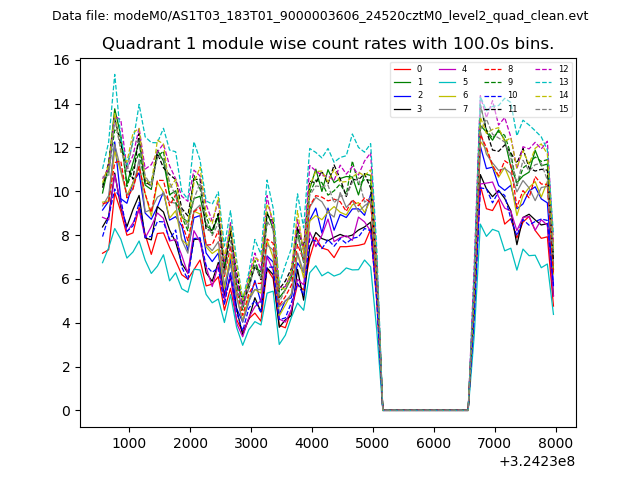
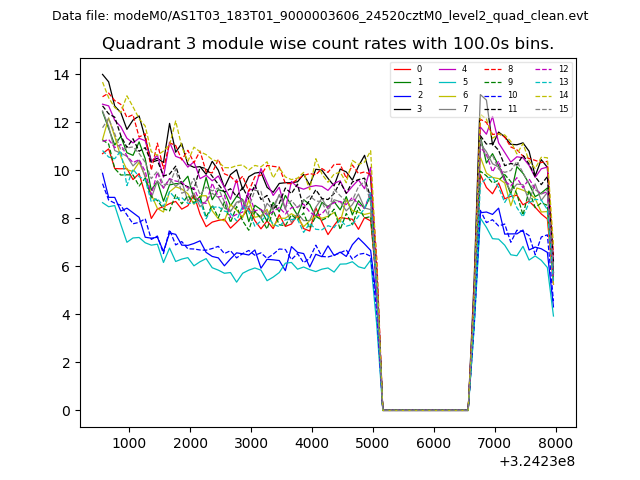
| Module-wise count rates for Quadrant A Data is divided into 100 sec bins |
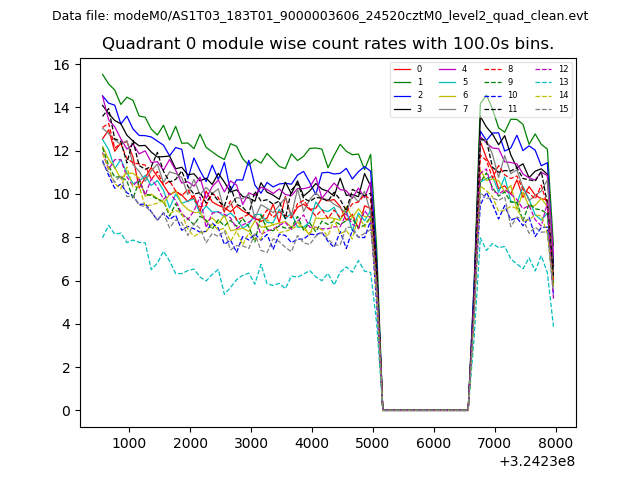 |
 |
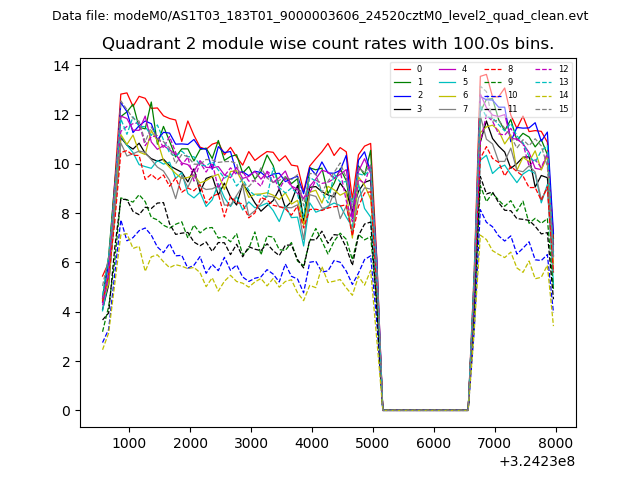
| Module-wise count rates for Quadrant B Data is divided into 100 sec bins |
 |
 |
| Module-wise count rates for Quadrant C Data is divided into 100 sec bins |
 |
 |
| Module-wise count rates for Quadrant D Data is divided into 100 sec bins |
 |
 |
| Parameter | Plot |
|---|---|
| CZT HV Monitor | 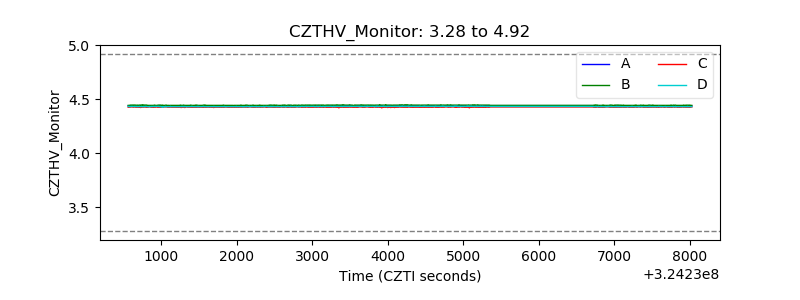 |
| D_VDD | 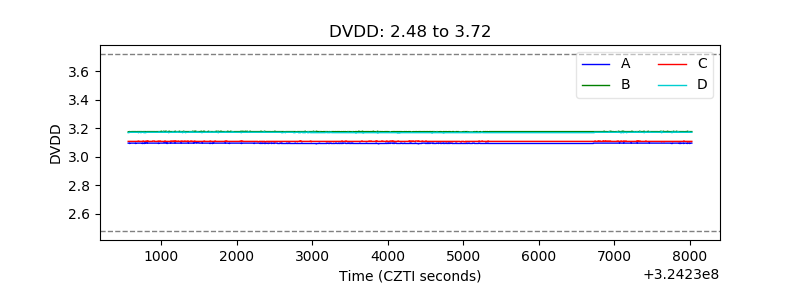 |
| Temperature 1 | 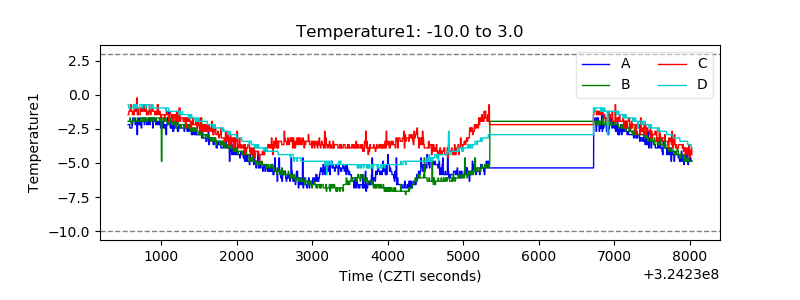 |
| Veto HV Monitor | 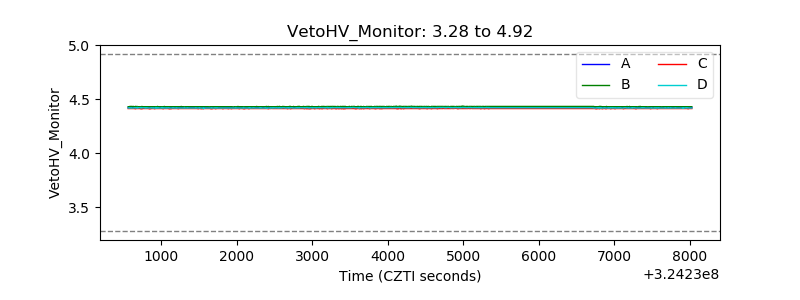 |
| Veto LLD | 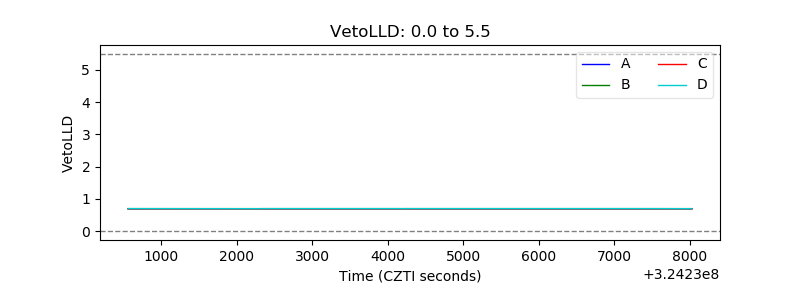 |
| Alpha Counter | 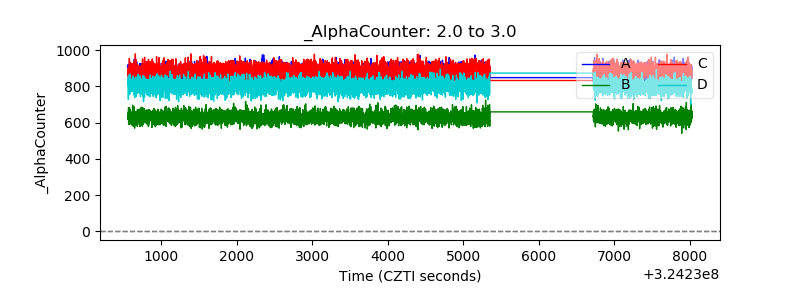 |
| _CPM_Rate | 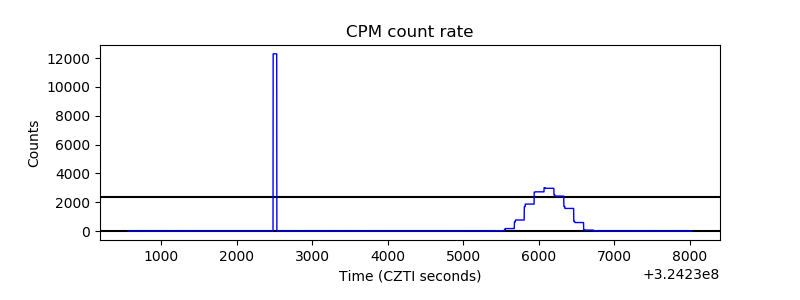 |
| CZT Counter | 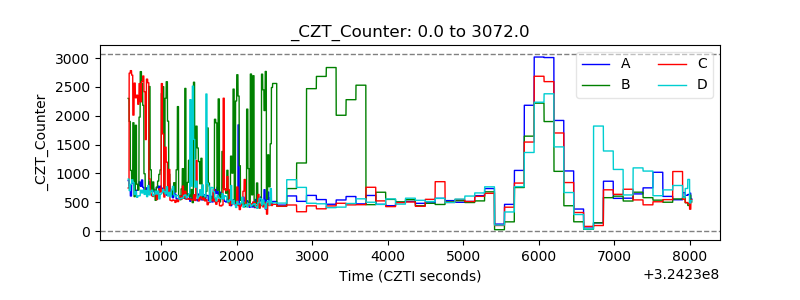 |
| +2.5 Volts monitor |  |
| +5 Volts monitor |  |
| _ROLL_ROT | 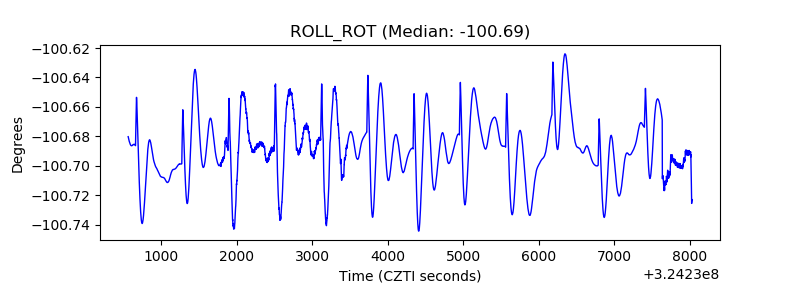 |
| _Roll_DEC | 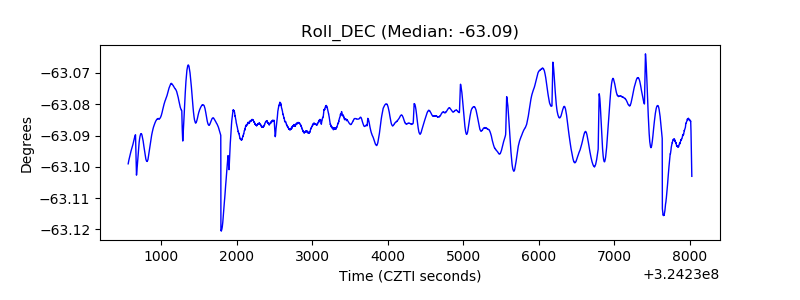 |
| _Roll_RA | 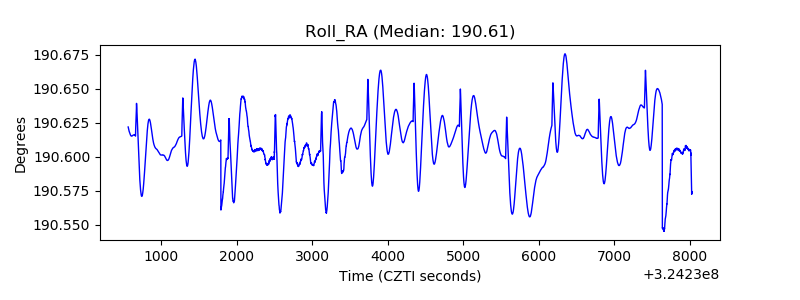 |
| Veto Counter | 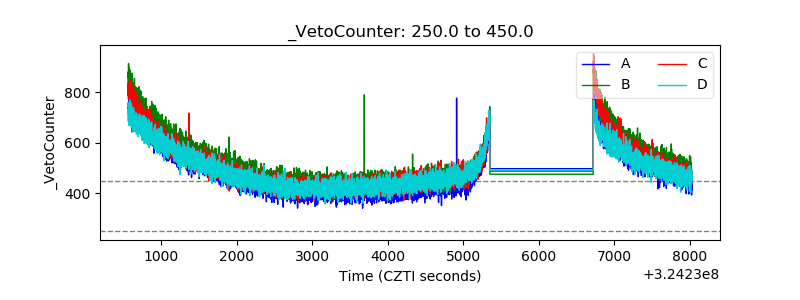 |