| Param | Original file | Final file |
|---|---|---|
| Filename | modeM0/AS1T03_183T01_9000003606_24521cztM0_level2.evt | modeM0/AS1T03_183T01_9000003606_24521cztM0_level2_quad_clean.evt |
| Size (bytes) | 580,798,080 | 120,792,960 |
| Size | 553.9 MB | 115.2 MB |
| Events in quadrant A | 4,109,784 | 836,066 |
| Events in quadrant B | 3,866,064 | 854,331 |
| Events in quadrant C | 4,568,622 | 766,972 |
| Events in quadrant D | 4,625,257 | 767,664 |
| Mode M0 | |||
|---|---|---|---|
| Quadrant | BADHDUFLAG | Total packets | Discarded packets |
| A | 0 | 16849 | 2 |
| B | 0 | 15473 | 2 |
| C | 0 | 17510 | 2 |
| D | 0 | 17909 | 2 |
| Mode SS | |||
|---|---|---|---|
| Quadrant | BADHDUFLAG | Total packets | Discarded packets |
| A | 0 | 126 | 0 |
| B | 0 | 126 | 0 |
| C | 0 | 126 | 0 |
| D | 0 | 126 | 0 |
| Mode M9 | |||
|---|---|---|---|
| Quadrant | BADHDUFLAG | Total packets | Discarded packets |
| A | 0 | 16 | 0 |
| B | 0 | 17 | 0 |
| C | 0 | 17 | 0 |
| D | 0 | 17 | 0 |
| Quadrant | Total seconds | Saturated seconds | Saturation percentage |
|---|---|---|---|
| A | 6208 | 110 | 1.771907% |
| B | 6208 | 250 | 4.027062% |
| C | 6208 | 418 | 6.733247% |
| D | 6208 | 86 | 1.385309% |
Noise dominated data is calculated using 1-second bins in cleaned event files. If a bin has >2000 counts, and if more than 50% of those come from <1% of pixels, then it is considered to be noise-dominated and hence unusable.
| Quadrant | # 1 sec bins | Bins with >0 counts | Bins with >2000 counts | High rate bins dominated by noise | Noise dominated (total time) | Noise dominated (detector-on time) | Marked lightcurve |
|---|---|---|---|---|---|---|---|
| A | 7513 | 6209 | 7 | 7 | 0.09% | 0.11% | 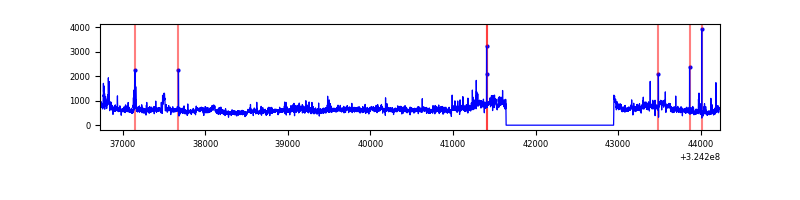 |
| B | 7513 | 6209 | 91 | 91 | 1.21% | 1.47% | 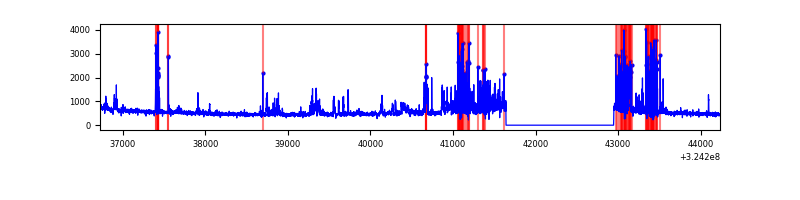 |
| C | 7513 | 6209 | 291 | 291 | 3.87% | 4.69% | 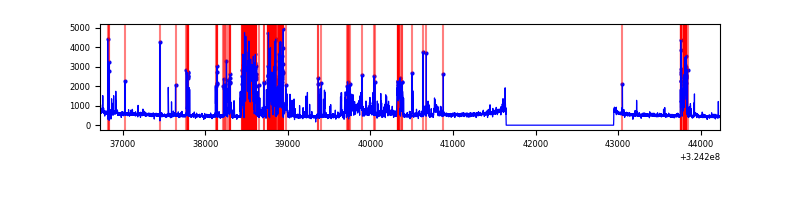 |
| D | 7513 | 6209 | 39 | 39 | 0.52% | 0.63% | 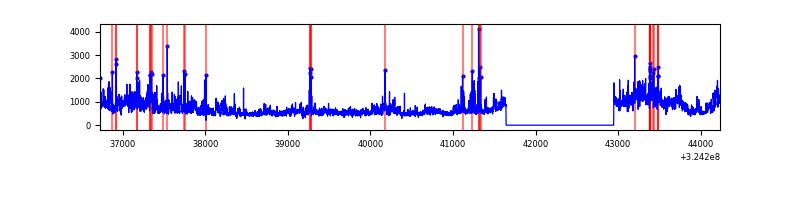 |
Top three noisy pixels from each quadrant. If the there are fewer than three noisy pixels in the level2.evt file, extra rows are filled as -1
| Pixel properties | Quadrant properties | ||||||
|---|---|---|---|---|---|---|---|
| Quadrant | DetID | PixID | Counts | Sigma | Mean | Median | Sigma |
| A | 14 | 111 | 1023773 | 6468.89 | 797 | 783 | 158.1 |
| A | 4 | 2 | 14575 | 87.21 | 797 | 783 | 158.1 |
| A | 13 | 254 | 10020 | 58.41 | 797 | 783 | 158.1 |
| B | 3 | 64 | 762602 | 5220.92 | 792 | 773 | 145.9 |
| B | 12 | 111 | 17120 | 112.02 | 792 | 773 | 145.9 |
| B | 11 | 111 | 14903 | 96.83 | 792 | 773 | 145.9 |
| C | 2 | 16 | 1347850 | 7942.08 | 737 | 741 | 169.6 |
| C | 10 | 9 | 213789 | 1256.06 | 737 | 741 | 169.6 |
| C | 14 | 238 | 121379 | 711.24 | 737 | 741 | 169.6 |
| D | 1 | 52 | 1532515 | 8532.79 | 756 | 737 | 179.5 |
| D | 8 | 195 | 176135 | 977.06 | 756 | 737 | 179.5 |
| D | 9 | 1 | 24874 | 134.46 | 756 | 737 | 179.5 |
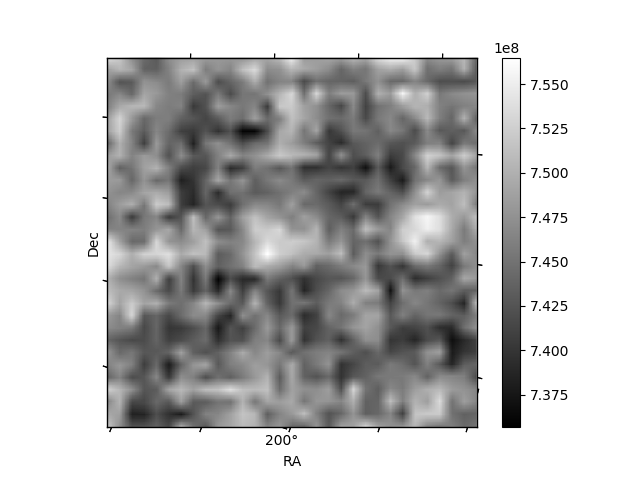
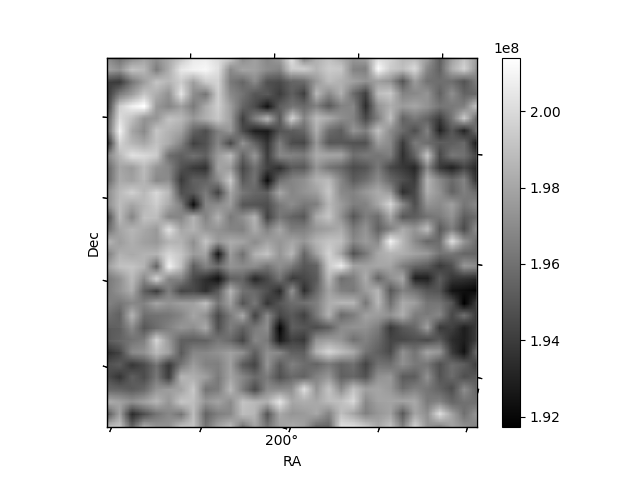
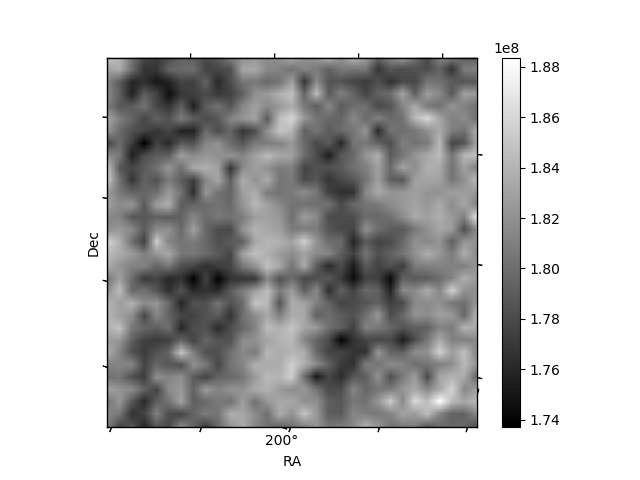
Histogram calculated using DETX and DETY for each event in the final _common_clean file
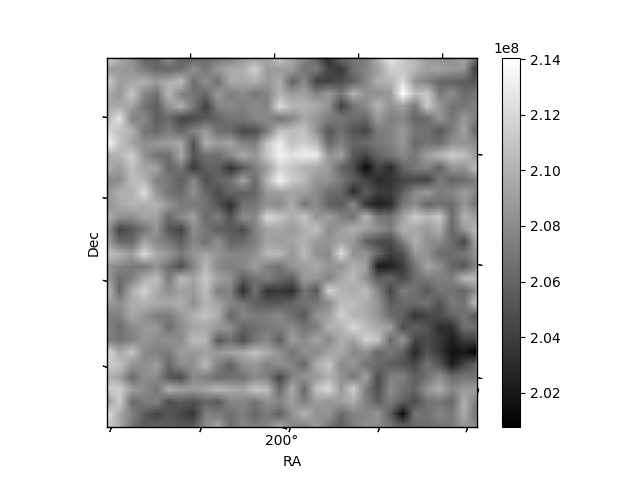
| Quadrant A | 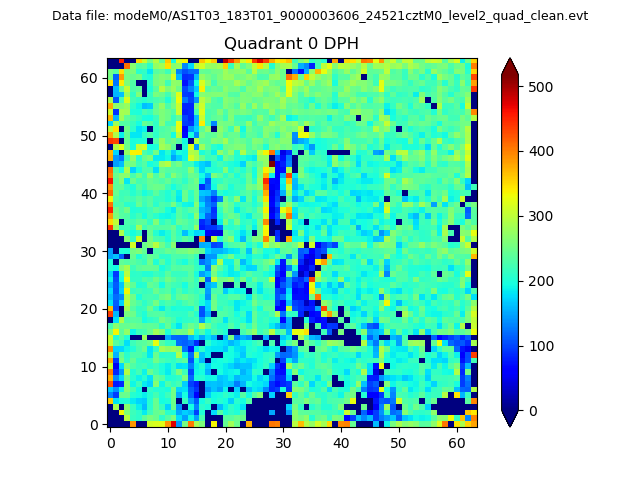 |
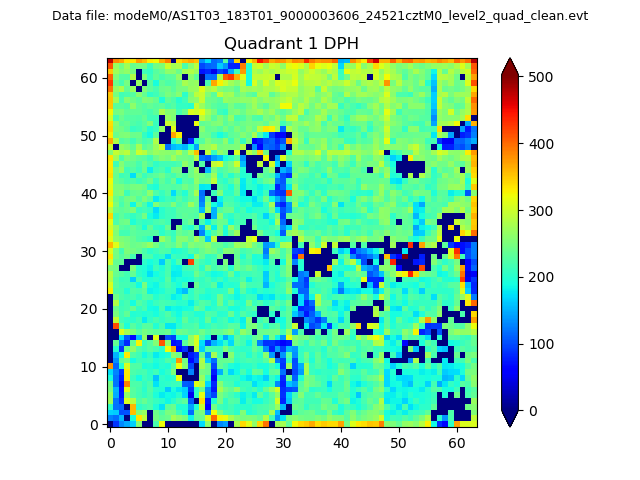 |
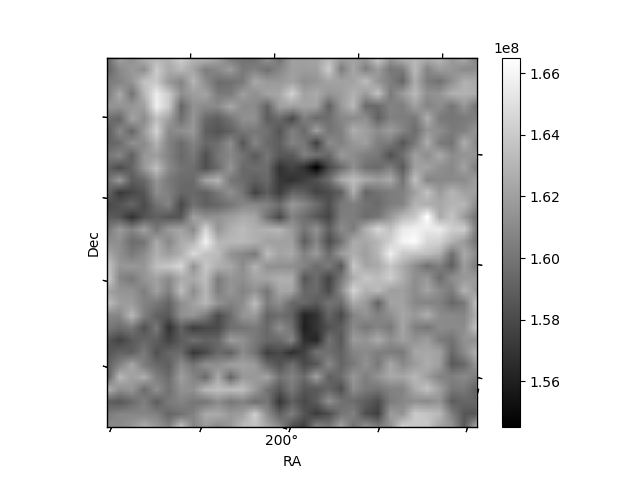
Quadrant B |
|---|---|---|---|
| Quadrant D | 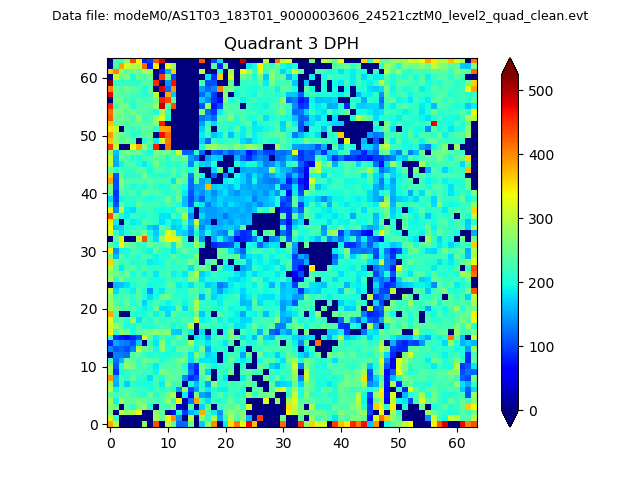 |
 |
Quadrant C |
| Plot type | Count rate plots | Images |
|---|---|---|
| Comparison with Poisson distribution Blue bars denote a histogram of data divided into 1 sec bins. Red curve is a Poisson curve with rate = median count rate of data. |
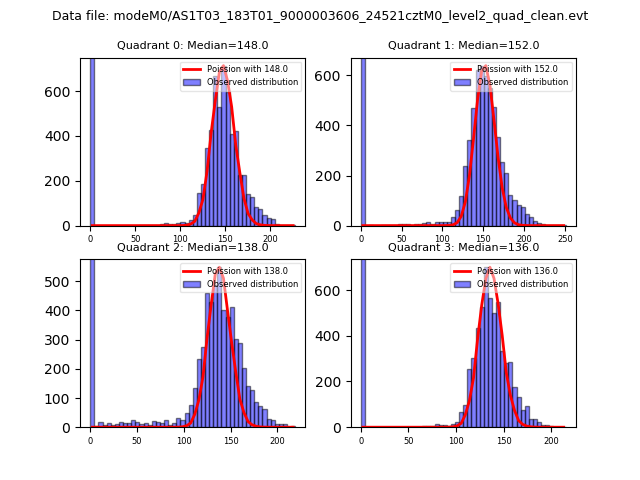 |
 |
| Quadrant-wise count rates Data is divided into 100 sec bins |
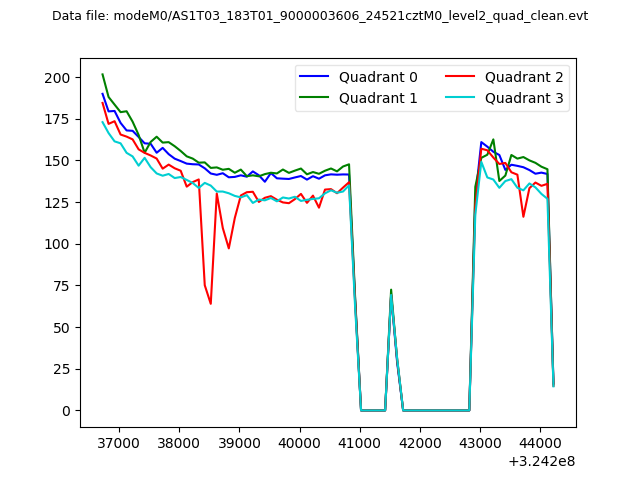 |
|
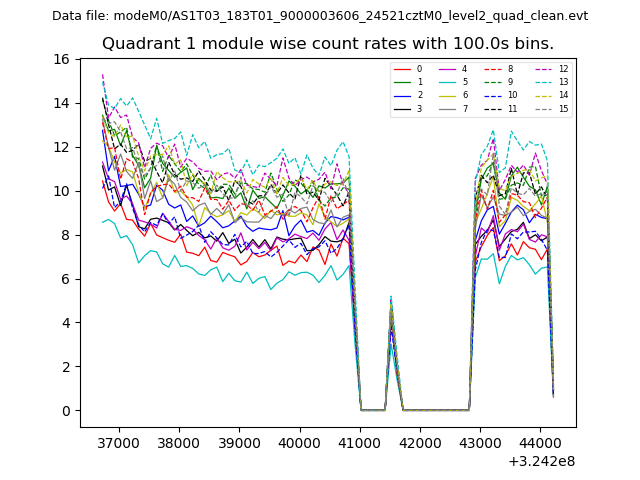
| Module-wise count rates for Quadrant A Data is divided into 100 sec bins |
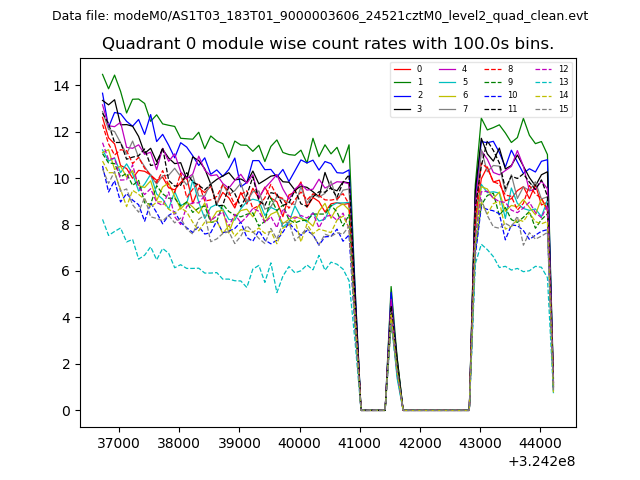 |
 |
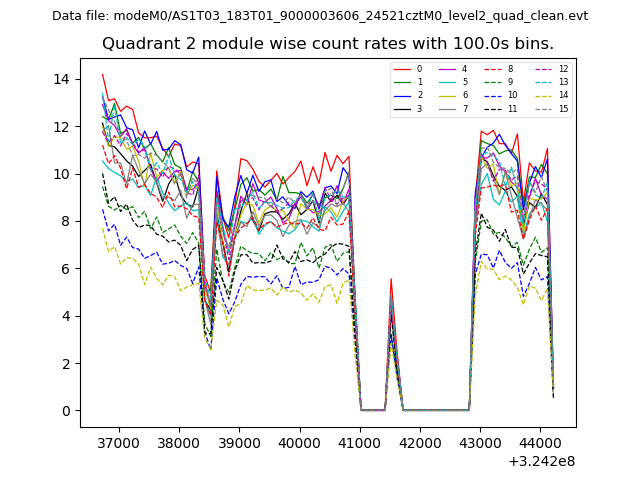
| Module-wise count rates for Quadrant B Data is divided into 100 sec bins |
 |
 |
| Module-wise count rates for Quadrant C Data is divided into 100 sec bins |
 |
 |
| Module-wise count rates for Quadrant D Data is divided into 100 sec bins |
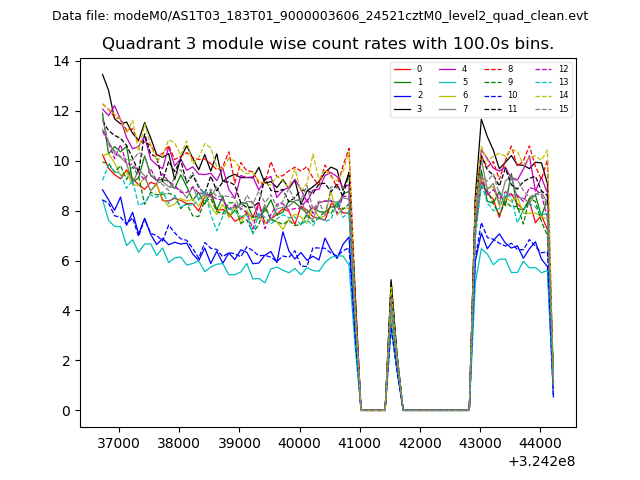 |
 |
| Parameter | Plot |
|---|---|
| CZT HV Monitor | 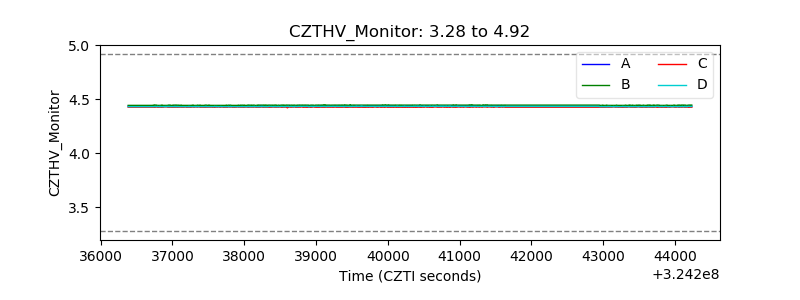 |
| D_VDD | 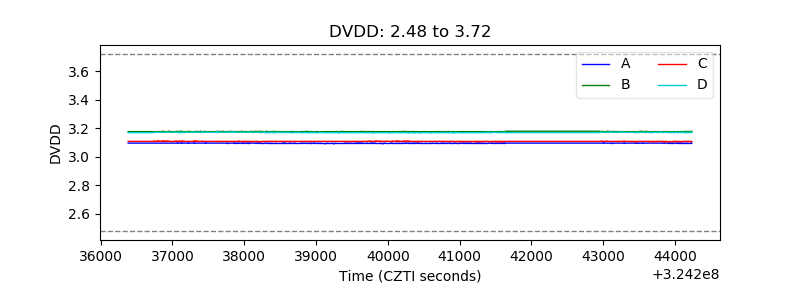 |
| Temperature 1 |  |
| Veto HV Monitor | 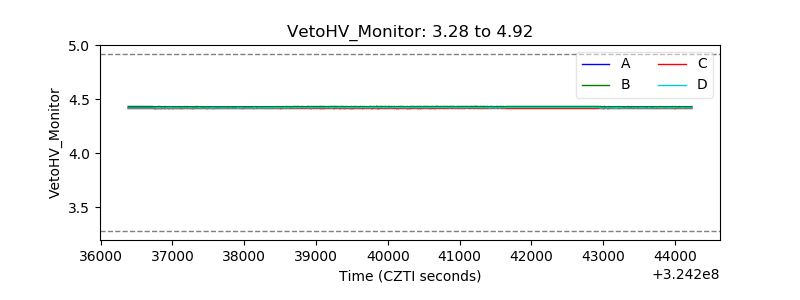 |
| Veto LLD | 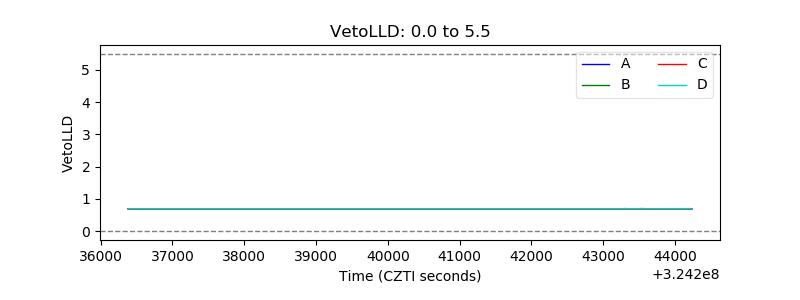 |
| Alpha Counter | 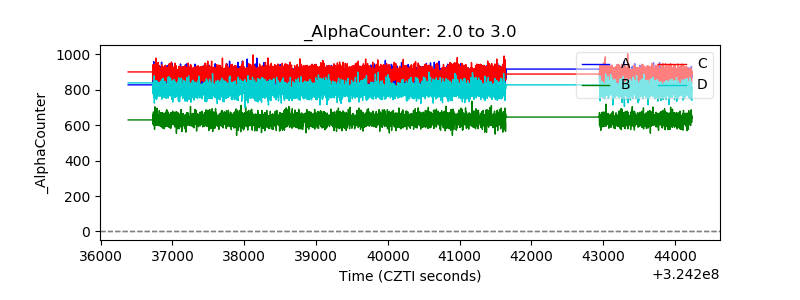 |
| _CPM_Rate | 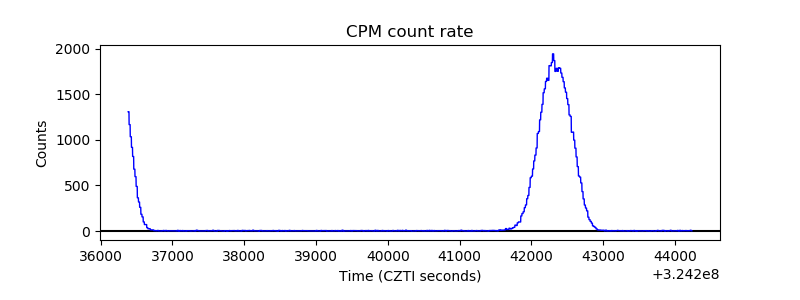 |
| CZT Counter | 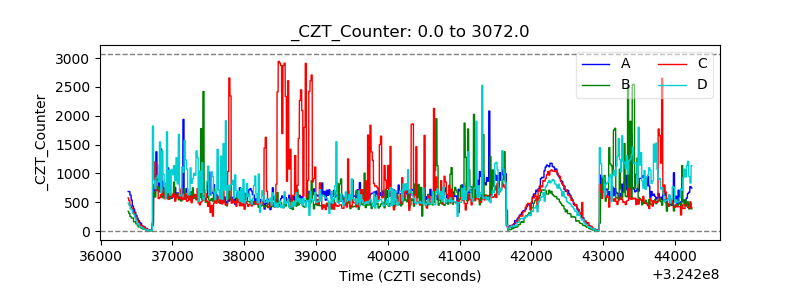 |
| +2.5 Volts monitor |  |
| +5 Volts monitor |  |
| _ROLL_ROT | 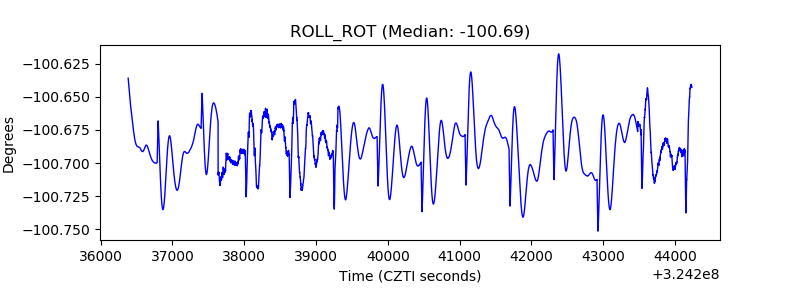 |
| _Roll_DEC | 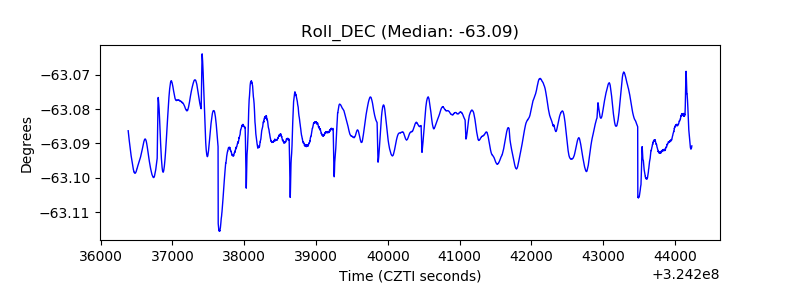 |
| _Roll_RA | 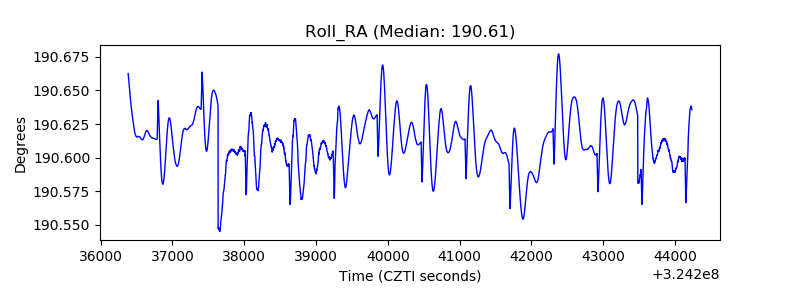 |
| Veto Counter | 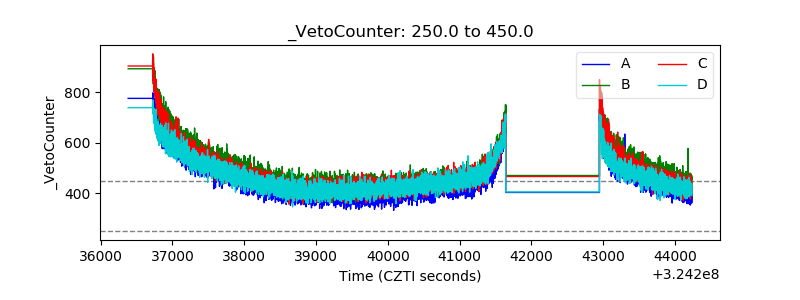 |