| Param | Original file | Final file |
|---|---|---|
| Filename | modeM0/AS1T03_183T01_9000003606_24523cztM0_level2.evt | modeM0/AS1T03_183T01_9000003606_24523cztM0_level2_quad_clean.evt |
| Size (bytes) | 553,775,040 | 126,714,240 |
| Size | 528.1 MB | 120.8 MB |
| Events in quadrant A | 3,696,640 | 857,233 |
| Events in quadrant B | 3,366,544 | 878,783 |
| Events in quadrant C | 3,595,469 | 818,718 |
| Events in quadrant D | 5,632,511 | 790,043 |
| Mode M0 | |||
|---|---|---|---|
| Quadrant | BADHDUFLAG | Total packets | Discarded packets |
| A | 0 | 15488 | 2 |
| B | 0 | 14649 | 2 |
| C | 0 | 15326 | 2 |
| D | 0 | 21649 | 2 |
| Mode SS | |||
|---|---|---|---|
| Quadrant | BADHDUFLAG | Total packets | Discarded packets |
| A | 0 | 144 | 0 |
| B | 0 | 144 | 0 |
| C | 0 | 144 | 0 |
| D | 0 | 144 | 0 |
| Mode M9 | |||
|---|---|---|---|
| Quadrant | BADHDUFLAG | Total packets | Discarded packets |
| A | 0 | 16 | 0 |
| B | 0 | 17 | 0 |
| C | 0 | 17 | 0 |
| D | 0 | 17 | 0 |
| Quadrant | Total seconds | Saturated seconds | Saturation percentage |
|---|---|---|---|
| A | 7080 | 49 | 0.692090% |
| B | 7079 | 49 | 0.692188% |
| C | 7079 | 176 | 2.486227% |
| D | 7079 | 119 | 1.681028% |
Noise dominated data is calculated using 1-second bins in cleaned event files. If a bin has >2000 counts, and if more than 50% of those come from <1% of pixels, then it is considered to be noise-dominated and hence unusable.
| Quadrant | # 1 sec bins | Bins with >0 counts | Bins with >2000 counts | High rate bins dominated by noise | Noise dominated (total time) | Noise dominated (detector-on time) | Marked lightcurve |
|---|---|---|---|---|---|---|---|
| A | 7755 | 7081 | 2 | 2 | 0.03% | 0.03% | 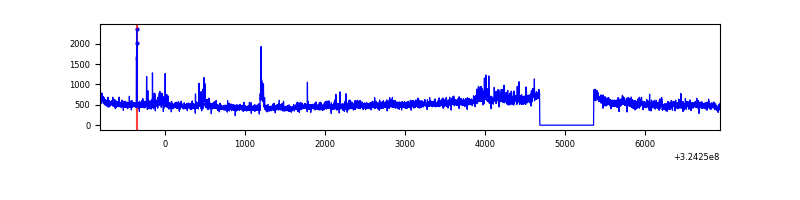 |
| B | 7754 | 7080 | 0 | 0 | 0.00% | 0.00% | 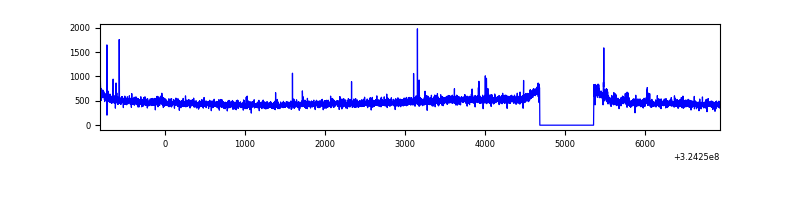 |
| C | 7754 | 7080 | 56 | 56 | 0.72% | 0.79% | 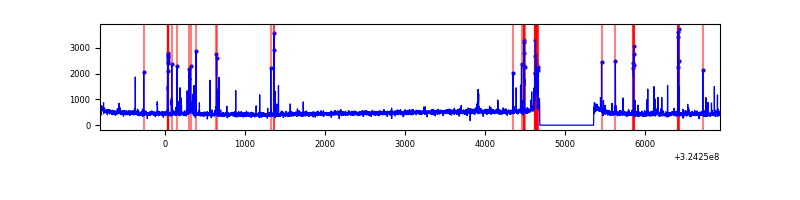 |
| D | 7754 | 7080 | 50 | 50 | 0.64% | 0.71% | 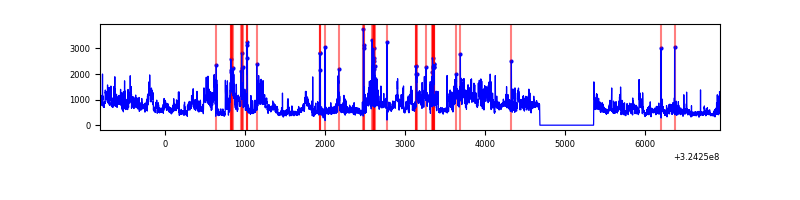 |
Top three noisy pixels from each quadrant. If the there are fewer than three noisy pixels in the level2.evt file, extra rows are filled as -1
| Pixel properties | Quadrant properties | ||||||
|---|---|---|---|---|---|---|---|
| Quadrant | DetID | PixID | Counts | Sigma | Mean | Median | Sigma |
| A | 14 | 111 | 439738 | 2607.41 | 844 | 827 | 168.3 |
| A | 13 | 254 | 12400 | 68.75 | 844 | 827 | 168.3 |
| A | 3 | 137 | 7806 | 41.46 | 844 | 827 | 168.3 |
| B | 7 | 202 | 19570 | 117.47 | 847 | 827 | 159.6 |
| B | 12 | 111 | 19471 | 116.85 | 847 | 827 | 159.6 |
| B | 11 | 111 | 17101 | 101.99 | 847 | 827 | 159.6 |
| C | 10 | 9 | 203973 | 1095.98 | 802 | 807 | 185.4 |
| C | 14 | 238 | 132614 | 711.03 | 802 | 807 | 185.4 |
| C | 2 | 16 | 124046 | 664.81 | 802 | 807 | 185.4 |
| D | 1 | 52 | 2367032 | 12165.79 | 806 | 782 | 194.5 |
| D | 9 | 1 | 152392 | 779.48 | 806 | 782 | 194.5 |
| D | 8 | 195 | 48617 | 245.94 | 806 | 782 | 194.5 |
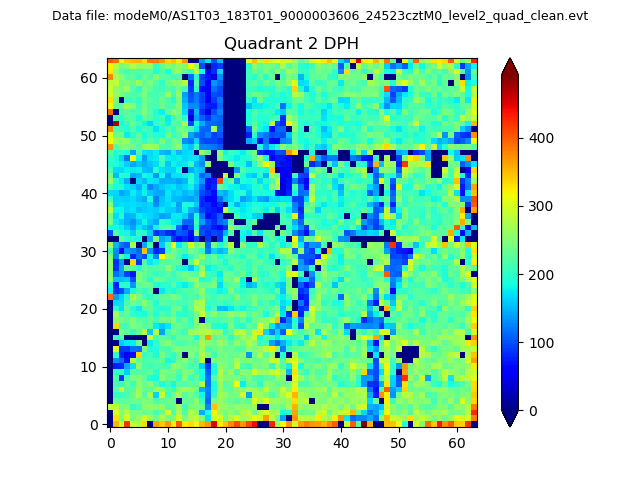
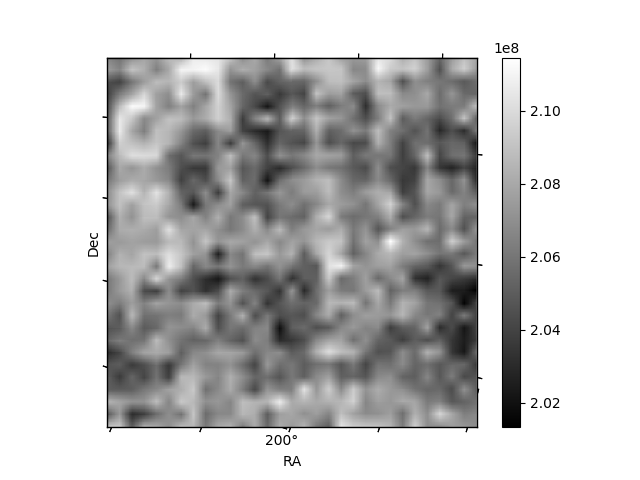
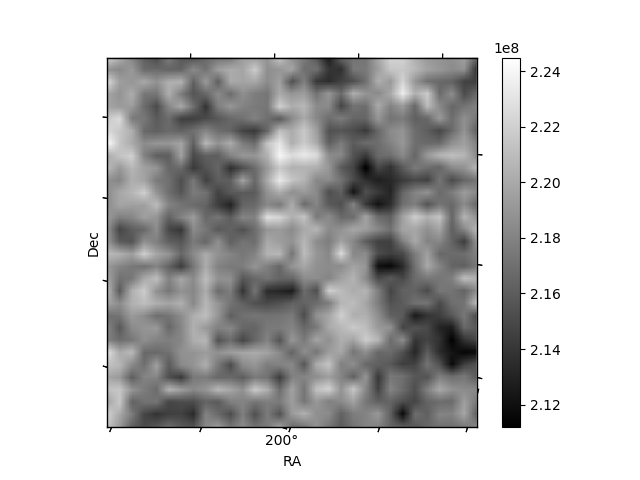
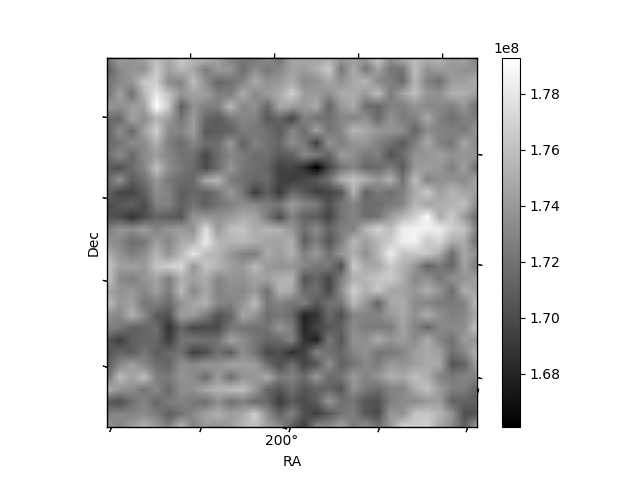
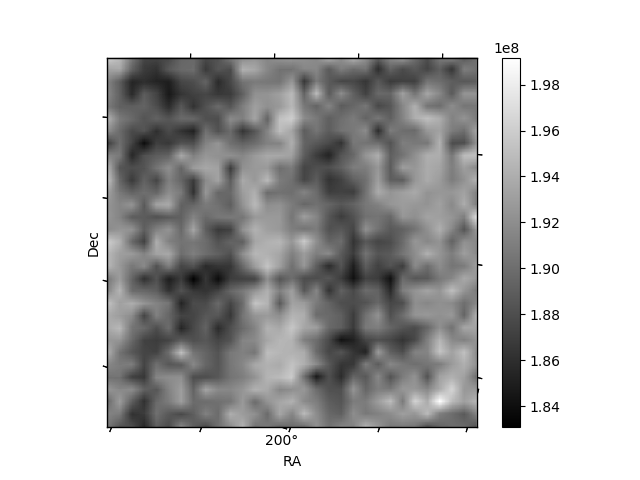
Histogram calculated using DETX and DETY for each event in the final _common_clean file
| Quadrant A |  |
 |
Quadrant B |
|---|---|---|---|
| Quadrant D | 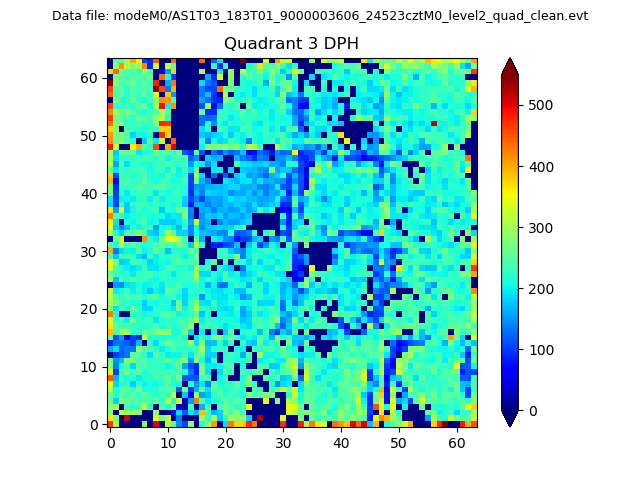 |
 |
Quadrant C |
| Plot type | Count rate plots | Images |
|---|---|---|
| Comparison with Poisson distribution Blue bars denote a histogram of data divided into 1 sec bins. Red curve is a Poisson curve with rate = median count rate of data. |
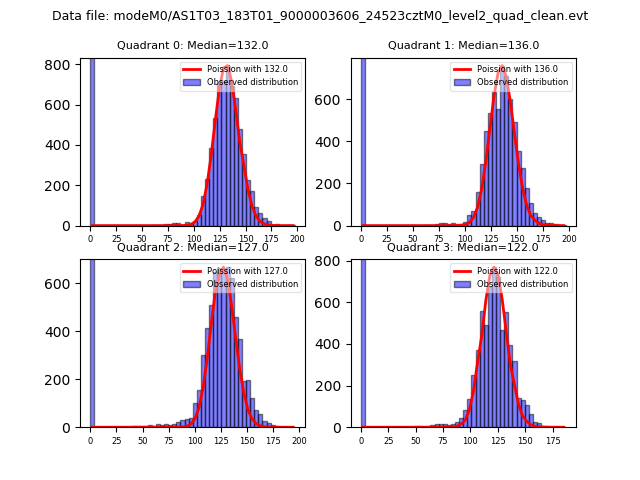 |
 |
| Quadrant-wise count rates Data is divided into 100 sec bins |
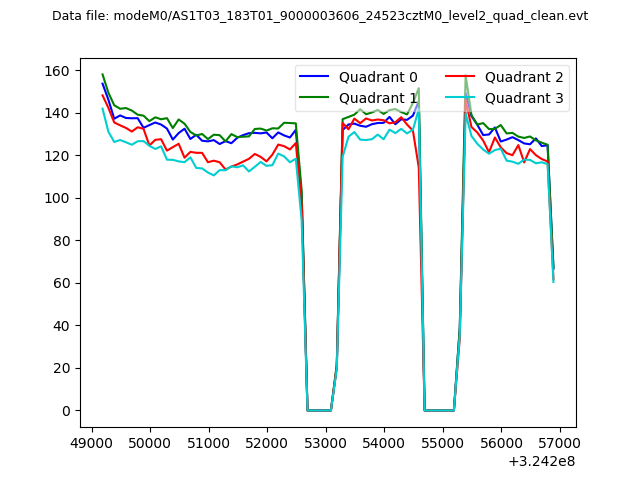 |
|
| Module-wise count rates for Quadrant A Data is divided into 100 sec bins |
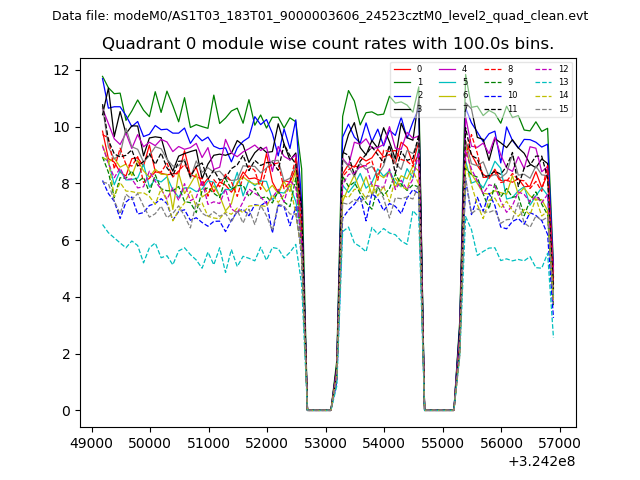 |
 |
| Module-wise count rates for Quadrant B Data is divided into 100 sec bins |
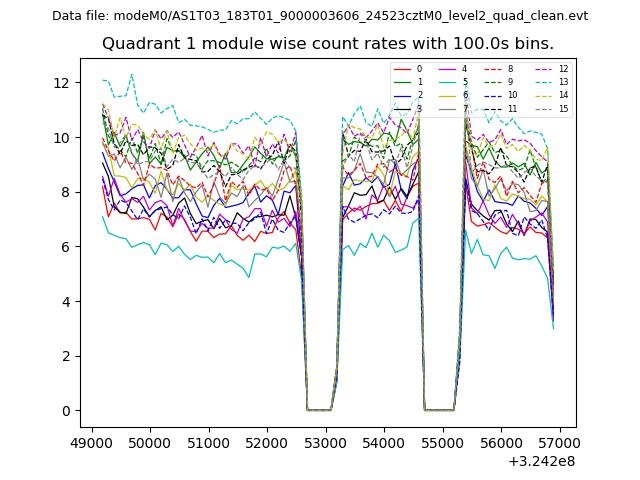 |
 |
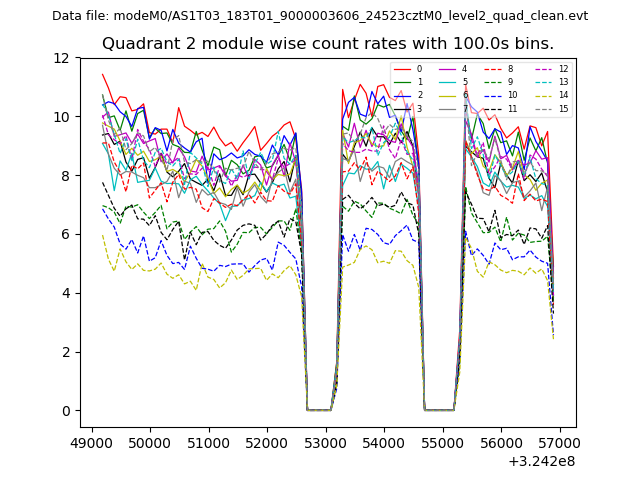
| Module-wise count rates for Quadrant C Data is divided into 100 sec bins |
 |
 |
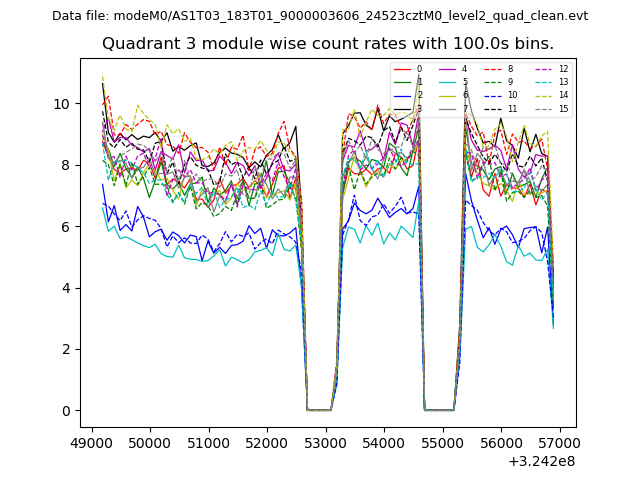
| Module-wise count rates for Quadrant D Data is divided into 100 sec bins |
 |
 |
| Parameter | Plot |
|---|---|
| CZT HV Monitor | 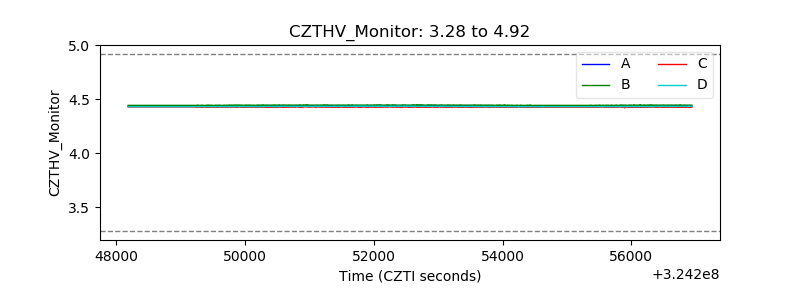 |
| D_VDD | 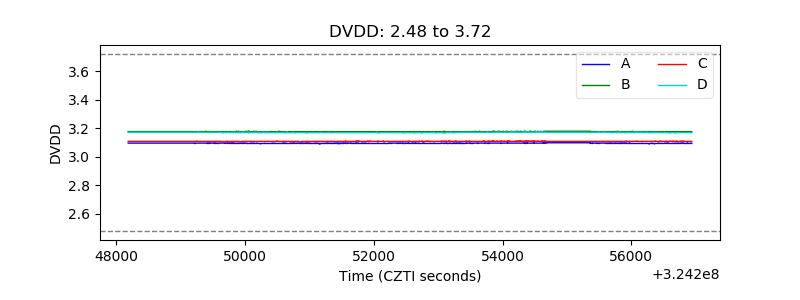 |
| Temperature 1 | 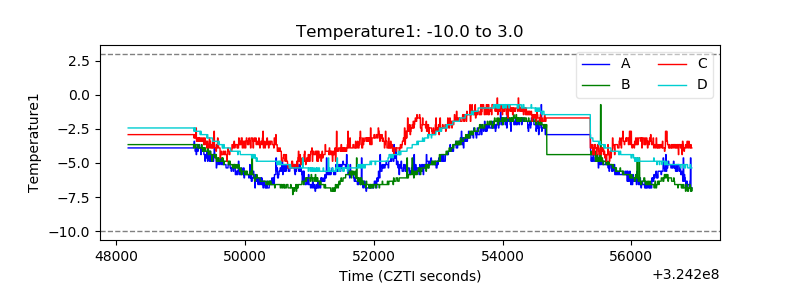 |
| Veto HV Monitor | 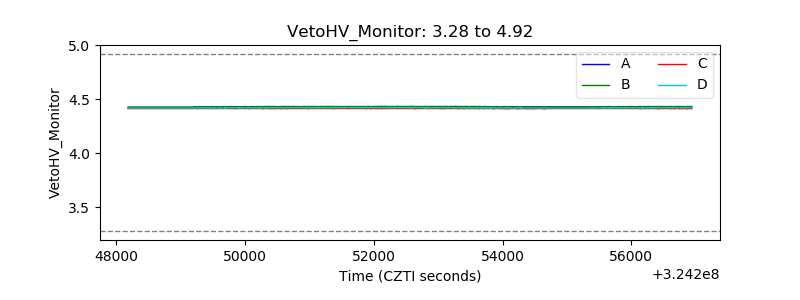 |
| Veto LLD | 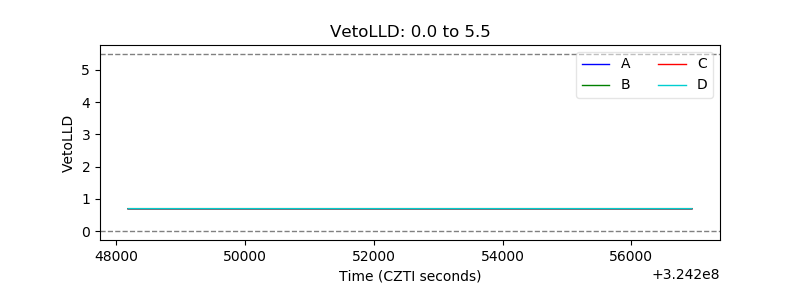 |
| Alpha Counter | 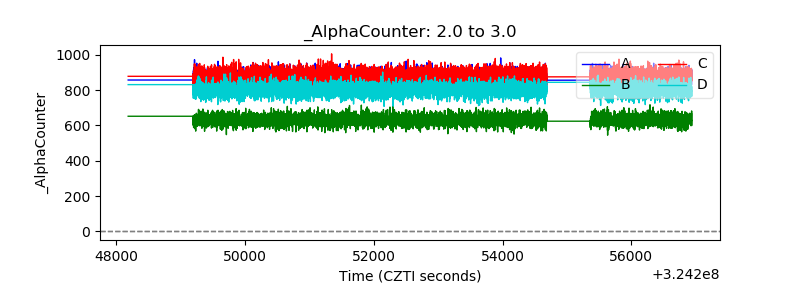 |
| _CPM_Rate | 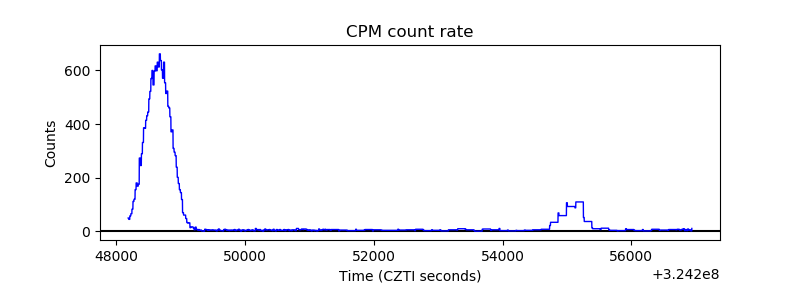 |
| CZT Counter | 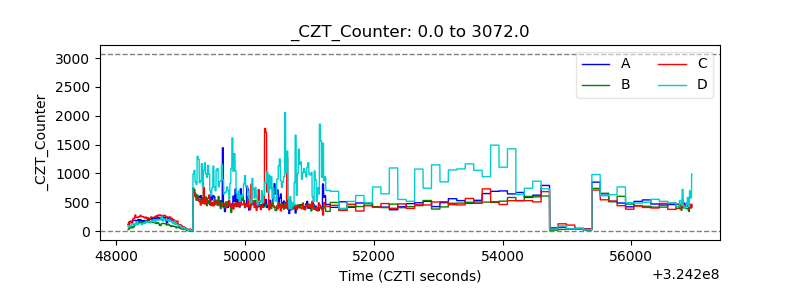 |
| +2.5 Volts monitor |  |
| +5 Volts monitor | 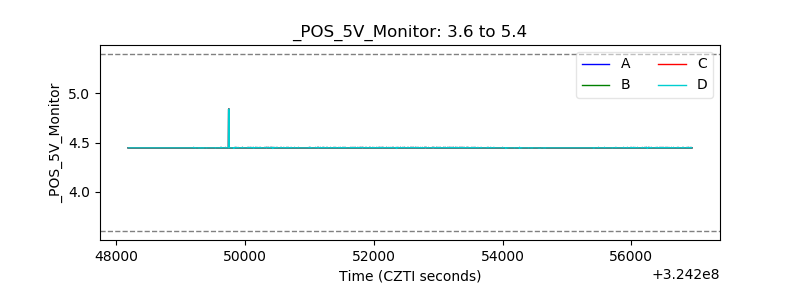 |
| _ROLL_ROT | 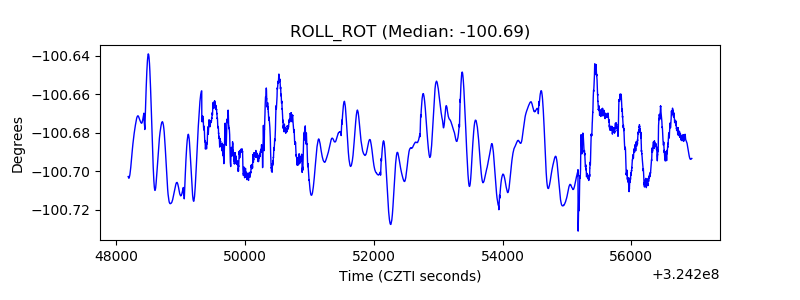 |
| _Roll_DEC | 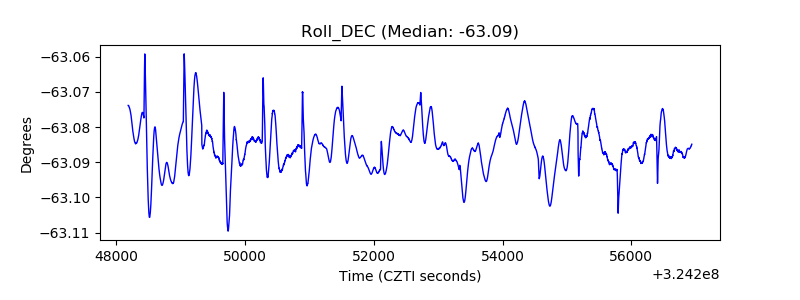 |
| _Roll_RA | 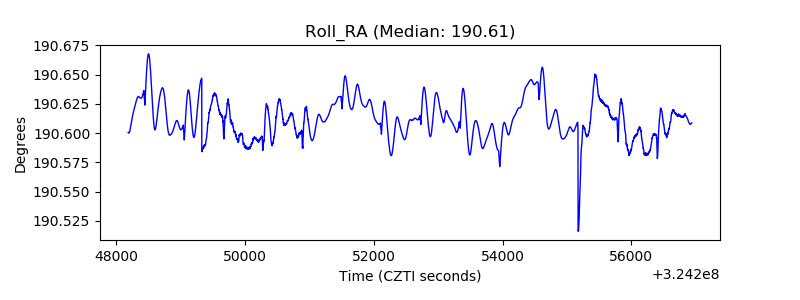 |
| Veto Counter | 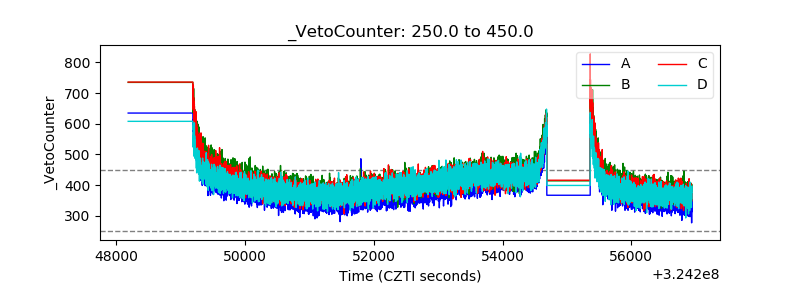 |