| Param | Original file | Final file |
|---|---|---|
| Filename | modeM0/AS1T03_183T01_9000003606_24524cztM0_level2.evt | modeM0/AS1T03_183T01_9000003606_24524cztM0_level2_quad_clean.evt |
| Size (bytes) | 587,548,800 | 131,270,400 |
| Size | 560.3 MB | 125.2 MB |
| Events in quadrant A | 3,957,428 | 886,533 |
| Events in quadrant B | 3,626,835 | 903,586 |
| Events in quadrant C | 3,737,795 | 848,044 |
| Events in quadrant D | 5,963,590 | 815,491 |
| Mode M0 | |||
|---|---|---|---|
| Quadrant | BADHDUFLAG | Total packets | Discarded packets |
| A | 0 | 16552 | 1 |
| B | 0 | 15733 | 1 |
| C | 0 | 16119 | 1 |
| D | 0 | 22997 | 1 |
| Mode SS | |||
|---|---|---|---|
| Quadrant | BADHDUFLAG | Total packets | Discarded packets |
| A | 0 | 150 | 0 |
| B | 0 | 150 | 0 |
| C | 0 | 150 | 0 |
| D | 0 | 150 | 0 |
| Mode M9 | |||
|---|---|---|---|
| Quadrant | BADHDUFLAG | Total packets | Discarded packets |
| A | 0 | 4 | 0 |
| B | 0 | 4 | 0 |
| C | 0 | 4 | 0 |
| D | 0 | 4 | 0 |
| Quadrant | Total seconds | Saturated seconds | Saturation percentage |
|---|---|---|---|
| A | 7511 | 60 | 0.798828% |
| B | 7510 | 48 | 0.639148% |
| C | 7510 | 124 | 1.651132% |
| D | 7511 | 151 | 2.010385% |
Noise dominated data is calculated using 1-second bins in cleaned event files. If a bin has >2000 counts, and if more than 50% of those come from <1% of pixels, then it is considered to be noise-dominated and hence unusable.
| Quadrant | # 1 sec bins | Bins with >0 counts | Bins with >2000 counts | High rate bins dominated by noise | Noise dominated (total time) | Noise dominated (detector-on time) | Marked lightcurve |
|---|---|---|---|---|---|---|---|
| A | 7866 | 7512 | 9 | 9 | 0.11% | 0.12% | 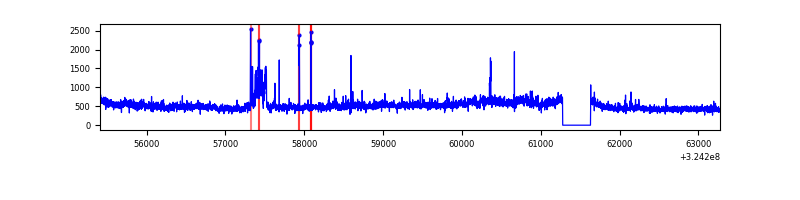 |
| B | 7865 | 7511 | 5 | 5 | 0.06% | 0.07% | 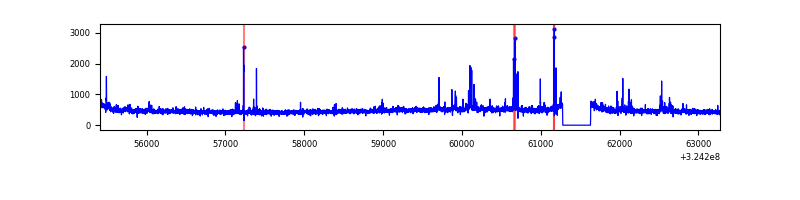 |
| C | 7865 | 7511 | 43 | 43 | 0.55% | 0.57% | 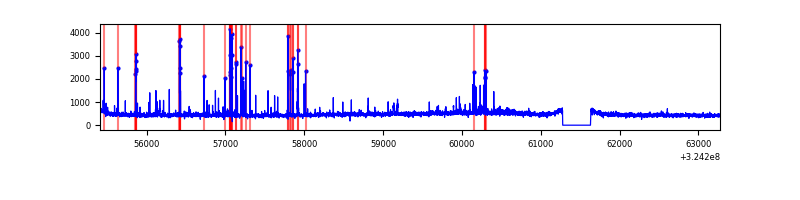 |
| D | 7866 | 7512 | 112 | 112 | 1.42% | 1.49% | 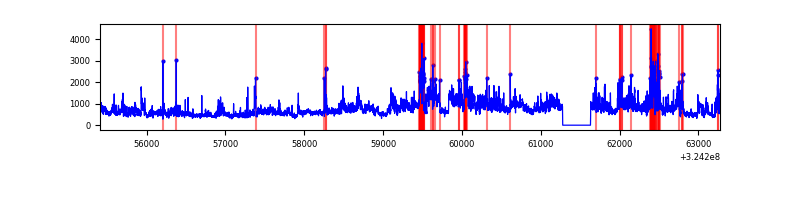 |
Top three noisy pixels from each quadrant. If the there are fewer than three noisy pixels in the level2.evt file, extra rows are filled as -1
| Pixel properties | Quadrant properties | ||||||
|---|---|---|---|---|---|---|---|
| Quadrant | DetID | PixID | Counts | Sigma | Mean | Median | Sigma |
| A | 14 | 111 | 566197 | 3216.56 | 878 | 860 | 175.8 |
| A | 13 | 254 | 13112 | 69.71 | 878 | 860 | 175.8 |
| A | 3 | 137 | 7811 | 39.55 | 878 | 860 | 175.8 |
| B | 3 | 64 | 143103 | 850.62 | 880 | 857 | 167.2 |
| B | 12 | 111 | 20446 | 117.14 | 880 | 857 | 167.2 |
| B | 7 | 202 | 18247 | 103.99 | 880 | 857 | 167.2 |
| C | 10 | 9 | 220072 | 1135.51 | 838 | 843 | 193.1 |
| C | 14 | 238 | 134045 | 689.93 | 838 | 843 | 193.1 |
| C | 2 | 16 | 103178 | 530.05 | 838 | 843 | 193.1 |
| D | 1 | 52 | 2699385 | 13260.84 | 841 | 815 | 203.5 |
| D | 8 | 195 | 46986 | 226.89 | 841 | 815 | 203.5 |
| D | 2 | 234 | 30619 | 146.46 | 841 | 815 | 203.5 |
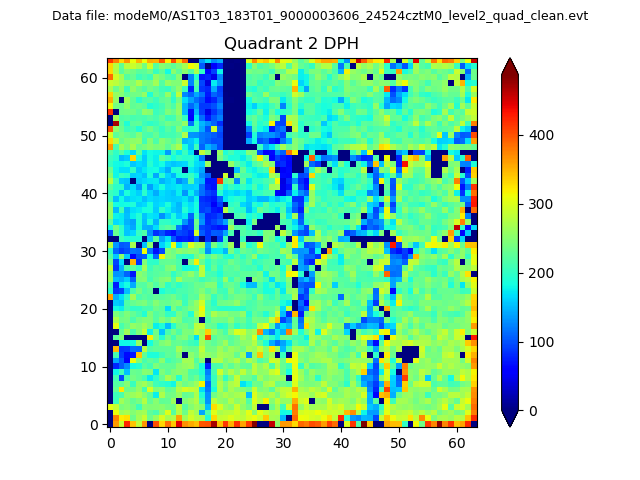
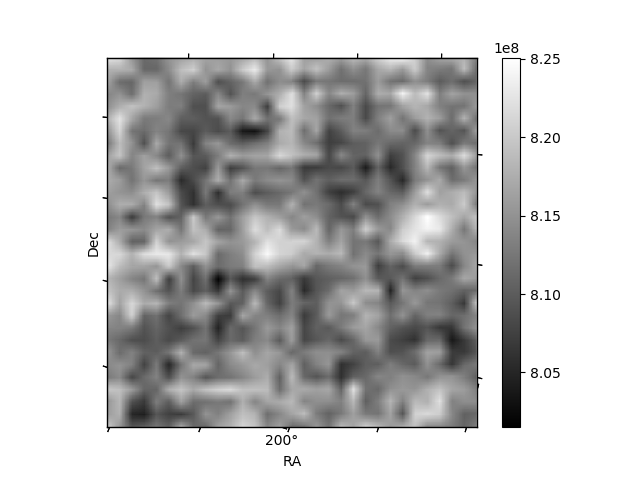
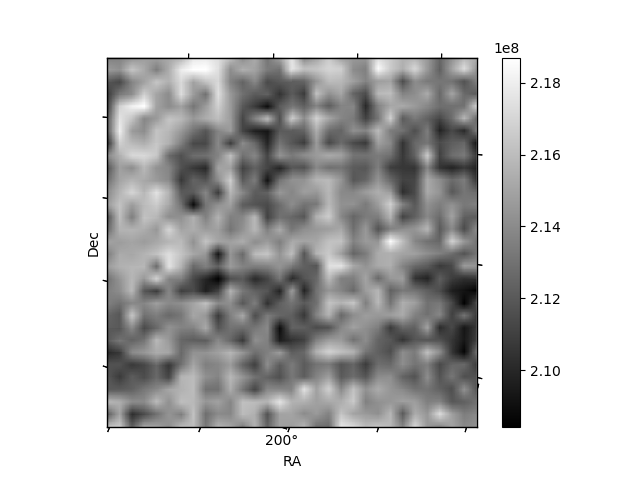
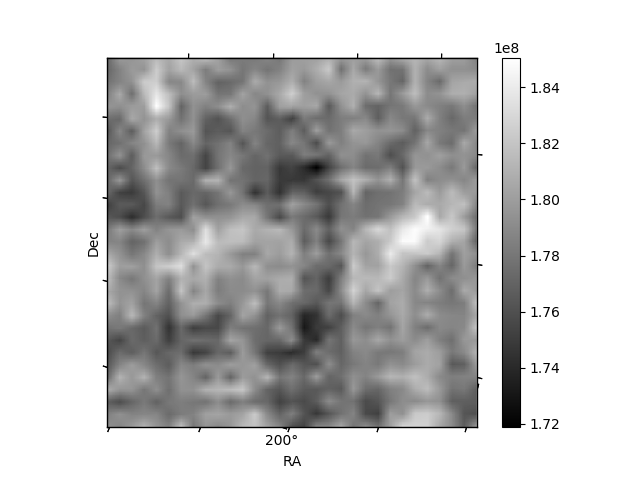
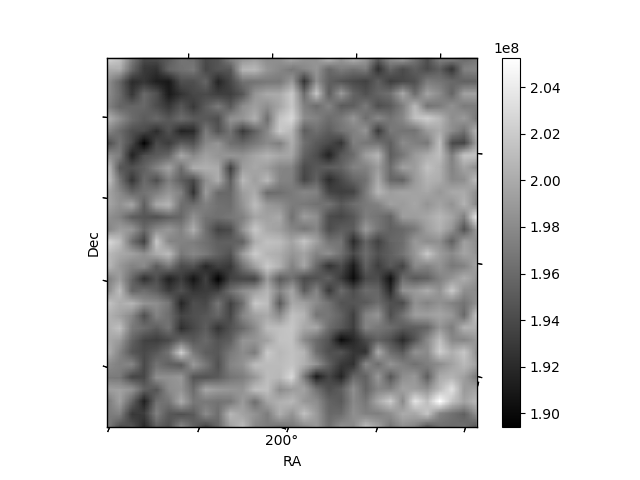
Histogram calculated using DETX and DETY for each event in the final _common_clean file
| Quadrant A | 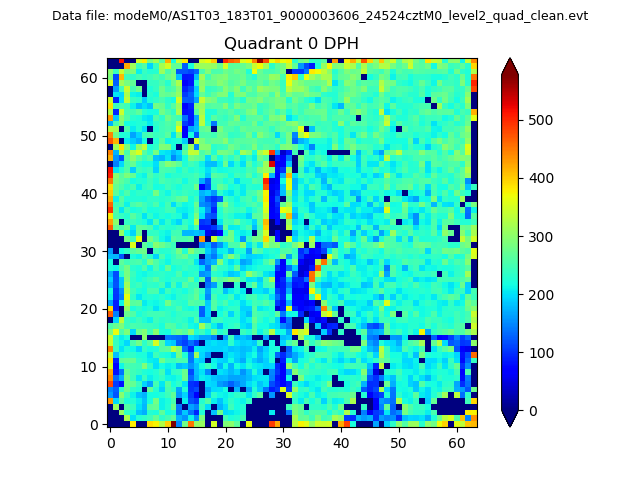 |
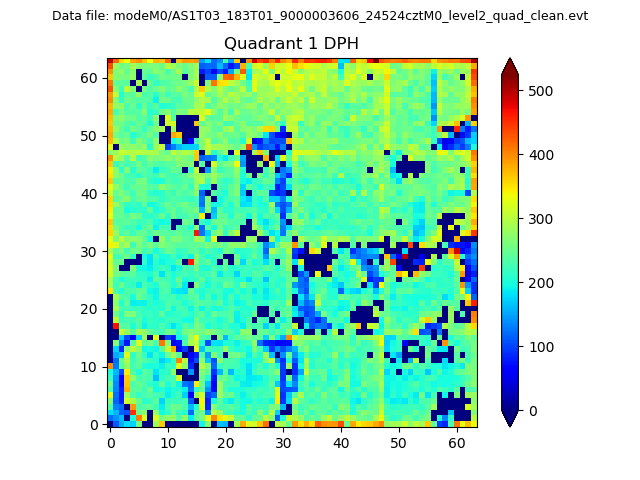 |
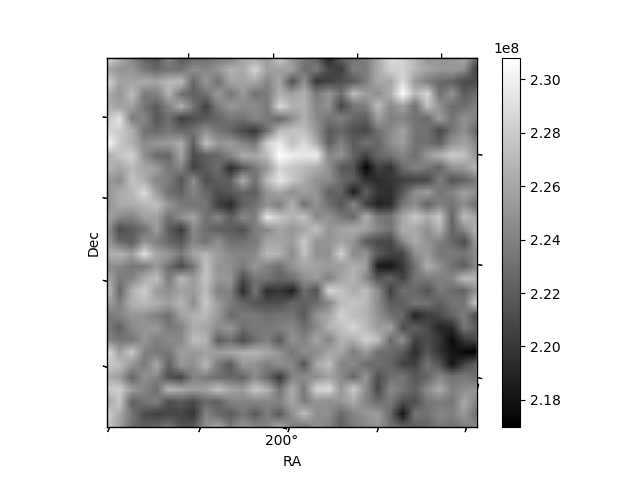
Quadrant B |
|---|---|---|---|
| Quadrant D | 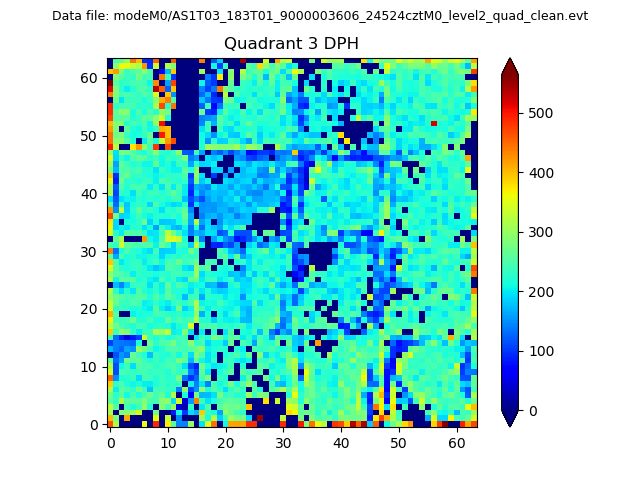 |
 |
Quadrant C |
| Plot type | Count rate plots | Images |
|---|---|---|
| Comparison with Poisson distribution Blue bars denote a histogram of data divided into 1 sec bins. Red curve is a Poisson curve with rate = median count rate of data. |
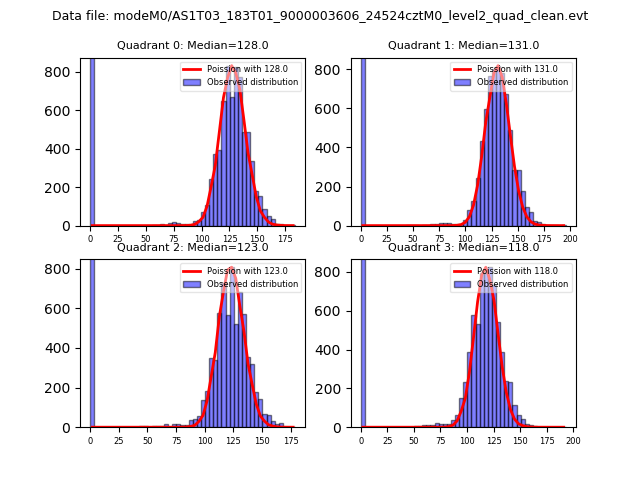 |
 |
| Quadrant-wise count rates Data is divided into 100 sec bins |
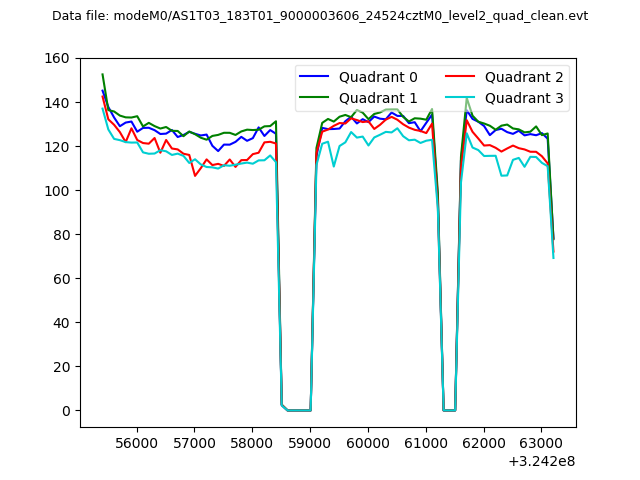 |
|
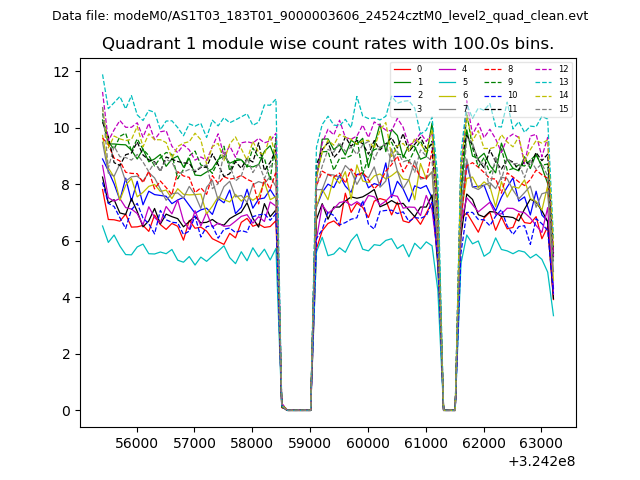
| Module-wise count rates for Quadrant A Data is divided into 100 sec bins |
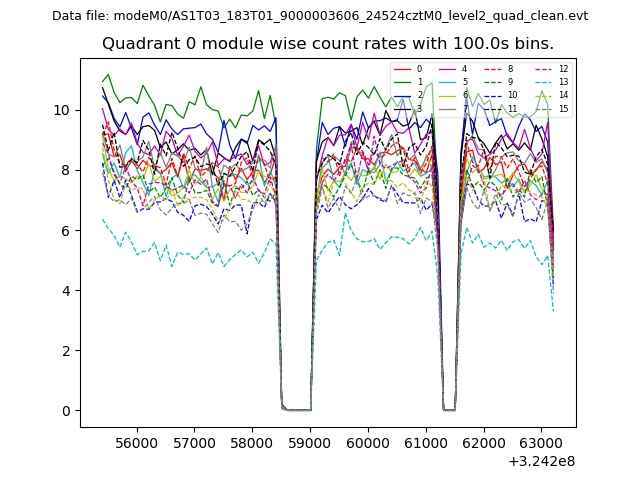 |
 |
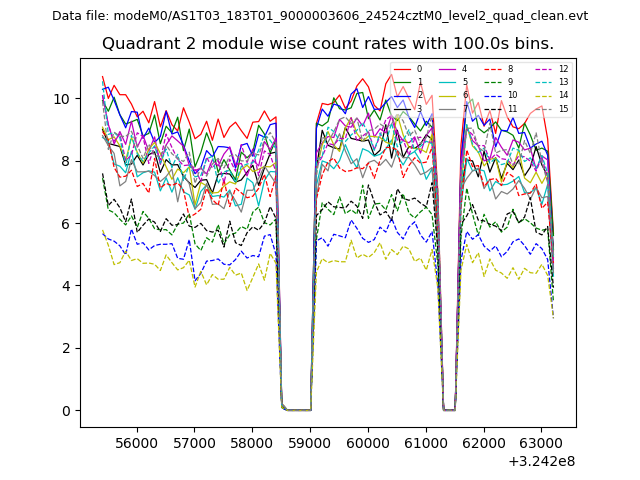
| Module-wise count rates for Quadrant B Data is divided into 100 sec bins |
 |
 |
| Module-wise count rates for Quadrant C Data is divided into 100 sec bins |
 |
 |
| Module-wise count rates for Quadrant D Data is divided into 100 sec bins |
 |
 |
| Parameter | Plot |
|---|---|
| CZT HV Monitor | 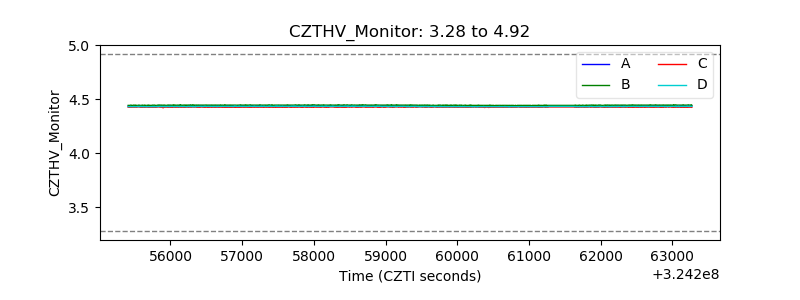 |
| D_VDD |  |
| Temperature 1 | 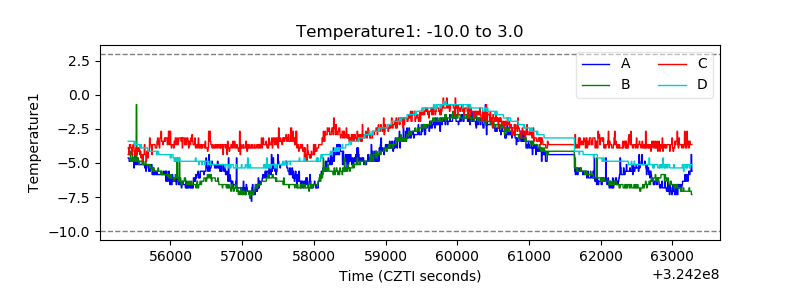 |
| Veto HV Monitor | 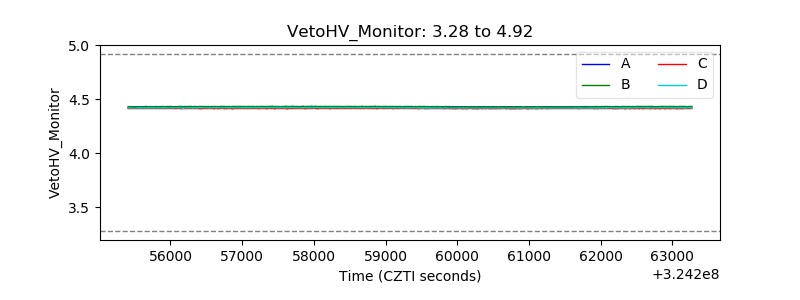 |
| Veto LLD |  |
| Alpha Counter | 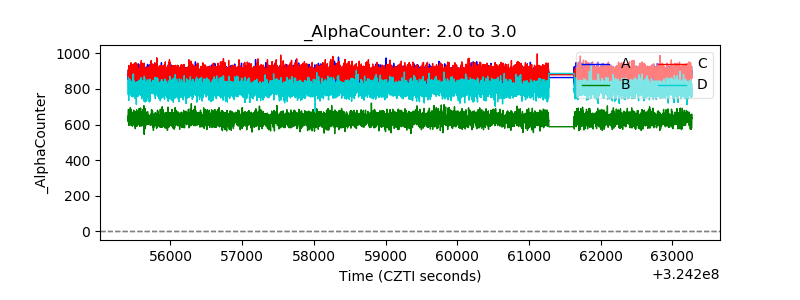 |
| _CPM_Rate | 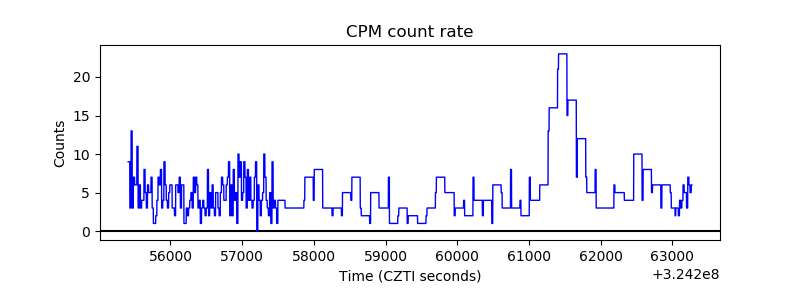 |
| CZT Counter | 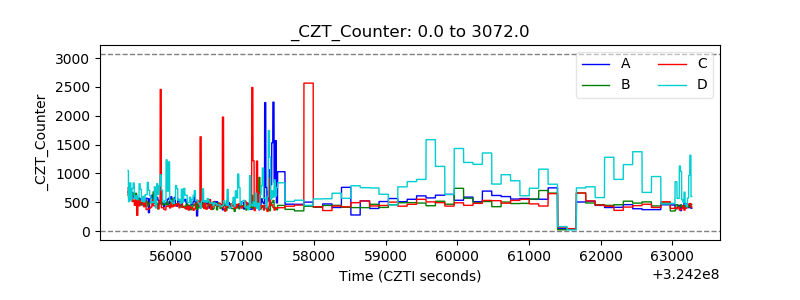 |
| +2.5 Volts monitor |  |
| +5 Volts monitor |  |
| _ROLL_ROT | 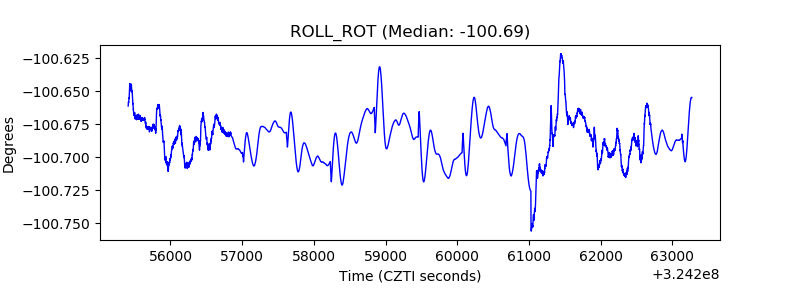 |
| _Roll_DEC | 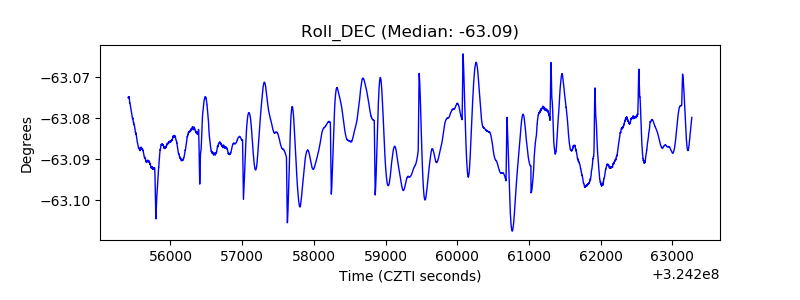 |
| _Roll_RA | 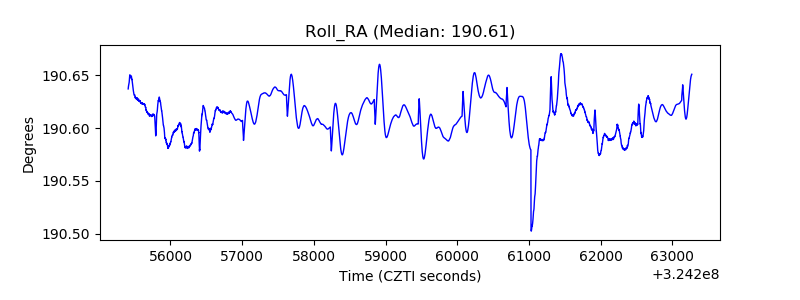 |
| Veto Counter |  |