| Param | Original file | Final file |
|---|---|---|
| Filename | modeM0/AS1T03_183T01_9000003606_24525cztM0_level2.evt | modeM0/AS1T03_183T01_9000003606_24525cztM0_level2_quad_clean.evt |
| Size (bytes) | 613,238,400 | 137,666,880 |
| Size | 584.8 MB | 131.3 MB |
| Events in quadrant A | 3,909,035 | 931,216 |
| Events in quadrant B | 4,212,183 | 939,238 |
| Events in quadrant C | 3,692,577 | 891,580 |
| Events in quadrant D | 6,223,567 | 858,888 |
| Mode M0 | |||
|---|---|---|---|
| Quadrant | BADHDUFLAG | Total packets | Discarded packets |
| A | 0 | 17068 | 2 |
| B | 0 | 17737 | 2 |
| C | 0 | 16220 | 2 |
| D | 0 | 24000 | 2 |
| Mode SS | |||
|---|---|---|---|
| Quadrant | BADHDUFLAG | Total packets | Discarded packets |
| A | 0 | 162 | 0 |
| B | 0 | 162 | 0 |
| C | 0 | 162 | 0 |
| D | 0 | 162 | 0 |
| Mode M9 | |||
|---|---|---|---|
| Quadrant | BADHDUFLAG | Total packets | Discarded packets |
| A | 0 | 6 | 0 |
| B | 0 | 6 | 0 |
| C | 0 | 6 | 0 |
| D | 0 | 6 | 0 |
| Quadrant | Total seconds | Saturated seconds | Saturation percentage |
|---|---|---|---|
| A | 7889 | 101 | 1.280264% |
| B | 7889 | 286 | 3.625301% |
| C | 7889 | 165 | 2.091520% |
| D | 7889 | 258 | 3.270376% |
Noise dominated data is calculated using 1-second bins in cleaned event files. If a bin has >2000 counts, and if more than 50% of those come from <1% of pixels, then it is considered to be noise-dominated and hence unusable.
| Quadrant | # 1 sec bins | Bins with >0 counts | Bins with >2000 counts | High rate bins dominated by noise | Noise dominated (total time) | Noise dominated (detector-on time) | Marked lightcurve |
|---|---|---|---|---|---|---|---|
| A | 8424 | 7891 | 1 | 1 | 0.01% | 0.01% | 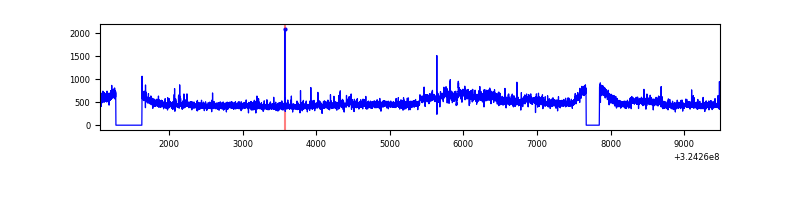 |
| B | 8424 | 7891 | 76 | 76 | 0.90% | 0.96% | 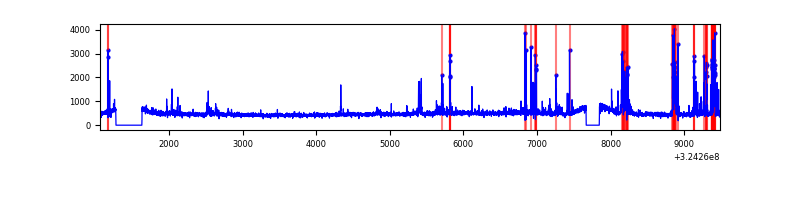 |
| C | 8424 | 7891 | 1 | 1 | 0.01% | 0.01% | 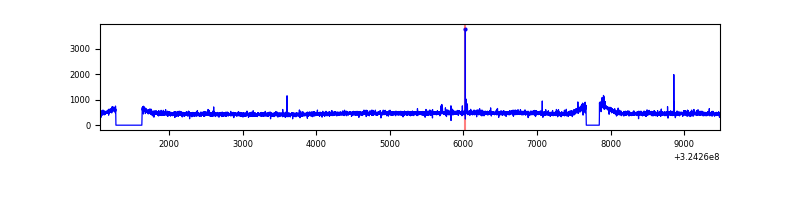 |
| D | 8424 | 7891 | 111 | 111 | 1.32% | 1.41% | 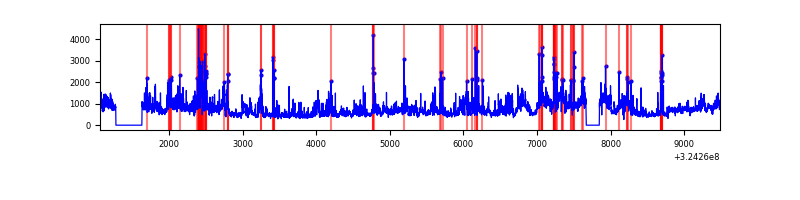 |
Top three noisy pixels from each quadrant. If the there are fewer than three noisy pixels in the level2.evt file, extra rows are filled as -1
| Pixel properties | Quadrant properties | ||||||
|---|---|---|---|---|---|---|---|
| Quadrant | DetID | PixID | Counts | Sigma | Mean | Median | Sigma |
| A | 14 | 111 | 274022 | 1451.65 | 939 | 917 | 188.1 |
| A | 6 | 16 | 14432 | 71.84 | 939 | 917 | 188.1 |
| A | 13 | 254 | 13622 | 67.53 | 939 | 917 | 188.1 |
| B | 3 | 64 | 528502 | 2941.86 | 935 | 910 | 179.3 |
| B | 12 | 111 | 21976 | 117.46 | 935 | 910 | 179.3 |
| B | 11 | 111 | 19281 | 102.44 | 935 | 910 | 179.3 |
| C | 14 | 238 | 142438 | 675.54 | 899 | 901 | 209.5 |
| C | 2 | 16 | 24694 | 113.56 | 899 | 901 | 209.5 |
| C | 3 | 233 | 12616 | 55.91 | 899 | 901 | 209.5 |
| D | 1 | 52 | 2647281 | 12089.18 | 899 | 868 | 218.9 |
| D | 8 | 195 | 64210 | 289.36 | 899 | 868 | 218.9 |
| D | 9 | 1 | 61620 | 277.52 | 899 | 868 | 218.9 |
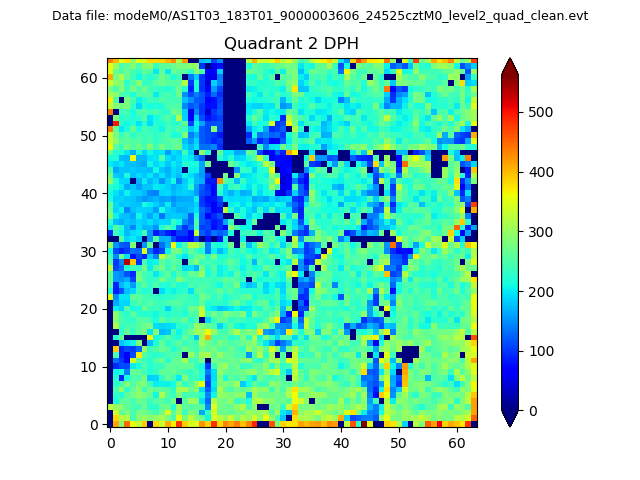
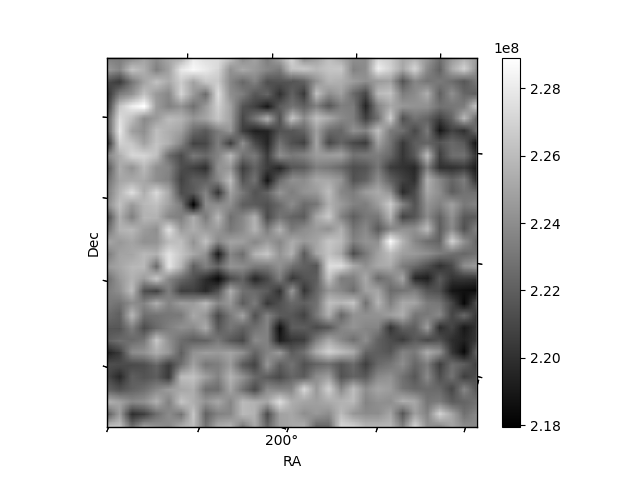
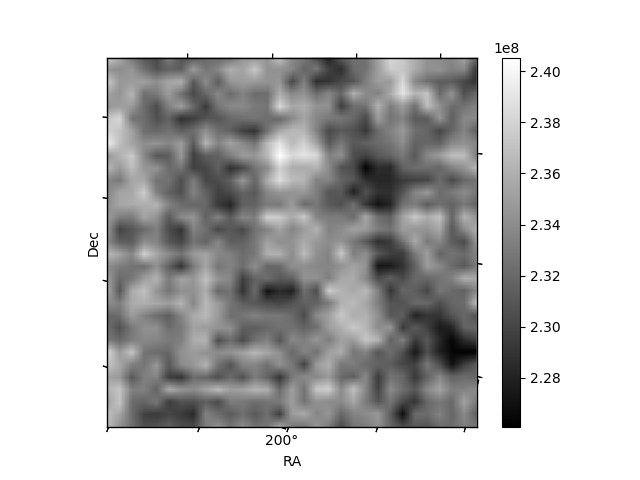
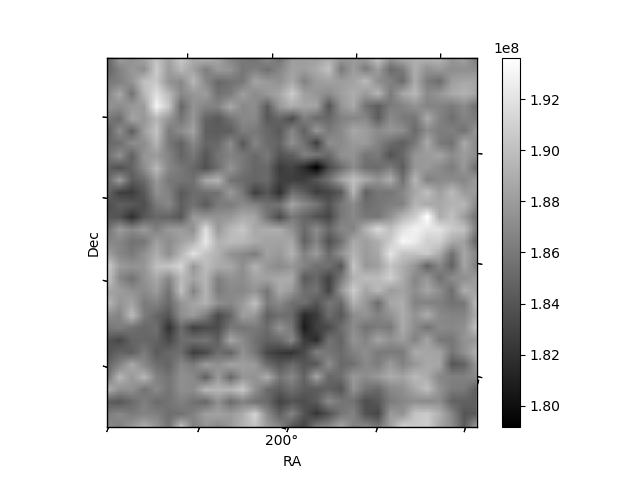
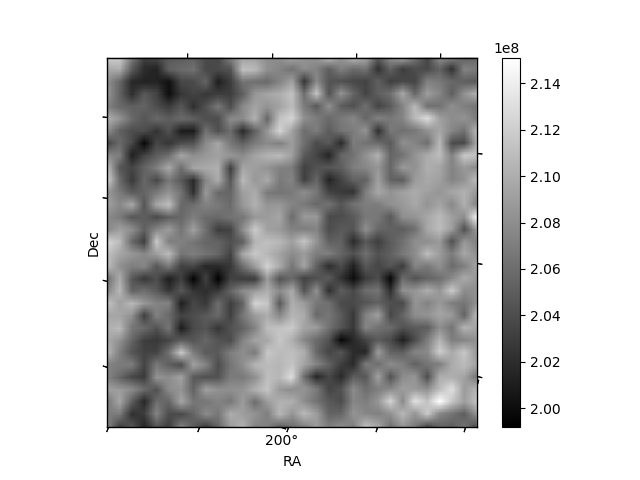
Histogram calculated using DETX and DETY for each event in the final _common_clean file
| Quadrant A | 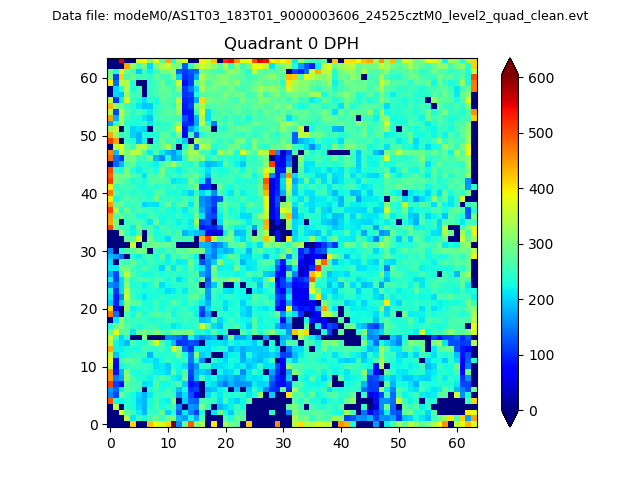 |
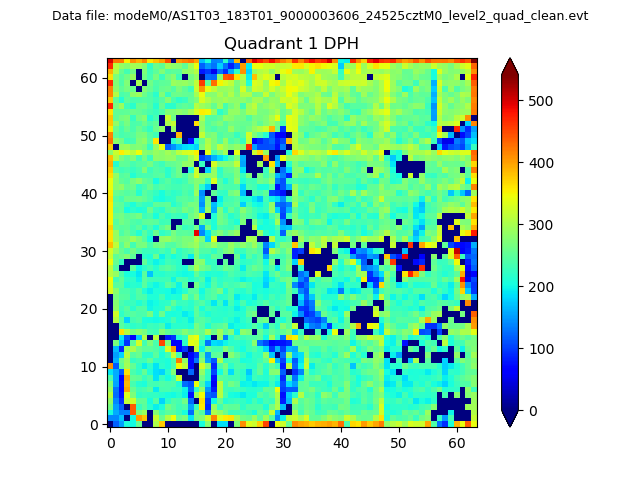 |
Quadrant B |
|---|---|---|---|
| Quadrant D | 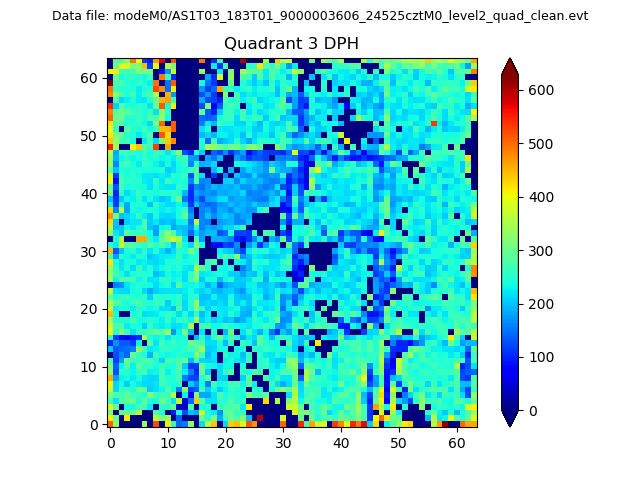 |
 |
Quadrant C |
| Plot type | Count rate plots | Images |
|---|---|---|
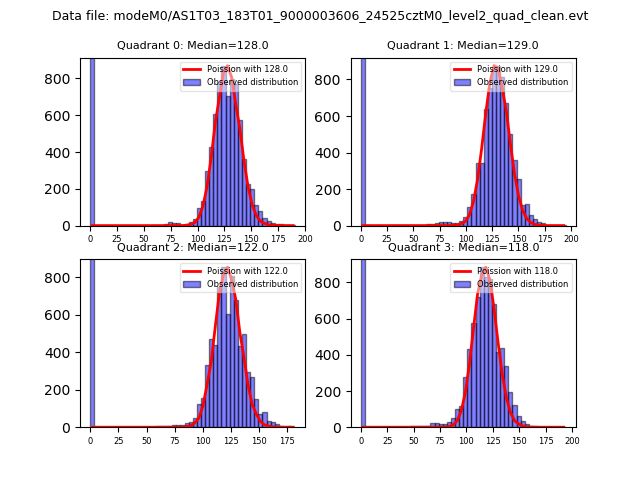
| Comparison with Poisson distribution Blue bars denote a histogram of data divided into 1 sec bins. Red curve is a Poisson curve with rate = median count rate of data. |
 |
 |
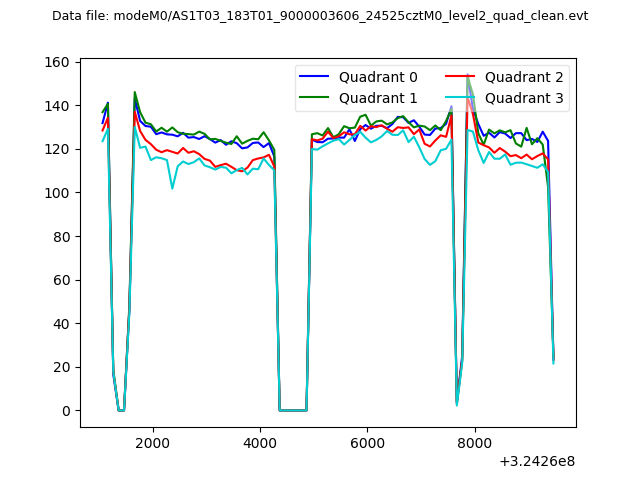
| Quadrant-wise count rates Data is divided into 100 sec bins |
 |
|
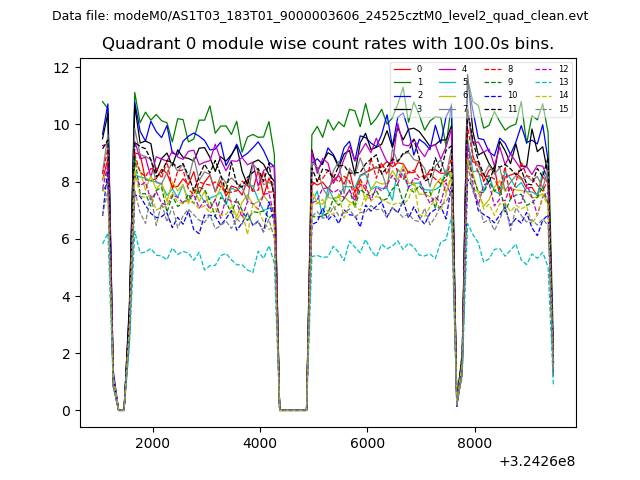
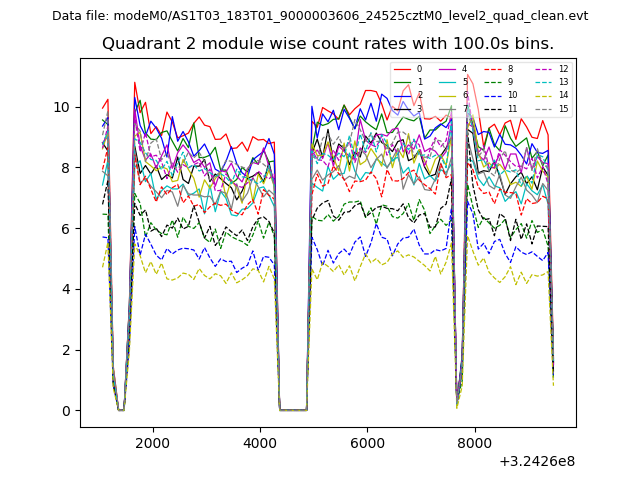
| Module-wise count rates for Quadrant A Data is divided into 100 sec bins |
 |
 |
| Module-wise count rates for Quadrant B Data is divided into 100 sec bins |
 |
 |
| Module-wise count rates for Quadrant C Data is divided into 100 sec bins |
 |
 |
| Module-wise count rates for Quadrant D Data is divided into 100 sec bins |
 |
 |
| Parameter | Plot |
|---|---|
| CZT HV Monitor | 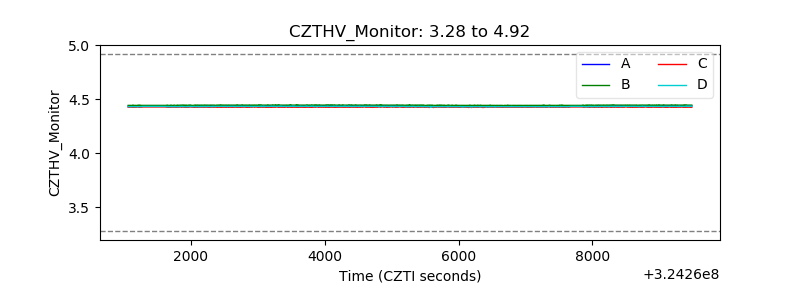 |
| D_VDD | 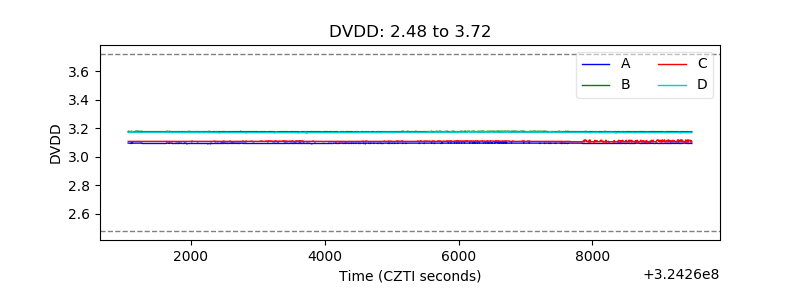 |
| Temperature 1 | 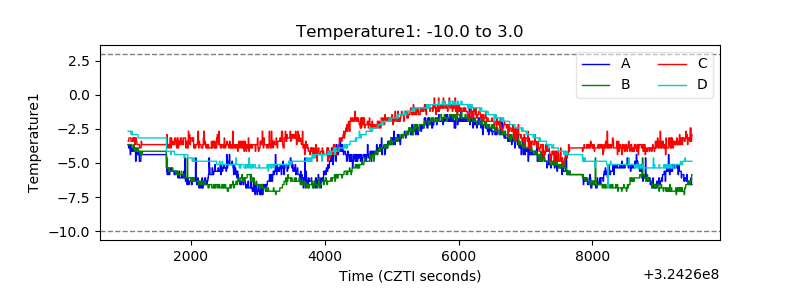 |
| Veto HV Monitor | 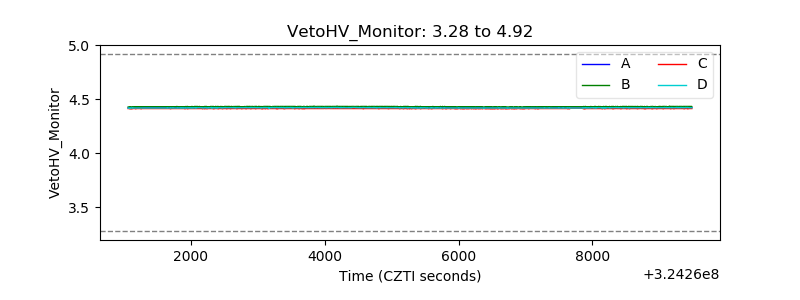 |
| Veto LLD |  |
| Alpha Counter | 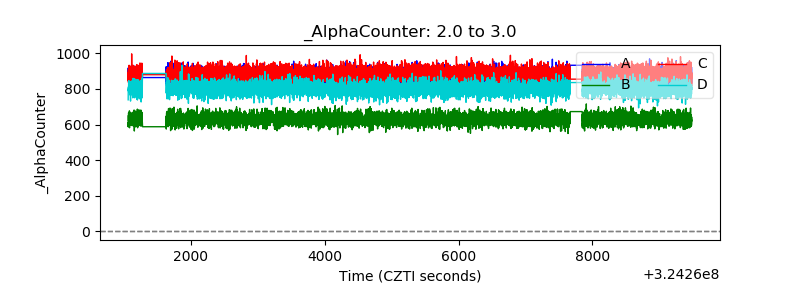 |
| _CPM_Rate | 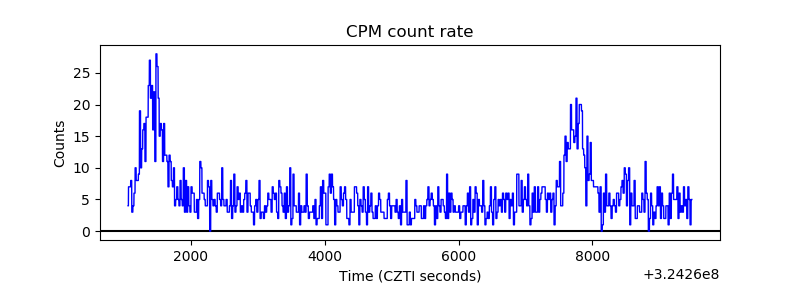 |
| CZT Counter | 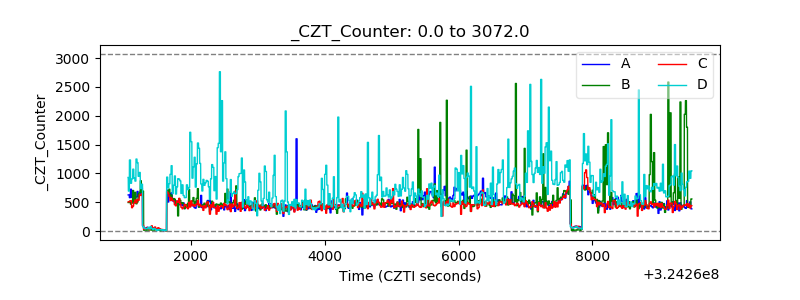 |
| +2.5 Volts monitor | 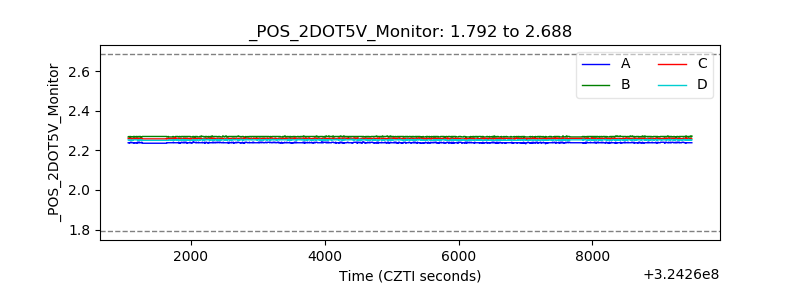 |
| +5 Volts monitor |  |
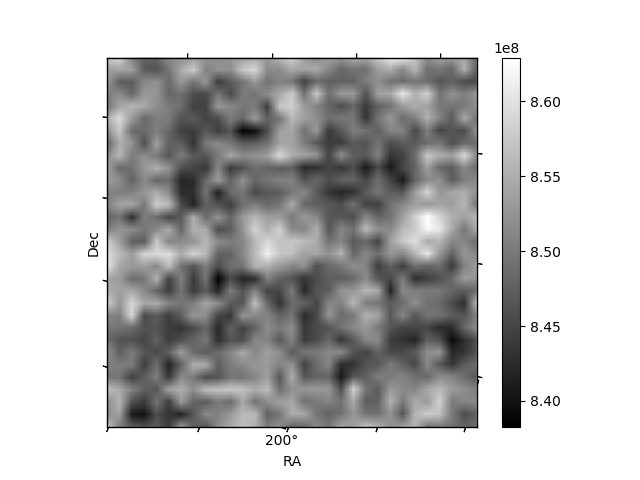
| _ROLL_ROT | 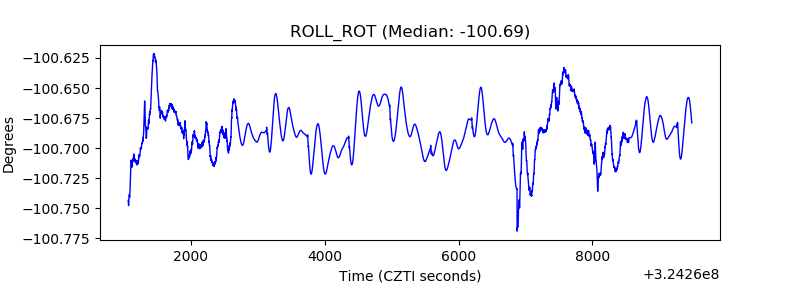 |
| _Roll_DEC | 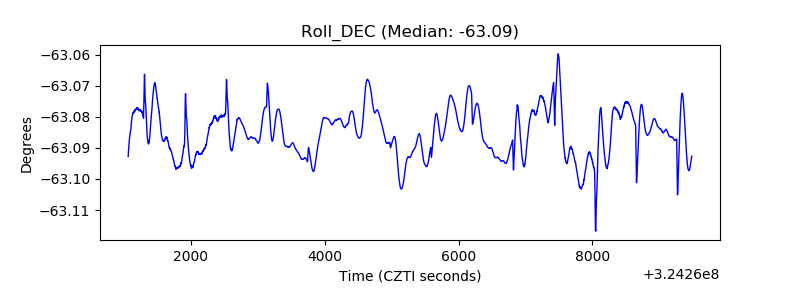 |
| _Roll_RA | 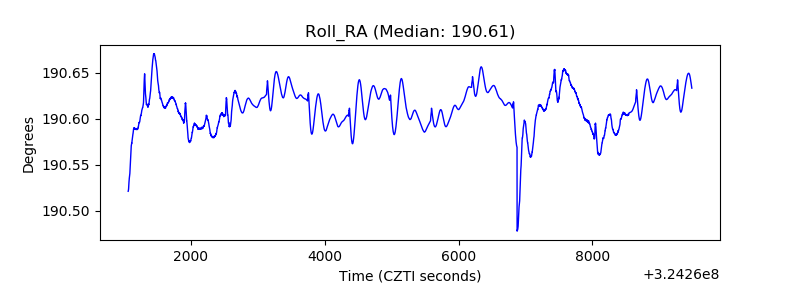 |
| Veto Counter | 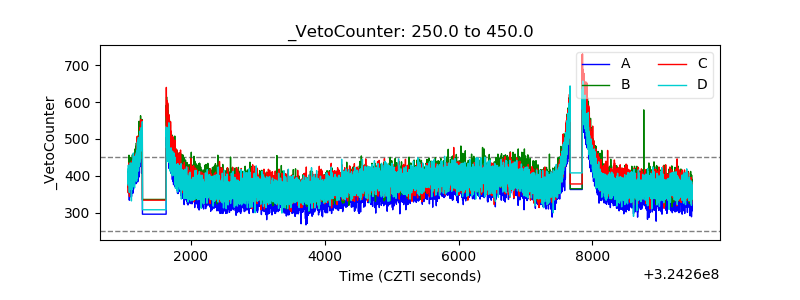 |