| Param | Original file | Final file |
|---|---|---|
| Filename | modeM0/AS1T03_183T01_9000003606_24526cztM0_level2.evt | modeM0/AS1T03_183T01_9000003606_24526cztM0_level2_quad_clean.evt |
| Size (bytes) | 663,114,240 | 144,305,280 |
| Size | 632.4 MB | 137.6 MB |
| Events in quadrant A | 3,977,839 | 975,066 |
| Events in quadrant B | 4,690,012 | 983,405 |
| Events in quadrant C | 4,483,469 | 934,693 |
| Events in quadrant D | 6,370,078 | 901,853 |
| Mode M0 | |||
|---|---|---|---|
| Quadrant | BADHDUFLAG | Total packets | Discarded packets |
| A | 0 | 17234 | 2 |
| B | 0 | 19276 | 2 |
| C | 0 | 18751 | 2 |
| D | 0 | 24670 | 2 |
| Mode SS | |||
|---|---|---|---|
| Quadrant | BADHDUFLAG | Total packets | Discarded packets |
| A | 0 | 168 | 0 |
| B | 0 | 168 | 0 |
| C | 0 | 168 | 0 |
| D | 0 | 168 | 0 |
| Mode M9 | |||
|---|---|---|---|
| Quadrant | BADHDUFLAG | Total packets | Discarded packets |
| A | 0 | 6 | 0 |
| B | 0 | 6 | 0 |
| C | 0 | 6 | 0 |
| D | 0 | 6 | 0 |
| Quadrant | Total seconds | Saturated seconds | Saturation percentage |
|---|---|---|---|
| A | 8286 | 142 | 1.713734% |
| B | 8286 | 377 | 4.549843% |
| C | 8287 | 458 | 5.526729% |
| D | 8287 | 317 | 3.825268% |
Noise dominated data is calculated using 1-second bins in cleaned event files. If a bin has >2000 counts, and if more than 50% of those come from <1% of pixels, then it is considered to be noise-dominated and hence unusable.
| Quadrant | # 1 sec bins | Bins with >0 counts | Bins with >2000 counts | High rate bins dominated by noise | Noise dominated (total time) | Noise dominated (detector-on time) | Marked lightcurve |
|---|---|---|---|---|---|---|---|
| A | 8841 | 8289 | 1 | 1 | 0.01% | 0.01% | 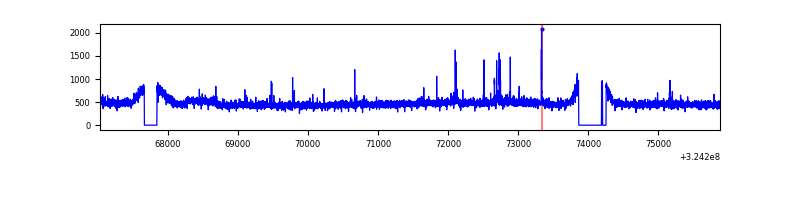 |
| B | 8841 | 8289 | 102 | 102 | 1.15% | 1.23% | 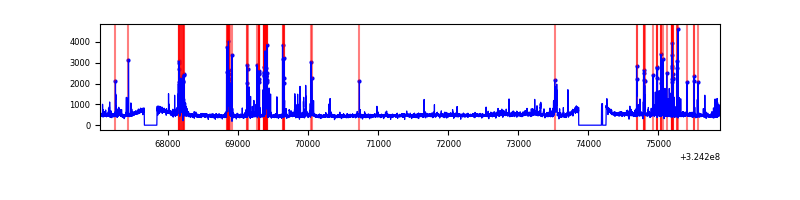 |
| C | 8842 | 8290 | 172 | 172 | 1.95% | 2.07% | 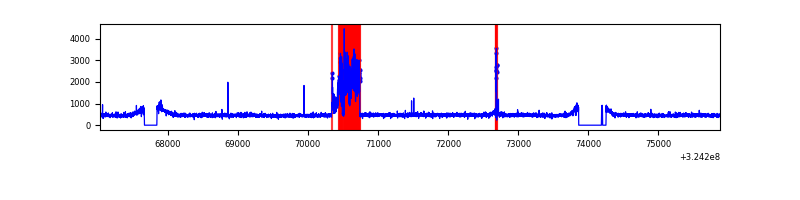 |
| D | 8842 | 8290 | 96 | 96 | 1.09% | 1.16% | 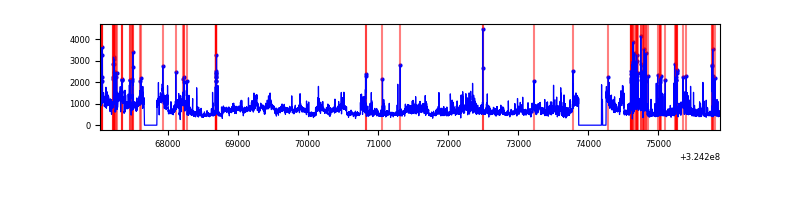 |
Top three noisy pixels from each quadrant. If the there are fewer than three noisy pixels in the level2.evt file, extra rows are filled as -1
| Pixel properties | Quadrant properties | ||||||
|---|---|---|---|---|---|---|---|
| Quadrant | DetID | PixID | Counts | Sigma | Mean | Median | Sigma |
| A | 14 | 111 | 81583 | 401.12 | 994 | 969 | 201.0 |
| A | 6 | 16 | 65704 | 322.11 | 994 | 969 | 201.0 |
| A | 13 | 254 | 13664 | 63.17 | 994 | 969 | 201.0 |
| B | 3 | 64 | 772452 | 4081.5 | 984 | 955 | 189.0 |
| B | 4 | 200 | 42028 | 217.29 | 984 | 955 | 189.0 |
| B | 12 | 111 | 23315 | 118.29 | 984 | 955 | 189.0 |
| C | 2 | 16 | 626724 | 2855.37 | 942 | 946 | 219.2 |
| C | 14 | 238 | 148501 | 673.28 | 942 | 946 | 219.2 |
| C | 3 | 233 | 12700 | 53.63 | 942 | 946 | 219.2 |
| D | 1 | 52 | 2479419 | 10751.0 | 950 | 921 | 230.5 |
| D | 9 | 1 | 197288 | 851.78 | 950 | 921 | 230.5 |
| D | 12 | 218 | 55592 | 237.15 | 950 | 921 | 230.5 |
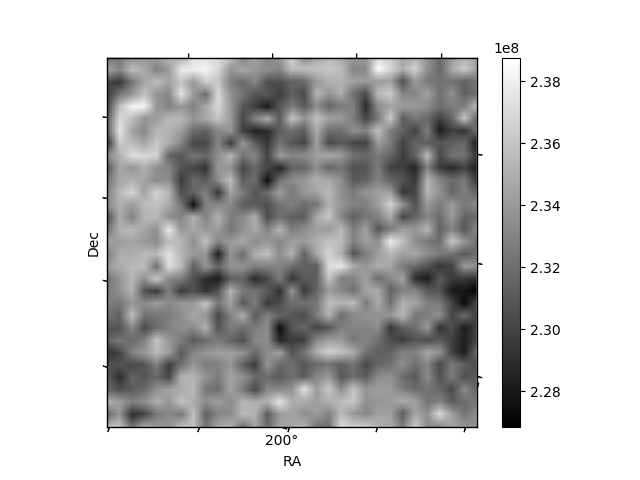
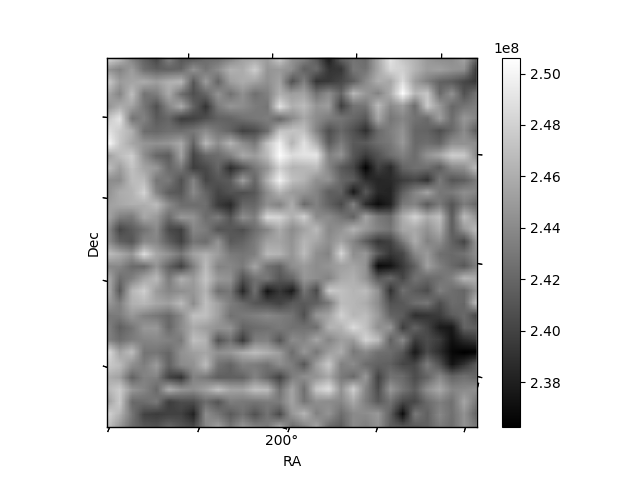
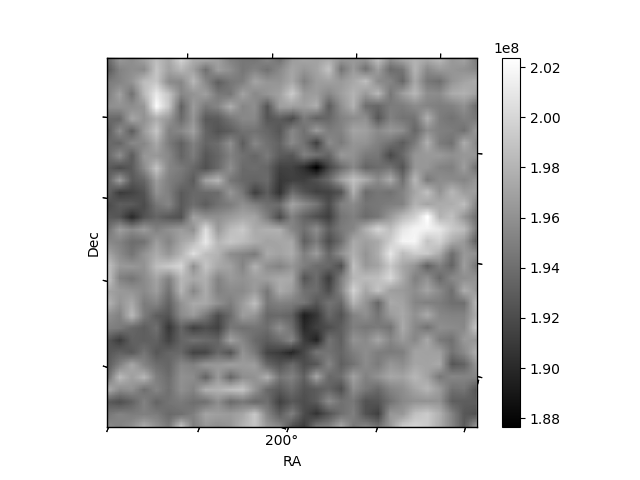
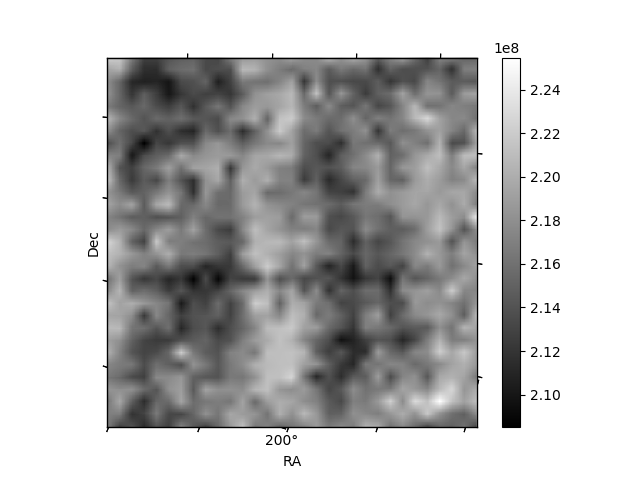
Histogram calculated using DETX and DETY for each event in the final _common_clean file
| Quadrant A | 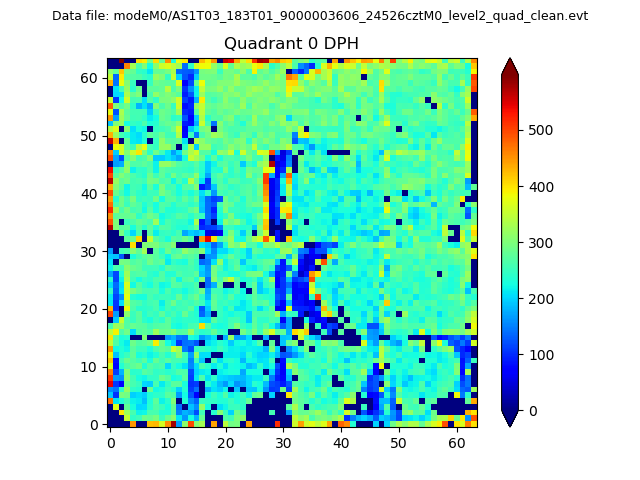 |
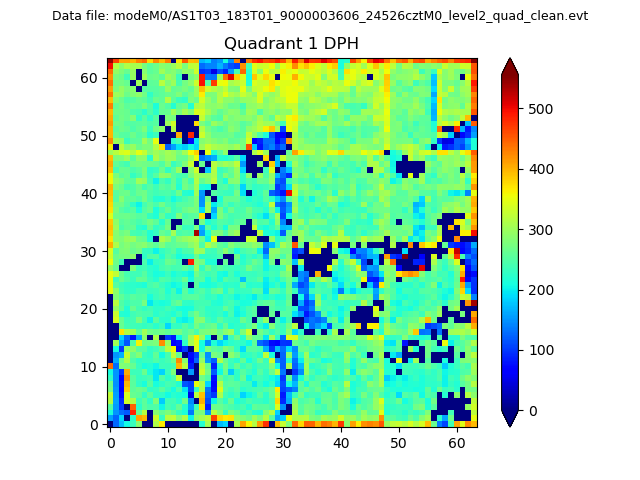 |
Quadrant B |
|---|---|---|---|
| Quadrant D | 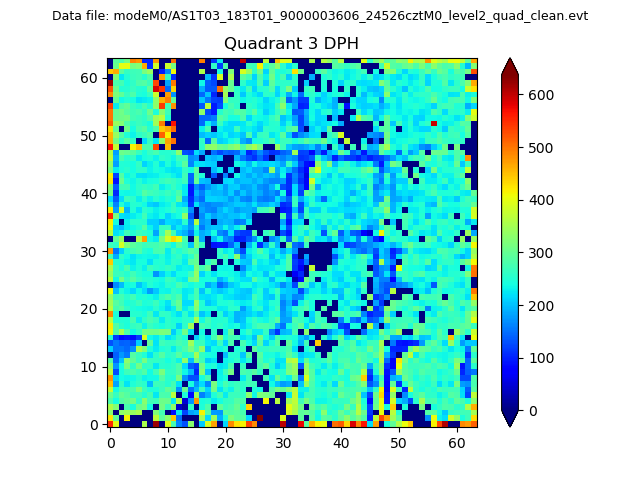 |
 |
Quadrant C |
| Plot type | Count rate plots | Images |
|---|---|---|
| Comparison with Poisson distribution Blue bars denote a histogram of data divided into 1 sec bins. Red curve is a Poisson curve with rate = median count rate of data. |
 |
 |
| Quadrant-wise count rates Data is divided into 100 sec bins |
 |
|
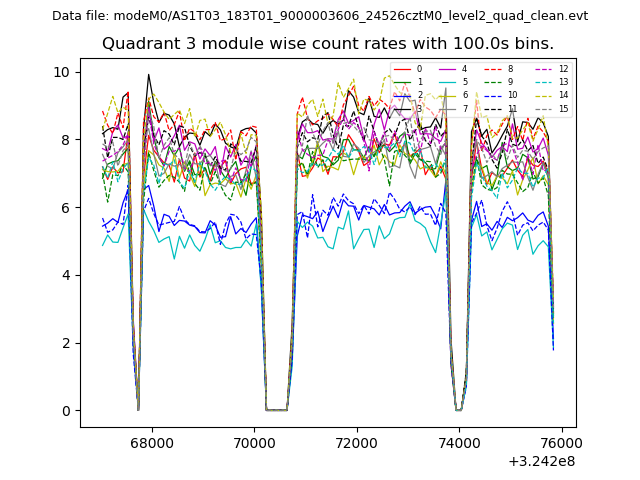
| Module-wise count rates for Quadrant A Data is divided into 100 sec bins |
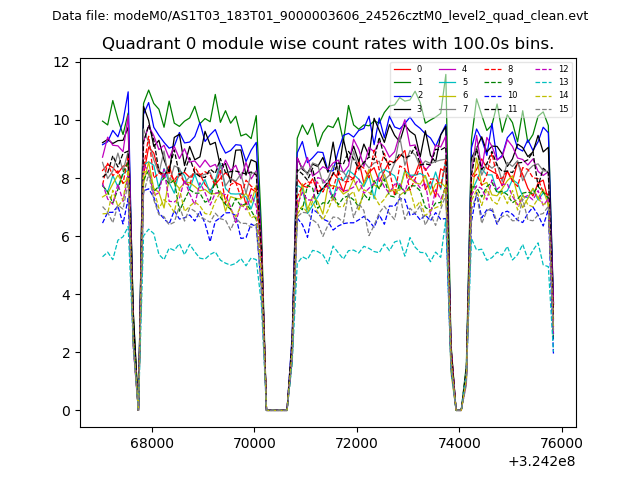 |
 |
| Module-wise count rates for Quadrant B Data is divided into 100 sec bins |
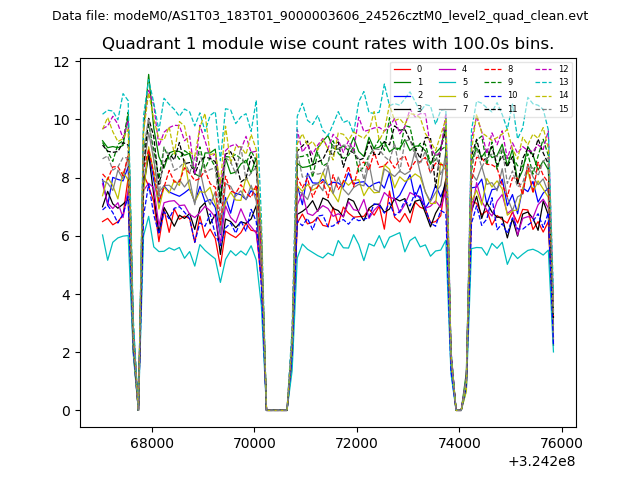 |
 |
| Module-wise count rates for Quadrant C Data is divided into 100 sec bins |
 |
 |
| Module-wise count rates for Quadrant D Data is divided into 100 sec bins |
 |
 |
| Parameter | Plot |
|---|---|
| CZT HV Monitor | 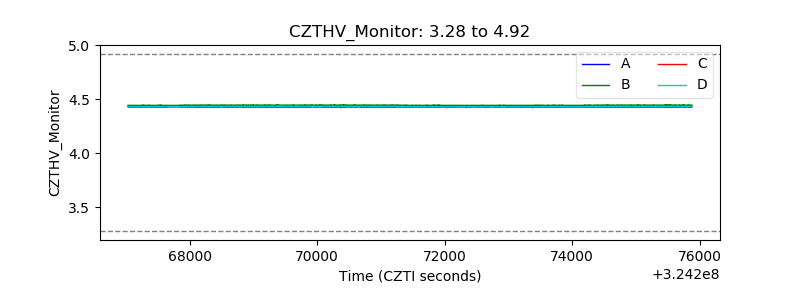 |
| D_VDD | 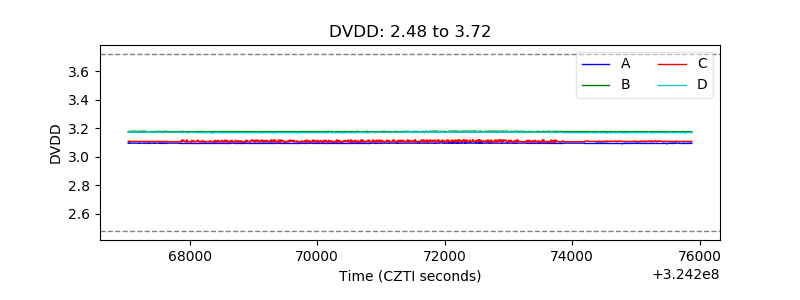 |
| Temperature 1 | 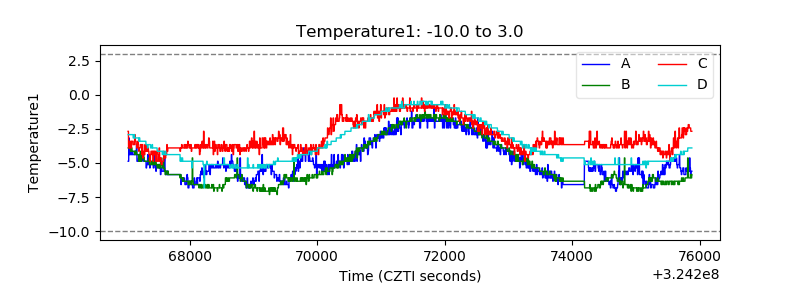 |
| Veto HV Monitor | 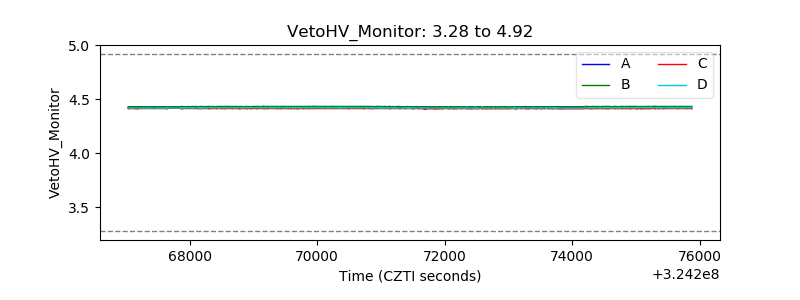 |
| Veto LLD |  |
| Alpha Counter | 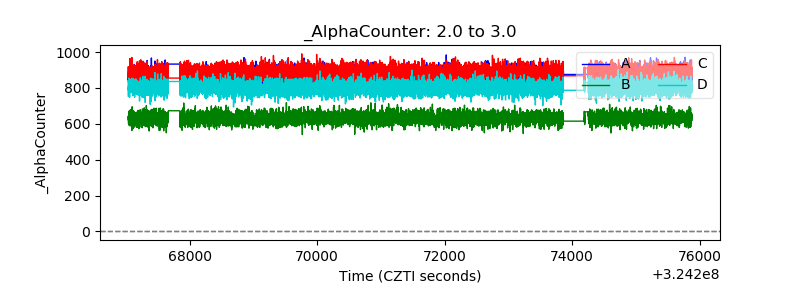 |
| _CPM_Rate | 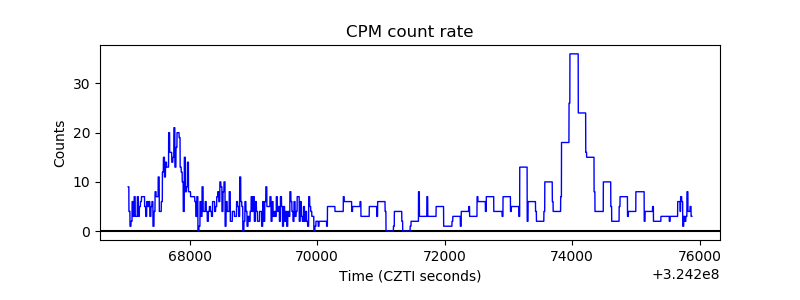 |
| CZT Counter |  |
| +2.5 Volts monitor |  |
| +5 Volts monitor |  |
| _ROLL_ROT | 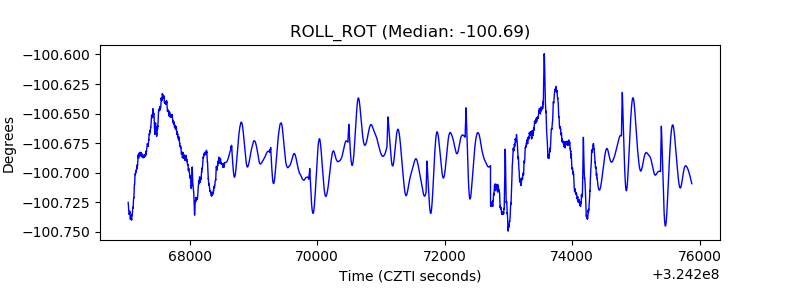 |
| _Roll_DEC | 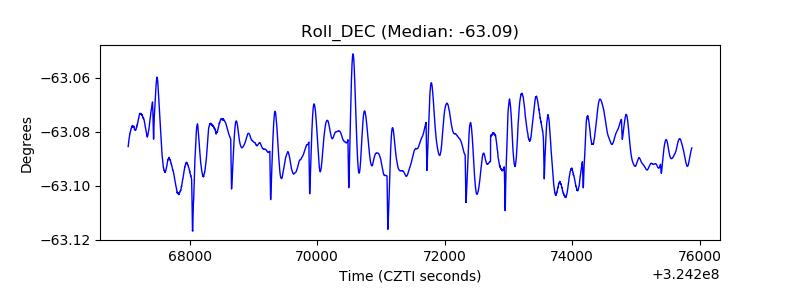 |
| _Roll_RA | 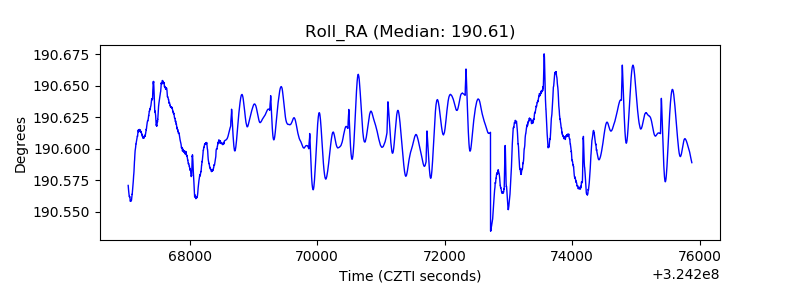 |
| Veto Counter | 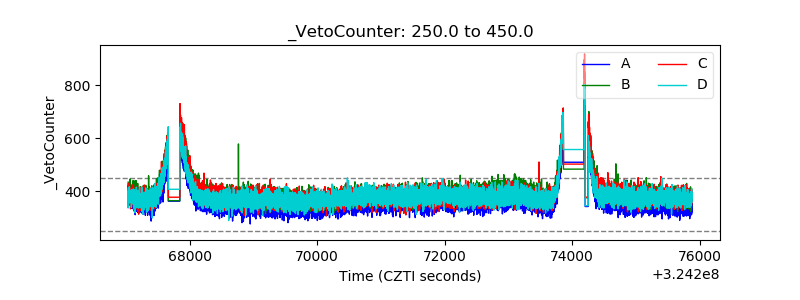 |