| Param | Original file | Final file |
|---|---|---|
| Filename | modeM0/AS1T03_183T01_9000003606_24528cztM0_level2.evt | modeM0/AS1T03_183T01_9000003606_24528cztM0_level2_quad_clean.evt |
| Size (bytes) | 867,767,040 | 186,672,960 |
| Size | 827.6 MB | 178.0 MB |
| Events in quadrant A | 5,420,847 | 1,248,288 |
| Events in quadrant B | 7,304,556 | 1,245,389 |
| Events in quadrant C | 5,198,679 | 1,215,674 |
| Events in quadrant D | 7,599,475 | 1,170,022 |
| Mode M0 | |||
|---|---|---|---|
| Quadrant | BADHDUFLAG | Total packets | Discarded packets |
| A | 0 | 22918 | 1 |
| B | 0 | 28956 | 1 |
| C | 0 | 22770 | 1 |
| D | 0 | 29931 | 1 |
| Mode SS | |||
|---|---|---|---|
| Quadrant | BADHDUFLAG | Total packets | Discarded packets |
| A | 0 | 226 | 0 |
| B | 0 | 226 | 0 |
| C | 0 | 226 | 0 |
| D | 0 | 226 | 0 |
| Mode M9 | |||
|---|---|---|---|
| Quadrant | BADHDUFLAG | Total packets | Discarded packets |
| A | 0 | 5 | 0 |
| B | 0 | 5 | 0 |
| C | 0 | 5 | 0 |
| D | 0 | 5 | 0 |
| Quadrant | Total seconds | Saturated seconds | Saturation percentage |
|---|---|---|---|
| A | 11189 | 106 | 0.947359% |
| B | 11189 | 612 | 5.469658% |
| C | 11189 | 143 | 1.278041% |
| D | 11189 | 347 | 3.101260% |
Noise dominated data is calculated using 1-second bins in cleaned event files. If a bin has >2000 counts, and if more than 50% of those come from <1% of pixels, then it is considered to be noise-dominated and hence unusable.
| Quadrant | # 1 sec bins | Bins with >0 counts | Bins with >2000 counts | High rate bins dominated by noise | Noise dominated (total time) | Noise dominated (detector-on time) | Marked lightcurve |
|---|---|---|---|---|---|---|---|
| A | 11760 | 11190 | 1 | 1 | 0.01% | 0.01% | 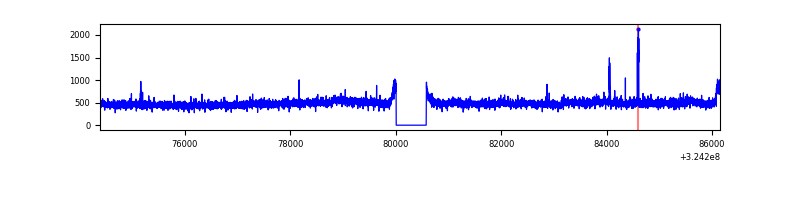 |
| B | 11759 | 11189 | 286 | 286 | 2.43% | 2.56% | 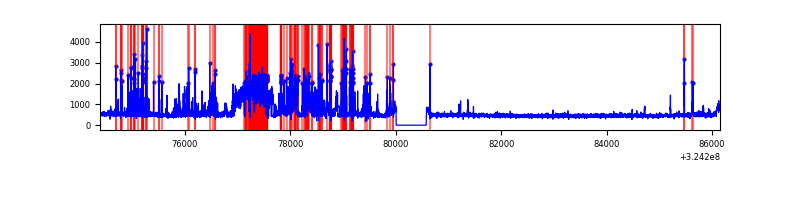 |
| C | 11759 | 11188 | 3 | 3 | 0.03% | 0.03% | 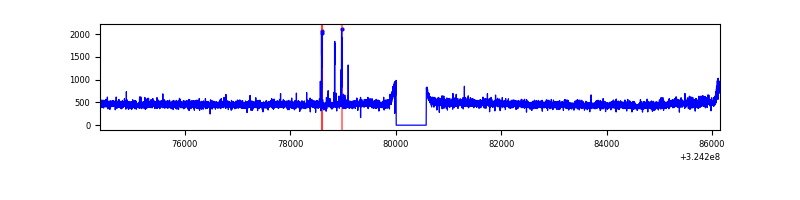 |
| D | 11760 | 11190 | 205 | 205 | 1.74% | 1.83% | 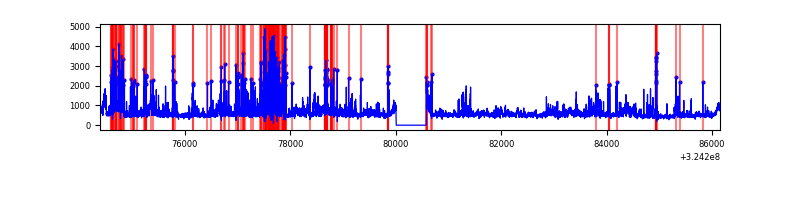 |
Top three noisy pixels from each quadrant. If the there are fewer than three noisy pixels in the level2.evt file, extra rows are filled as -1
| Pixel properties | Quadrant properties | ||||||
|---|---|---|---|---|---|---|---|
| Quadrant | DetID | PixID | Counts | Sigma | Mean | Median | Sigma |
| A | 14 | 111 | 312533 | 1183.25 | 1313 | 1284 | 263.0 |
| A | 6 | 16 | 46160 | 170.6 | 1313 | 1284 | 263.0 |
| A | 13 | 254 | 17905 | 63.19 | 1313 | 1284 | 263.0 |
| B | 4 | 200 | 1268371 | 5140.76 | 1294 | 1259 | 246.5 |
| B | 3 | 64 | 903233 | 3659.37 | 1294 | 1259 | 246.5 |
| B | 12 | 111 | 30501 | 118.64 | 1294 | 1259 | 246.5 |
| C | 14 | 238 | 201724 | 685.88 | 1258 | 1264 | 292.3 |
| C | 2 | 16 | 84572 | 285.04 | 1258 | 1264 | 292.3 |
| C | 13 | 61 | 8794 | 25.76 | 1258 | 1264 | 292.3 |
| D | 1 | 52 | 2411805 | 7922.88 | 1262 | 1222 | 304.3 |
| D | 9 | 1 | 189891 | 620.1 | 1262 | 1222 | 304.3 |
| D | 12 | 218 | 110732 | 359.93 | 1262 | 1222 | 304.3 |
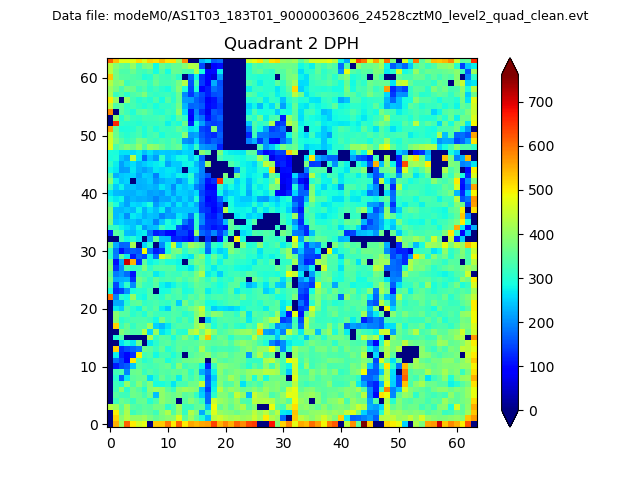
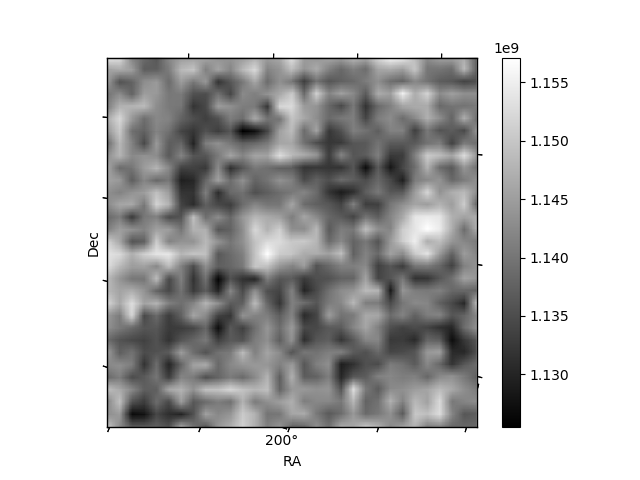
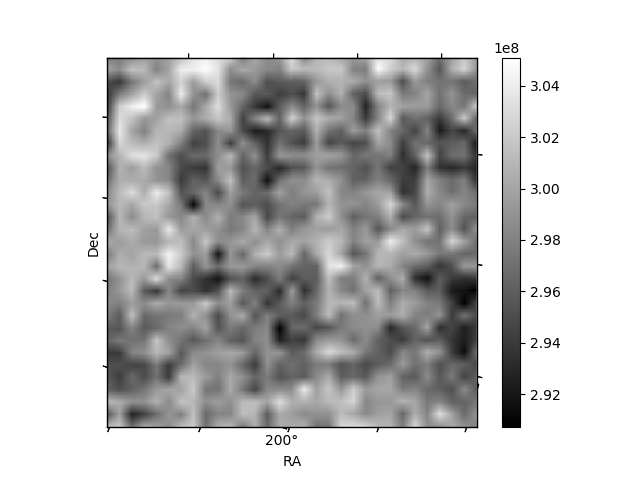
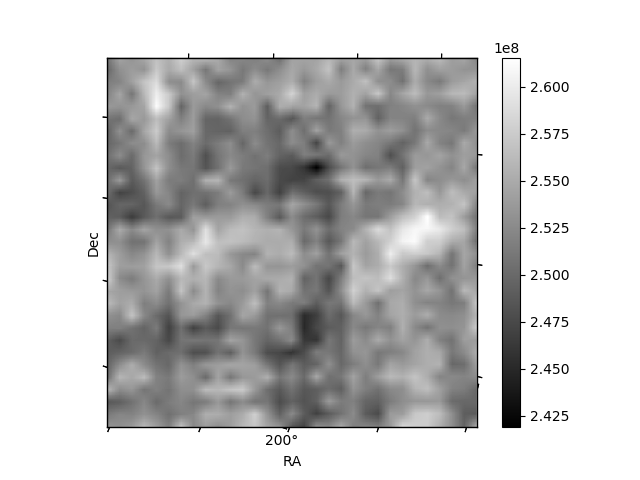
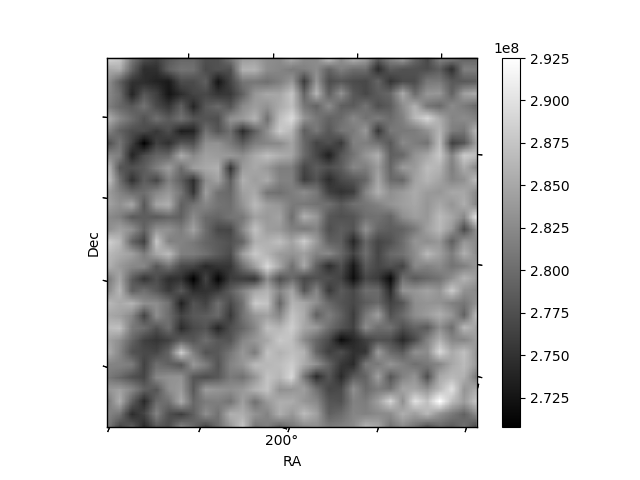
Histogram calculated using DETX and DETY for each event in the final _common_clean file
| Quadrant A | 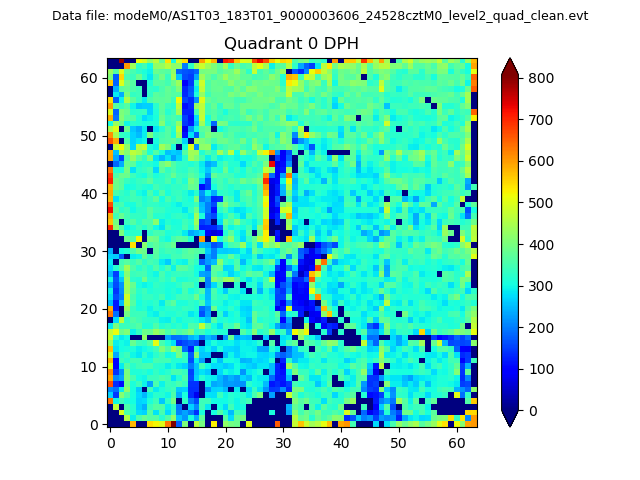 |
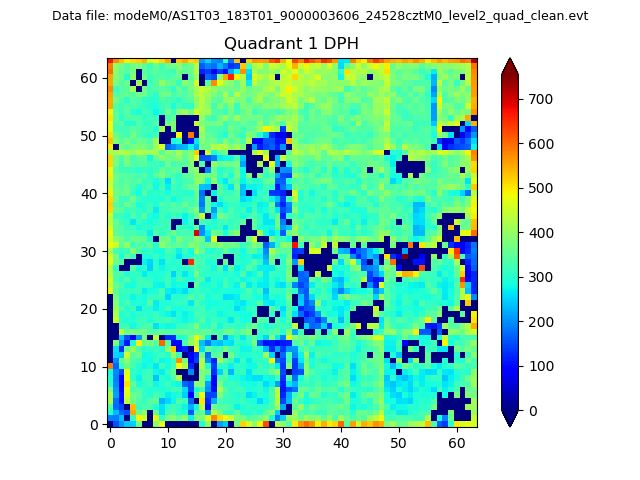 |
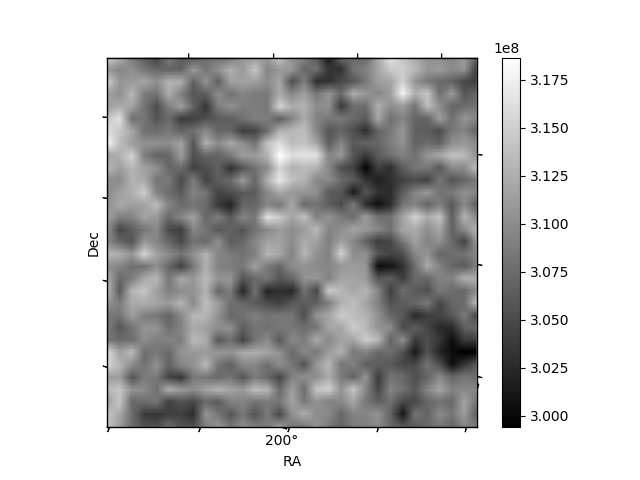
Quadrant B |
|---|---|---|---|
| Quadrant D | 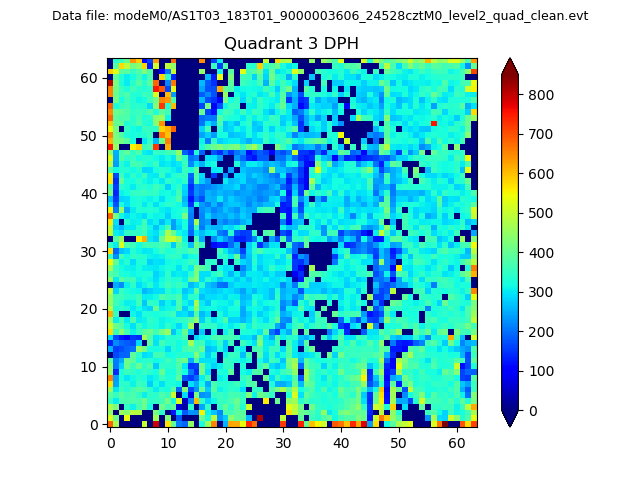 |
 |
Quadrant C |
| Plot type | Count rate plots | Images |
|---|---|---|
| Comparison with Poisson distribution Blue bars denote a histogram of data divided into 1 sec bins. Red curve is a Poisson curve with rate = median count rate of data. |
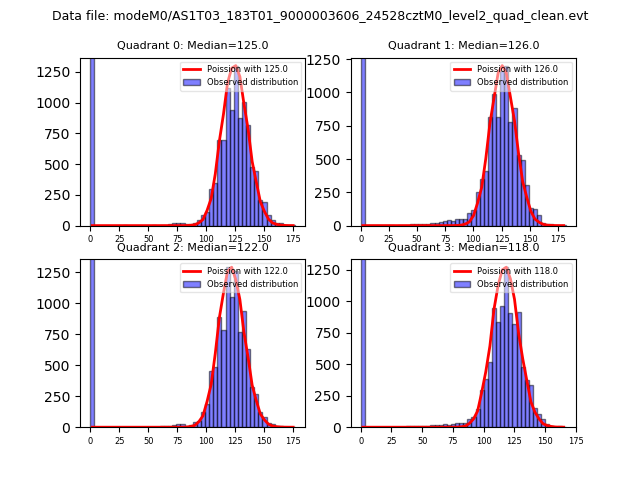 |
 |
| Quadrant-wise count rates Data is divided into 100 sec bins |
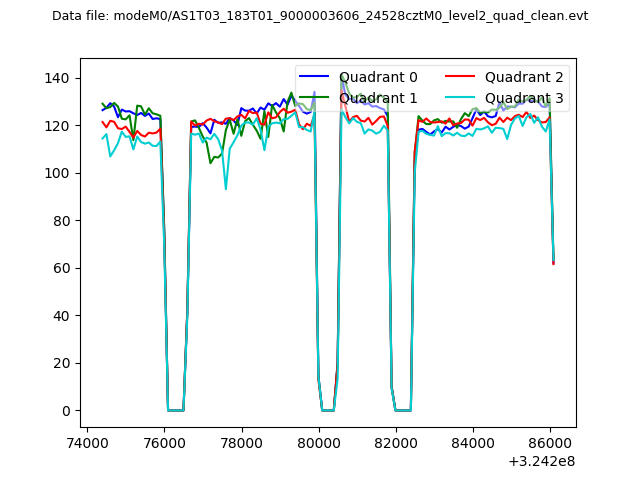 |
|
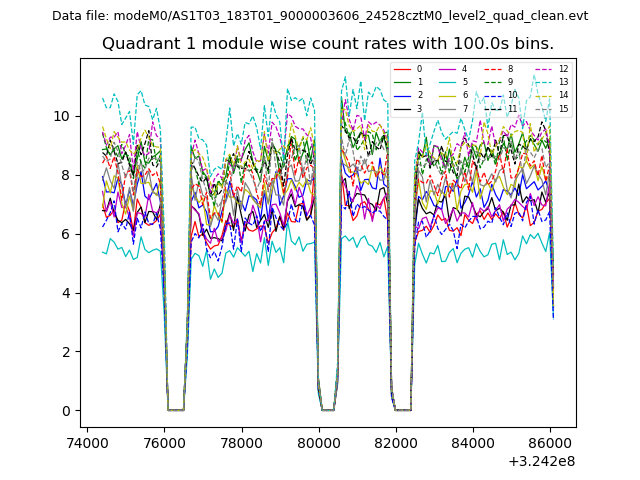
| Module-wise count rates for Quadrant A Data is divided into 100 sec bins |
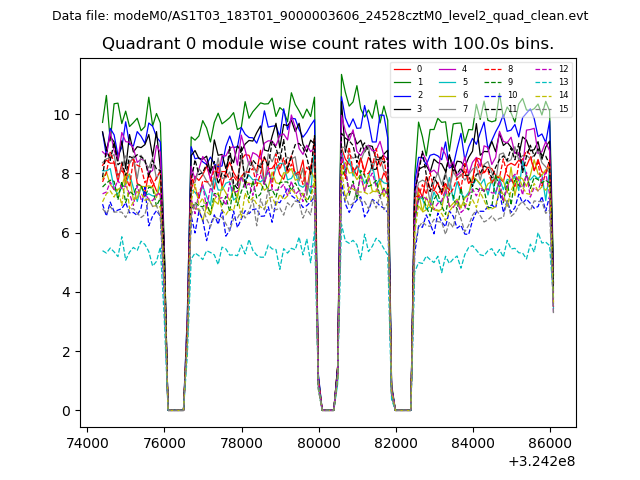 |
 |
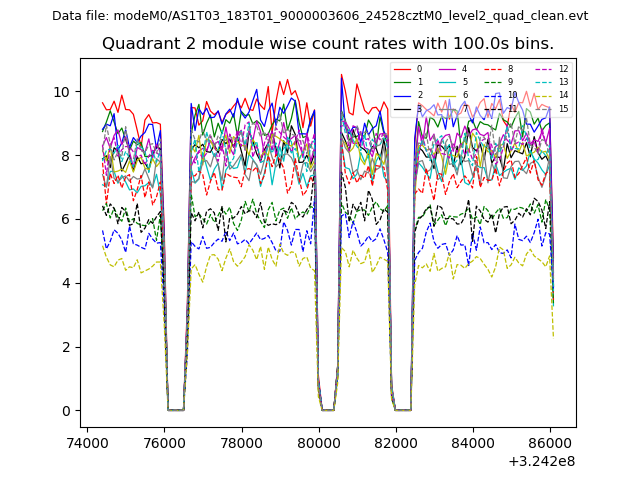
| Module-wise count rates for Quadrant B Data is divided into 100 sec bins |
 |
 |
| Module-wise count rates for Quadrant C Data is divided into 100 sec bins |
 |
 |
| Module-wise count rates for Quadrant D Data is divided into 100 sec bins |
 |
 |
| Parameter | Plot |
|---|---|
| CZT HV Monitor | 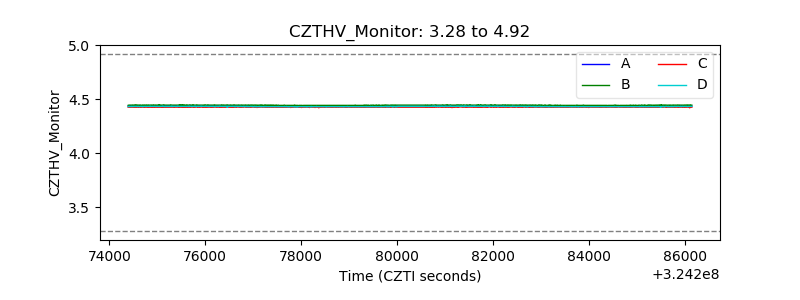 |
| D_VDD | 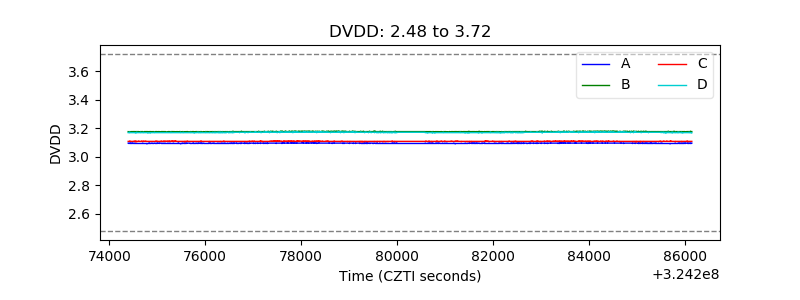 |
| Temperature 1 | 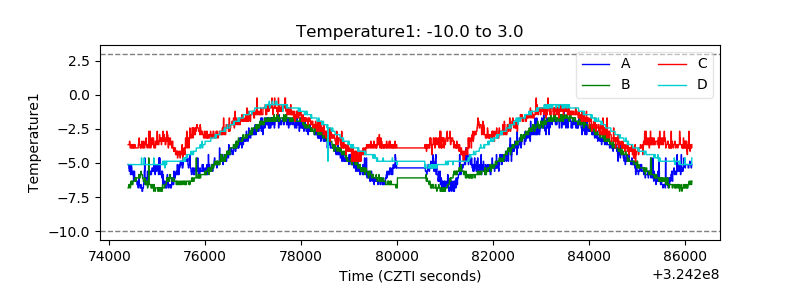 |
| Veto HV Monitor | 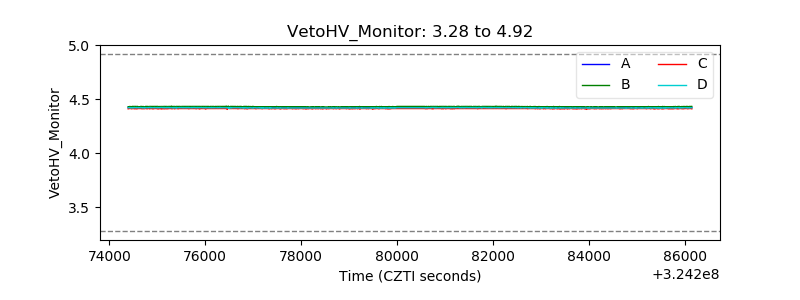 |
| Veto LLD | 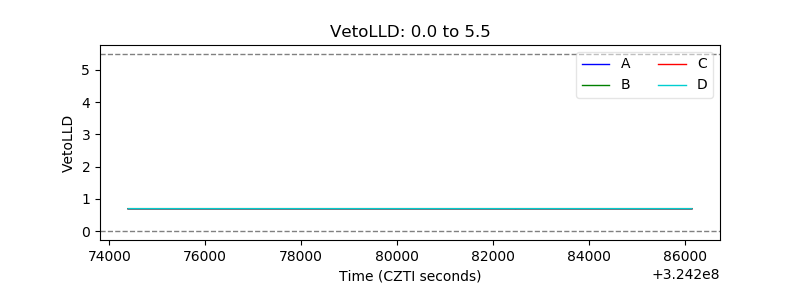 |
| Alpha Counter | 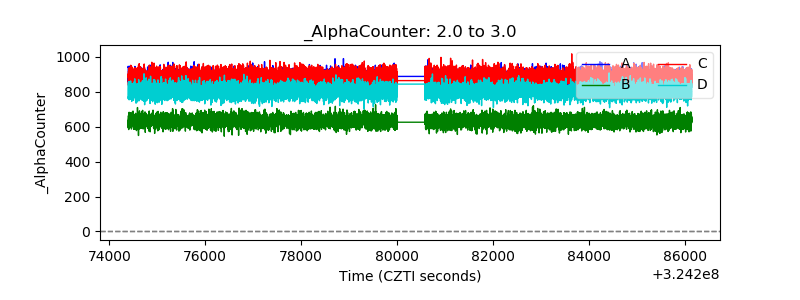 |
| _CPM_Rate | 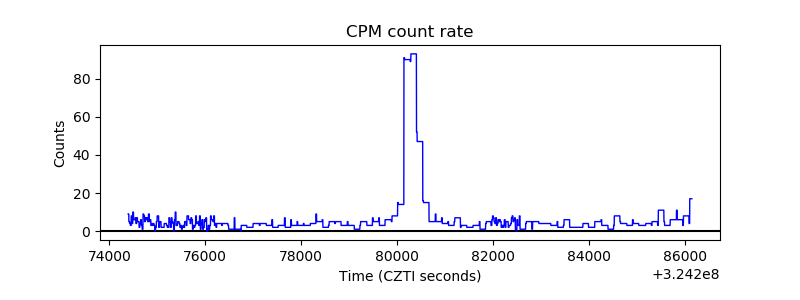 |
| CZT Counter | 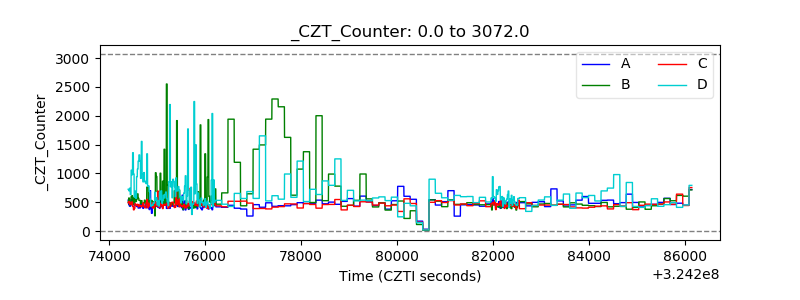 |
| +2.5 Volts monitor |  |
| +5 Volts monitor |  |
| _ROLL_ROT | 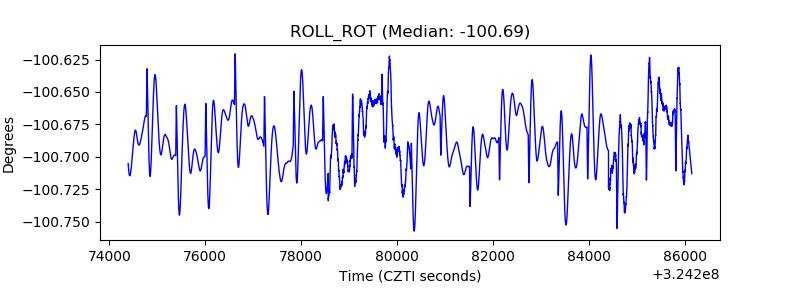 |
| _Roll_DEC | 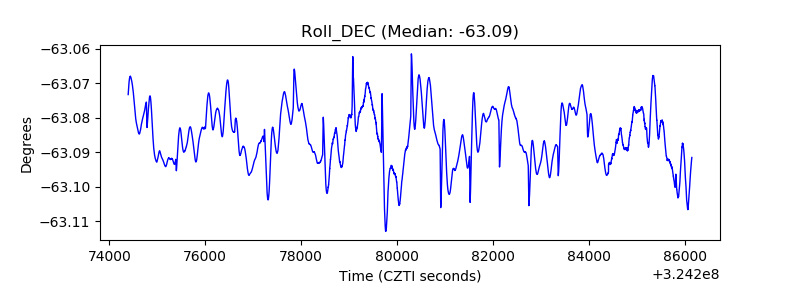 |
| _Roll_RA | 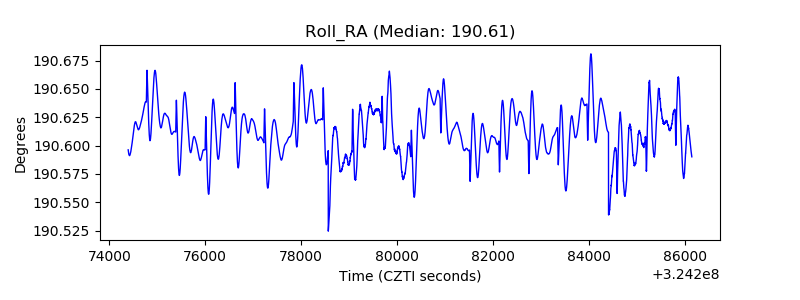 |
| Veto Counter | 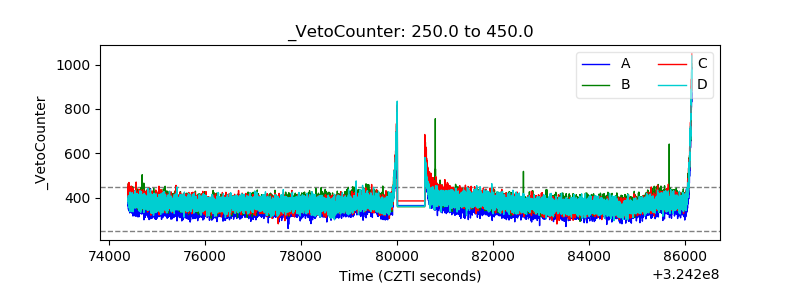 |