| Param | Original file | Final file |
|---|---|---|
| Filename | modeM0/AS1T03_183T01_9000003606_24529cztM0_level2.evt | modeM0/AS1T03_183T01_9000003606_24529cztM0_level2_quad_clean.evt |
| Size (bytes) | 594,305,280 | 116,303,040 |
| Size | 566.8 MB | 110.9 MB |
| Events in quadrant A | 3,753,547 | 775,524 |
| Events in quadrant B | 5,443,234 | 757,508 |
| Events in quadrant C | 3,562,571 | 758,393 |
| Events in quadrant D | 4,751,742 | 730,211 |
| Mode M0 | |||
|---|---|---|---|
| Quadrant | BADHDUFLAG | Total packets | Discarded packets |
| A | 0 | 15809 | 2 |
| B | 0 | 20785 | 2 |
| C | 0 | 15121 | 2 |
| D | 0 | 18798 | 2 |
| Mode SS | |||
|---|---|---|---|
| Quadrant | BADHDUFLAG | Total packets | Discarded packets |
| A | 0 | 146 | 0 |
| B | 0 | 146 | 0 |
| C | 0 | 146 | 0 |
| D | 0 | 146 | 0 |
| Mode M9 | |||
|---|---|---|---|
| Quadrant | BADHDUFLAG | Total packets | Discarded packets |
| A | 0 | 17 | 0 |
| B | 0 | 17 | 0 |
| C | 0 | 17 | 0 |
| D | 0 | 17 | 0 |
| Quadrant | Total seconds | Saturated seconds | Saturation percentage |
|---|---|---|---|
| A | 7192 | 202 | 2.808676% |
| B | 7192 | 905 | 12.583426% |
| C | 7192 | 167 | 2.322024% |
| D | 7192 | 295 | 4.101780% |
Noise dominated data is calculated using 1-second bins in cleaned event files. If a bin has >2000 counts, and if more than 50% of those come from <1% of pixels, then it is considered to be noise-dominated and hence unusable.
| Quadrant | # 1 sec bins | Bins with >0 counts | Bins with >2000 counts | High rate bins dominated by noise | Noise dominated (total time) | Noise dominated (detector-on time) | Marked lightcurve |
|---|---|---|---|---|---|---|---|
| A | 8827 | 7193 | 6 | 6 | 0.07% | 0.08% | 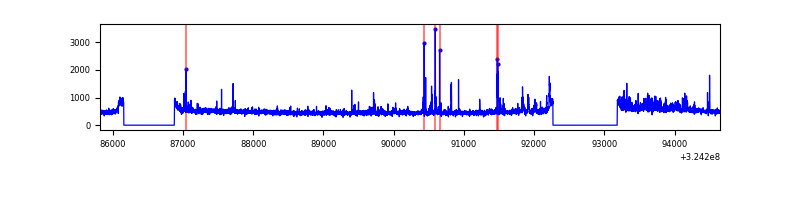 |
| B | 8827 | 7193 | 500 | 500 | 5.66% | 6.95% | 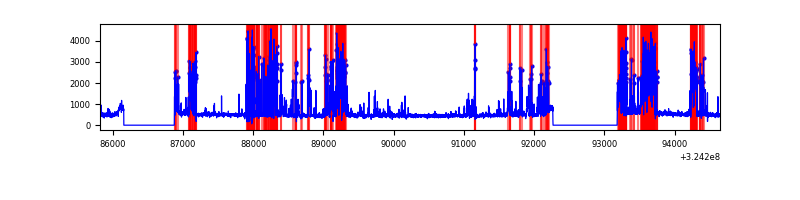 |
| C | 8827 | 7193 | 0 | 0 | 0.00% | 0.00% | 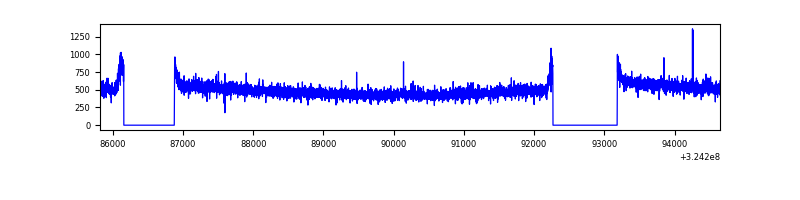 |
| D | 8827 | 7194 | 149 | 149 | 1.69% | 2.07% | 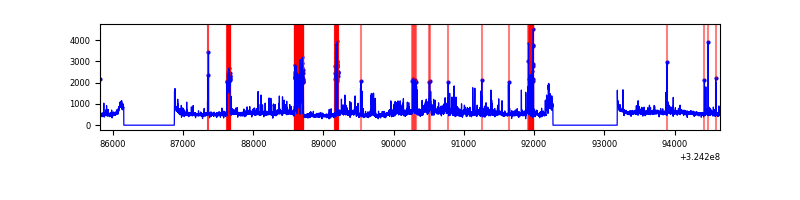 |
Top three noisy pixels from each quadrant. If the there are fewer than three noisy pixels in the level2.evt file, extra rows are filled as -1
| Pixel properties | Quadrant properties | ||||||
|---|---|---|---|---|---|---|---|
| Quadrant | DetID | PixID | Counts | Sigma | Mean | Median | Sigma |
| A | 14 | 111 | 328491 | 1840.45 | 888 | 867 | 178.0 |
| A | 13 | 254 | 11716 | 60.94 | 888 | 867 | 178.0 |
| A | 3 | 137 | 8048 | 40.34 | 888 | 867 | 178.0 |
| B | 3 | 64 | 2110747 | 13201.6 | 840 | 818 | 159.8 |
| B | 15 | 32 | 26270 | 159.25 | 840 | 818 | 159.8 |
| B | 12 | 111 | 19657 | 117.87 | 840 | 818 | 159.8 |
| C | 14 | 238 | 135967 | 675.26 | 857 | 861 | 200.1 |
| C | 2 | 16 | 87256 | 431.8 | 857 | 861 | 200.1 |
| C | 13 | 61 | 5917 | 25.27 | 857 | 861 | 200.1 |
| D | 1 | 52 | 1140841 | 5491.0 | 863 | 837 | 207.6 |
| D | 8 | 195 | 163255 | 782.31 | 863 | 837 | 207.6 |
| D | 5 | 222 | 71425 | 340.0 | 863 | 837 | 207.6 |
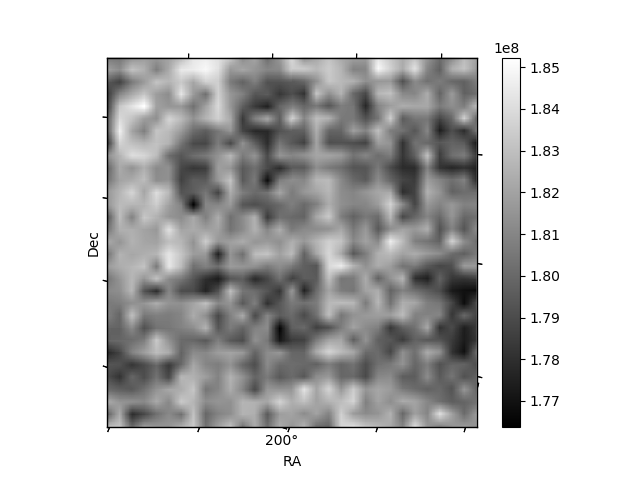
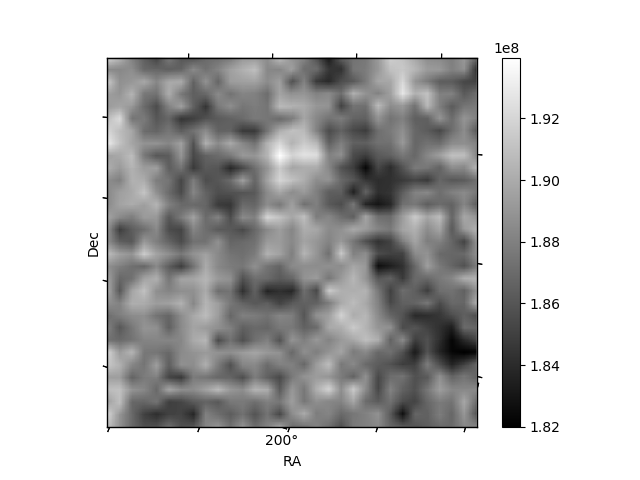
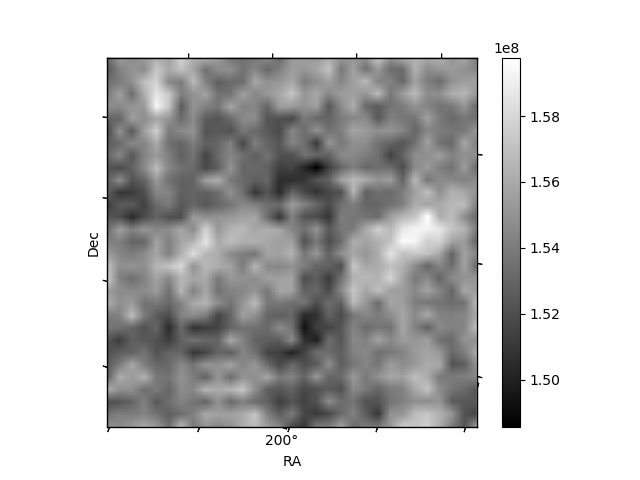
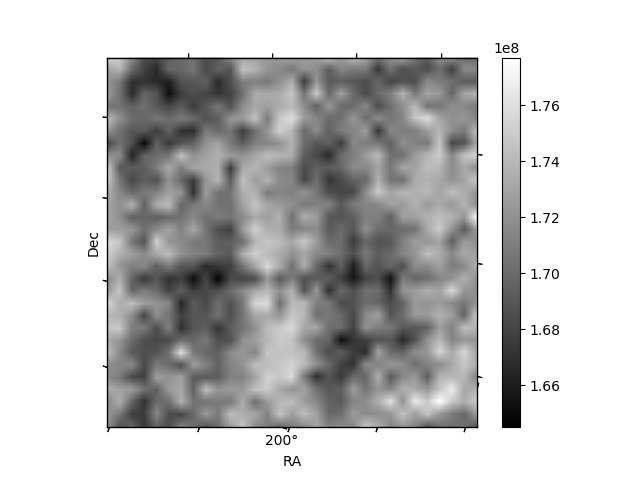
Histogram calculated using DETX and DETY for each event in the final _common_clean file
| Quadrant A | 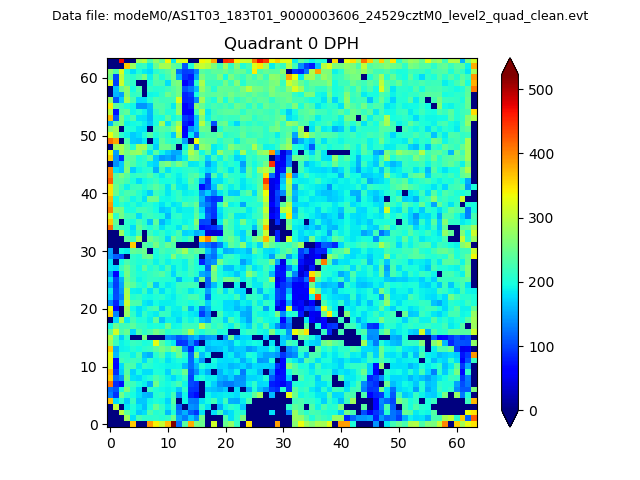 |
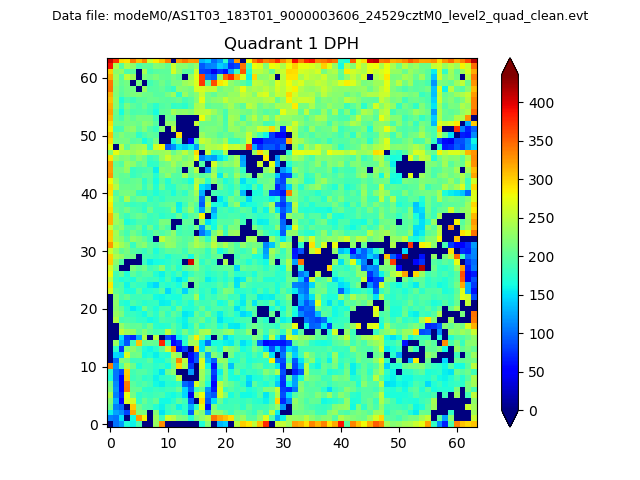 |
Quadrant B |
|---|---|---|---|
| Quadrant D | 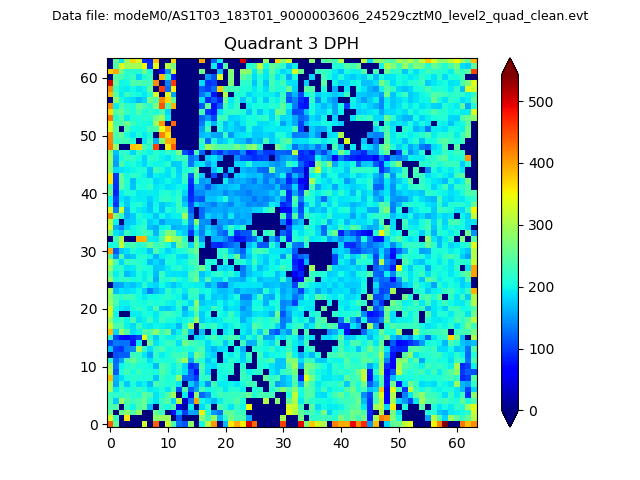 |
 |
Quadrant C |
| Plot type | Count rate plots | Images |
|---|---|---|
| Comparison with Poisson distribution Blue bars denote a histogram of data divided into 1 sec bins. Red curve is a Poisson curve with rate = median count rate of data. |
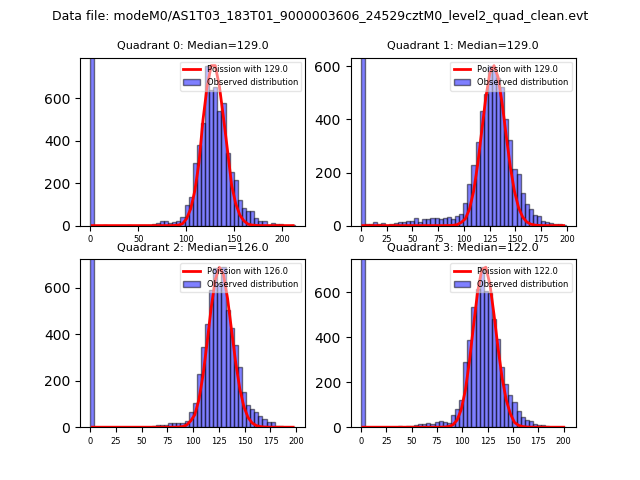 |
 |
| Quadrant-wise count rates Data is divided into 100 sec bins |
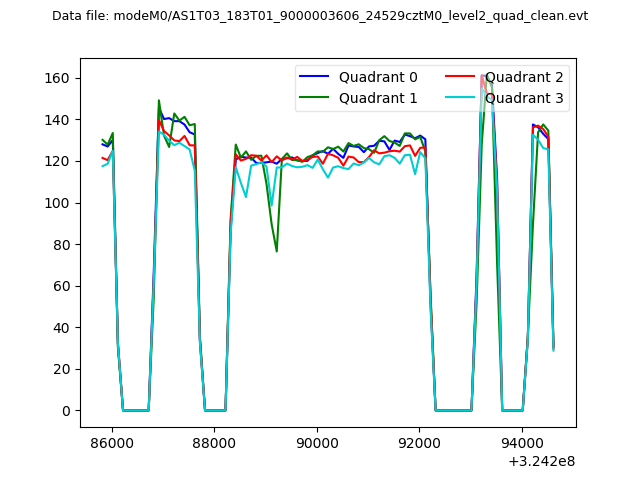 |
|
| Module-wise count rates for Quadrant A Data is divided into 100 sec bins |
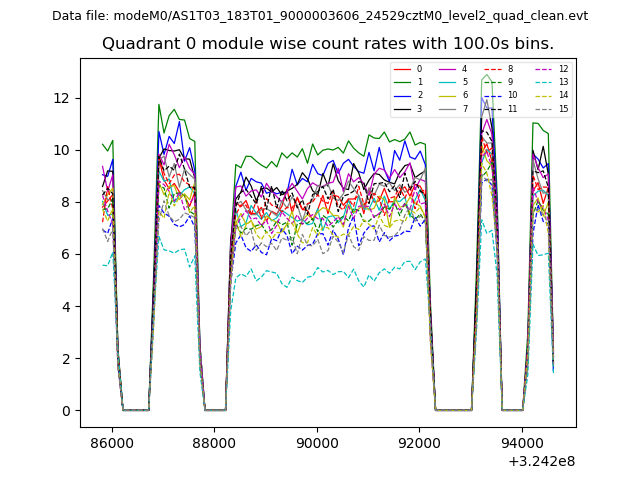 |
 |
| Module-wise count rates for Quadrant B Data is divided into 100 sec bins |
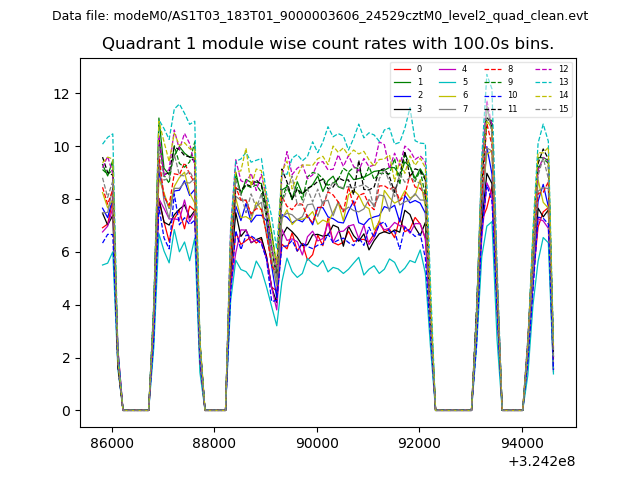 |
 |
| Module-wise count rates for Quadrant C Data is divided into 100 sec bins |
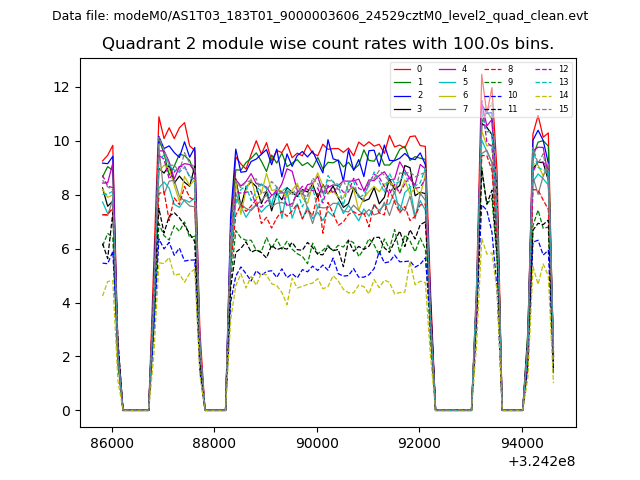 |
 |
| Module-wise count rates for Quadrant D Data is divided into 100 sec bins |
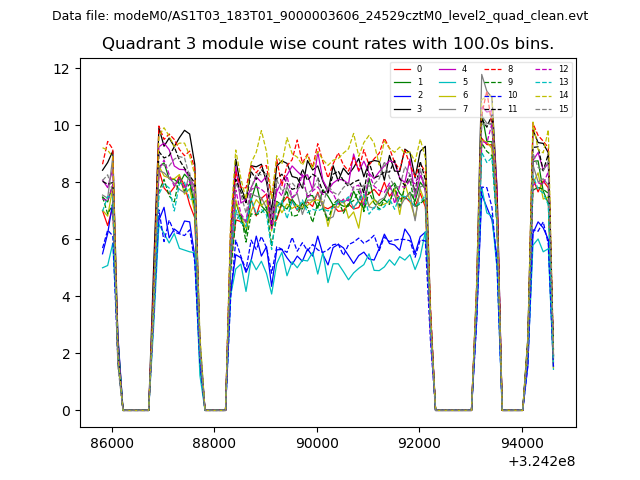 |
 |
| Parameter | Plot |
|---|---|
| CZT HV Monitor | 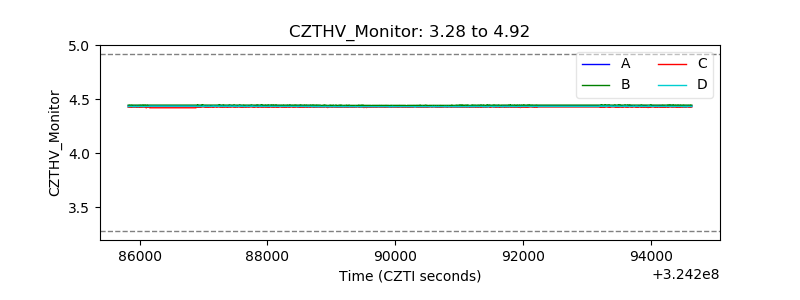 |
| D_VDD | 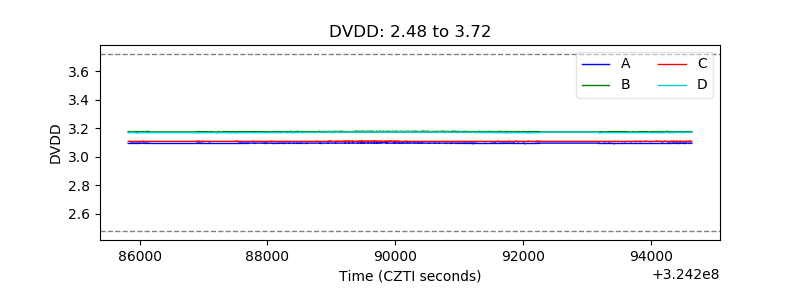 |
| Temperature 1 | 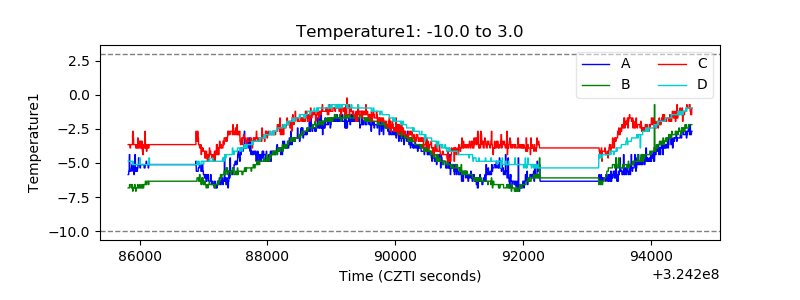 |
| Veto HV Monitor | 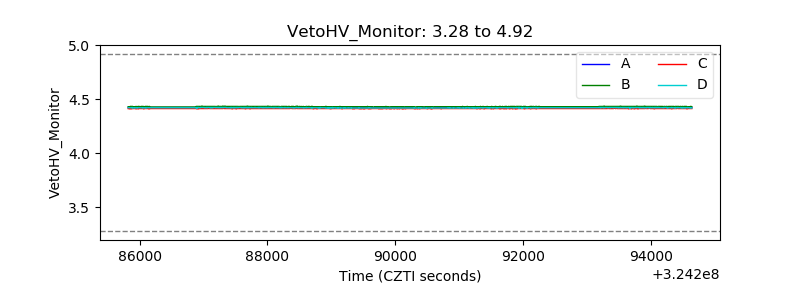 |
| Veto LLD | 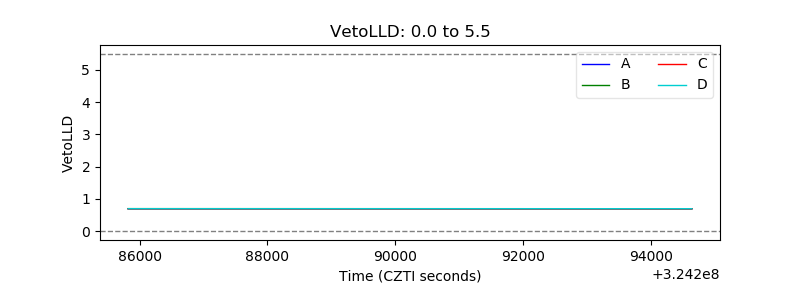 |
| Alpha Counter | 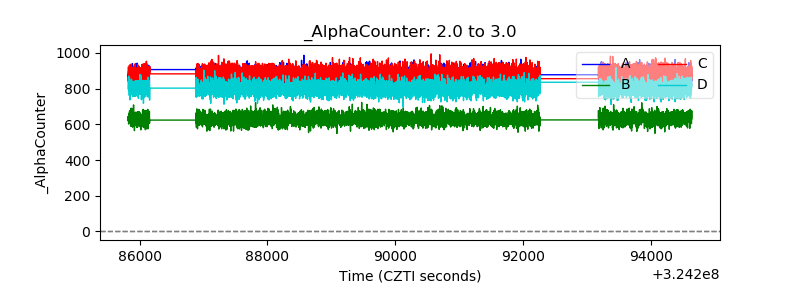 |
| _CPM_Rate | 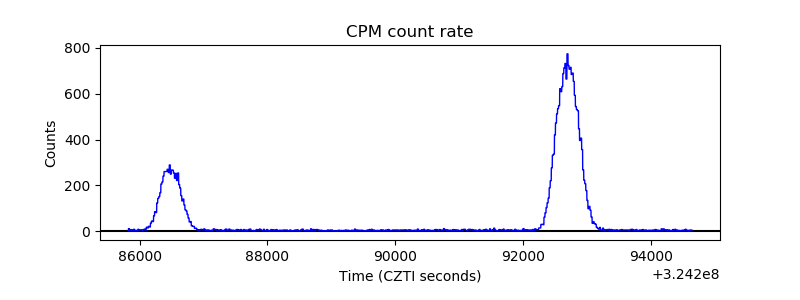 |
| CZT Counter |  |
| +2.5 Volts monitor |  |
| +5 Volts monitor |  |
| _ROLL_ROT | 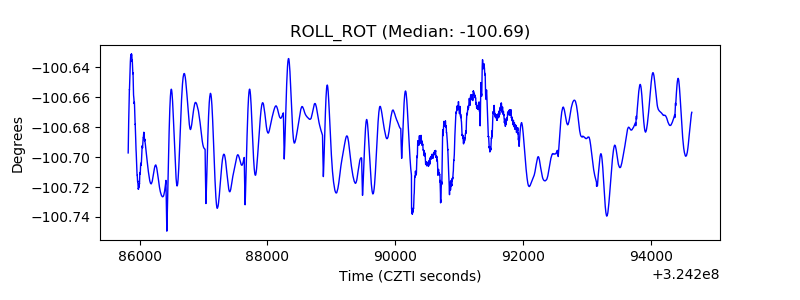 |
| _Roll_DEC | 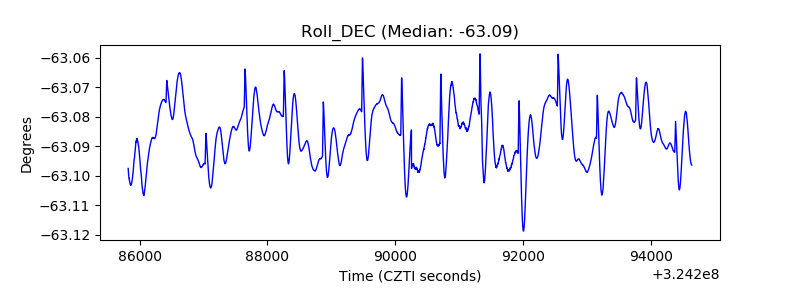 |
| _Roll_RA | 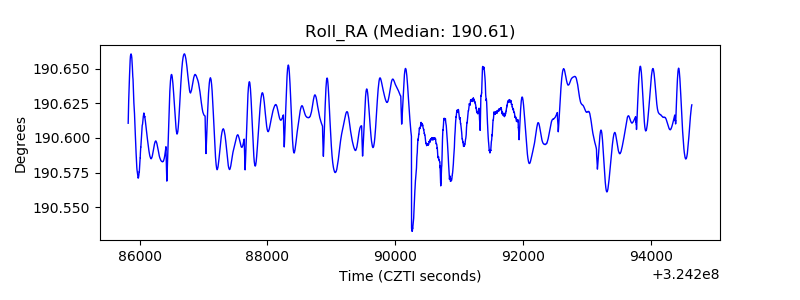 |
| Veto Counter | 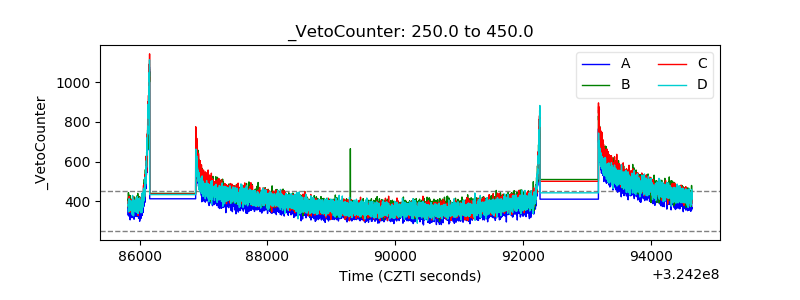 |