| Param | Original file | Final file |
|---|---|---|
| Filename | modeM0/AS1T03_183T01_9000003606_24530cztM0_level2.evt | modeM0/AS1T03_183T01_9000003606_24530cztM0_level2_quad_clean.evt |
| Size (bytes) | 438,963,840 | 99,106,560 |
| Size | 418.6 MB | 94.5 MB |
| Events in quadrant A | 2,975,134 | 663,644 |
| Events in quadrant B | 3,505,908 | 652,826 |
| Events in quadrant C | 3,005,308 | 639,987 |
| Events in quadrant D | 3,404,202 | 630,024 |
| Mode M0 | |||
|---|---|---|---|
| Quadrant | BADHDUFLAG | Total packets | Discarded packets |
| A | 0 | 12844 | 1 |
| B | 0 | 14316 | 1 |
| C | 0 | 12889 | 1 |
| D | 0 | 14212 | 2 |
| Mode SS | |||
|---|---|---|---|
| Quadrant | BADHDUFLAG | Total packets | Discarded packets |
| A | 0 | 120 | 0 |
| B | 0 | 120 | 0 |
| C | 0 | 120 | 0 |
| D | 0 | 120 | 0 |
| Mode M9 | |||
|---|---|---|---|
| Quadrant | BADHDUFLAG | Total packets | Discarded packets |
| A | 0 | 11 | 0 |
| B | 0 | 11 | 0 |
| C | 0 | 11 | 0 |
| D | 0 | 11 | 0 |
| Quadrant | Total seconds | Saturated seconds | Saturation percentage |
|---|---|---|---|
| A | 5940 | 52 | 0.875421% |
| B | 5941 | 252 | 4.241710% |
| C | 5941 | 96 | 1.615890% |
| D | 5940 | 36 | 0.606061% |
Noise dominated data is calculated using 1-second bins in cleaned event files. If a bin has >2000 counts, and if more than 50% of those come from <1% of pixels, then it is considered to be noise-dominated and hence unusable.
| Quadrant | # 1 sec bins | Bins with >0 counts | Bins with >2000 counts | High rate bins dominated by noise | Noise dominated (total time) | Noise dominated (detector-on time) | Marked lightcurve |
|---|---|---|---|---|---|---|---|
| A | 7030 | 5941 | 0 | 0 | 0.00% | 0.00% | 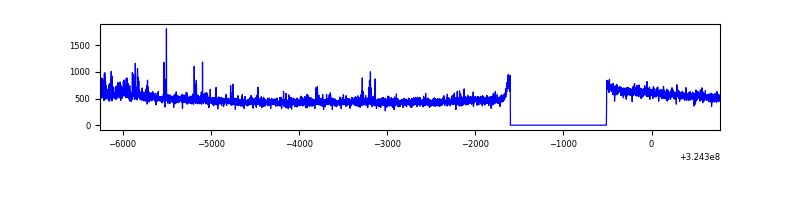 |
| B | 7031 | 5942 | 121 | 121 | 1.72% | 2.04% | 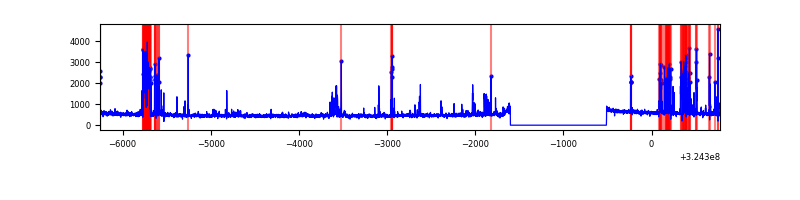 |
| C | 7031 | 5942 | 11 | 11 | 0.16% | 0.19% | 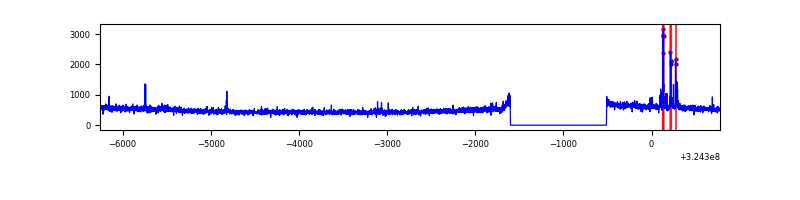 |
| D | 7030 | 5941 | 7 | 7 | 0.10% | 0.12% | 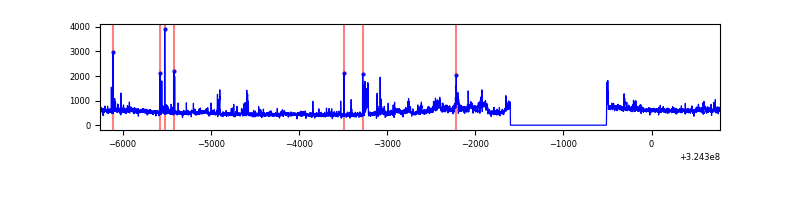 |
Top three noisy pixels from each quadrant. If the there are fewer than three noisy pixels in the level2.evt file, extra rows are filled as -1
| Pixel properties | Quadrant properties | ||||||
|---|---|---|---|---|---|---|---|
| Quadrant | DetID | PixID | Counts | Sigma | Mean | Median | Sigma |
| A | 14 | 111 | 99857 | 665.58 | 746 | 731 | 148.9 |
| A | 13 | 254 | 9265 | 57.3 | 746 | 731 | 148.9 |
| A | 3 | 137 | 6452 | 38.41 | 746 | 731 | 148.9 |
| B | 3 | 64 | 624025 | 4548.59 | 727 | 708 | 137.0 |
| B | 12 | 111 | 16425 | 114.69 | 727 | 708 | 137.0 |
| B | 11 | 111 | 14552 | 101.03 | 727 | 708 | 137.0 |
| C | 14 | 238 | 115480 | 700.84 | 710 | 715 | 163.8 |
| C | 2 | 16 | 104232 | 632.16 | 710 | 715 | 163.8 |
| C | 3 | 233 | 10272 | 58.36 | 710 | 715 | 163.8 |
| D | 1 | 52 | 576815 | 3327.47 | 724 | 703 | 173.1 |
| D | 8 | 195 | 38186 | 216.49 | 724 | 703 | 173.1 |
| D | 12 | 218 | 36254 | 205.33 | 724 | 703 | 173.1 |
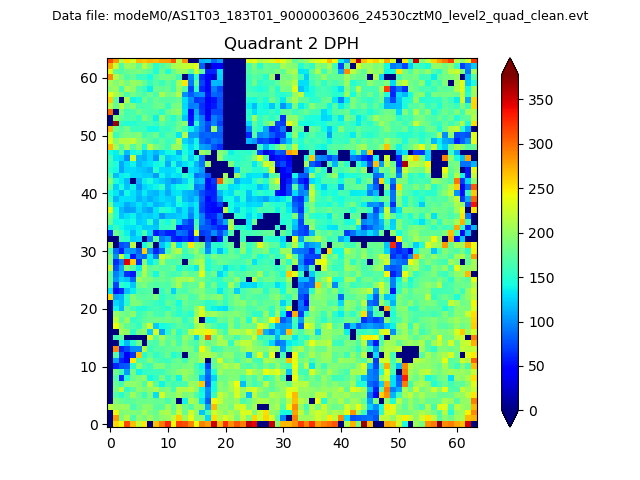
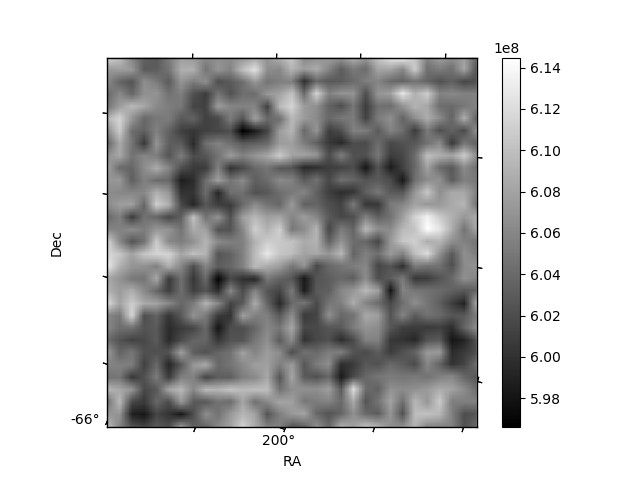
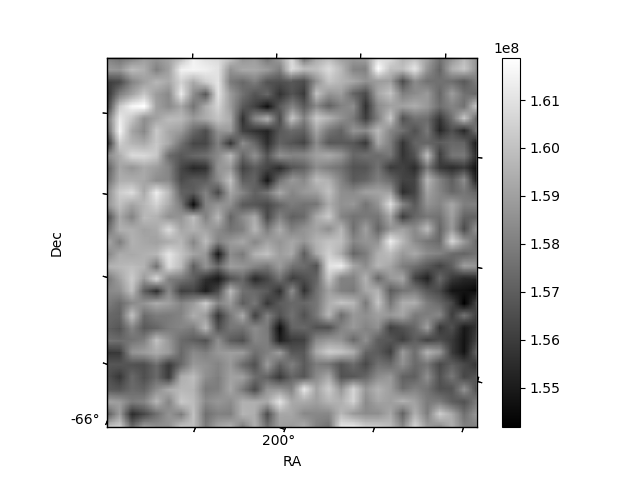
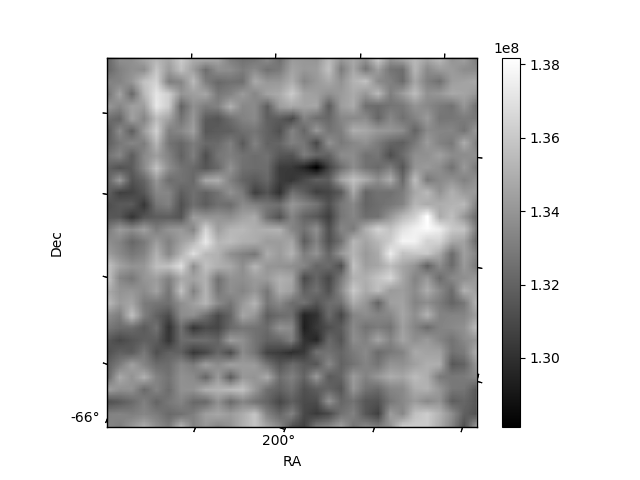
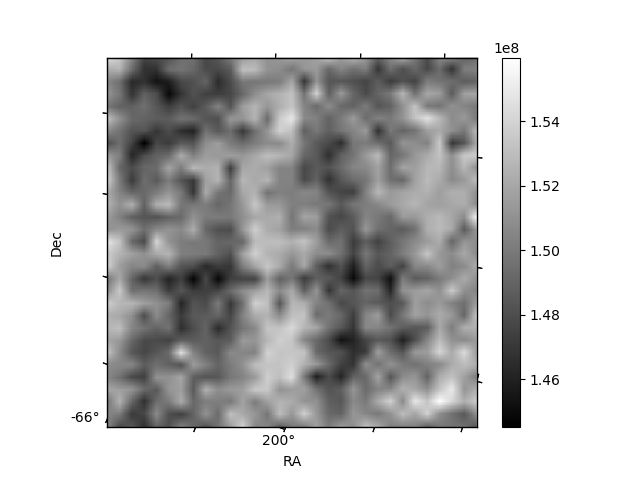
Histogram calculated using DETX and DETY for each event in the final _common_clean file
| Quadrant A | 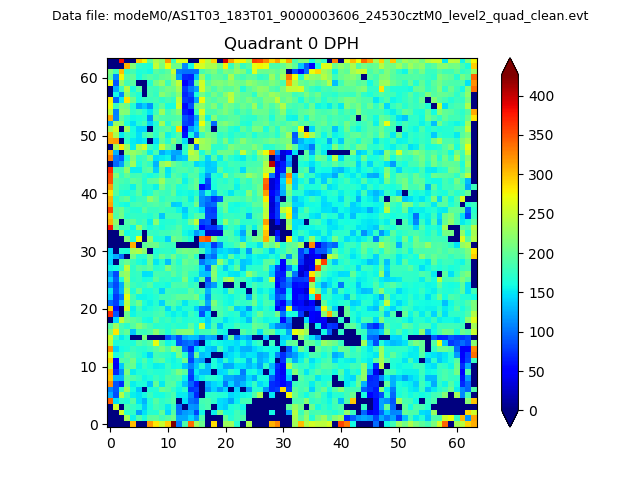 |
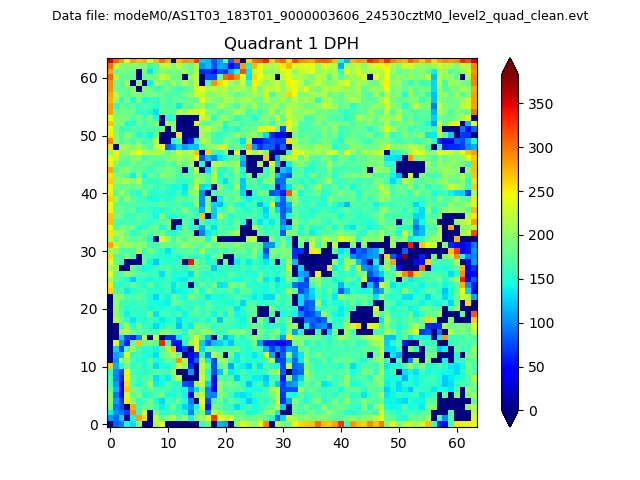 |
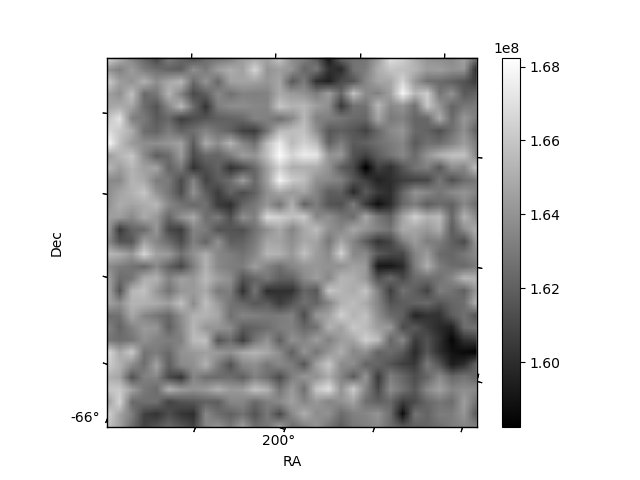
Quadrant B |
|---|---|---|---|
| Quadrant D | 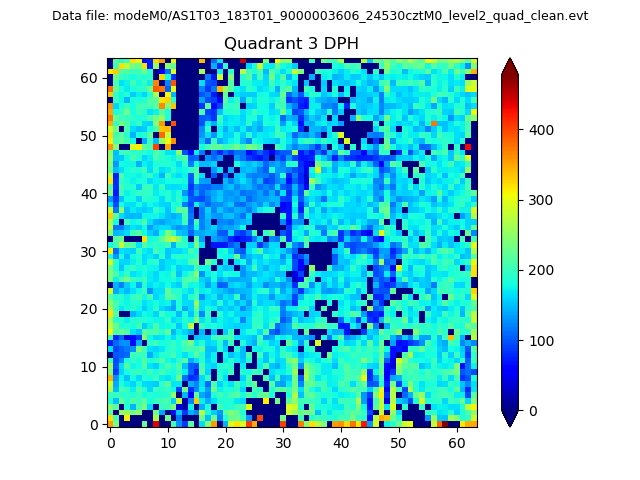 |
 |
Quadrant C |
| Plot type | Count rate plots | Images |
|---|---|---|
| Comparison with Poisson distribution Blue bars denote a histogram of data divided into 1 sec bins. Red curve is a Poisson curve with rate = median count rate of data. |
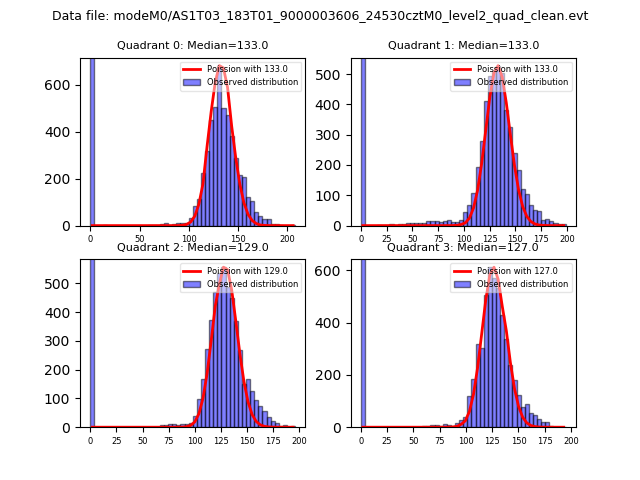 |
 |
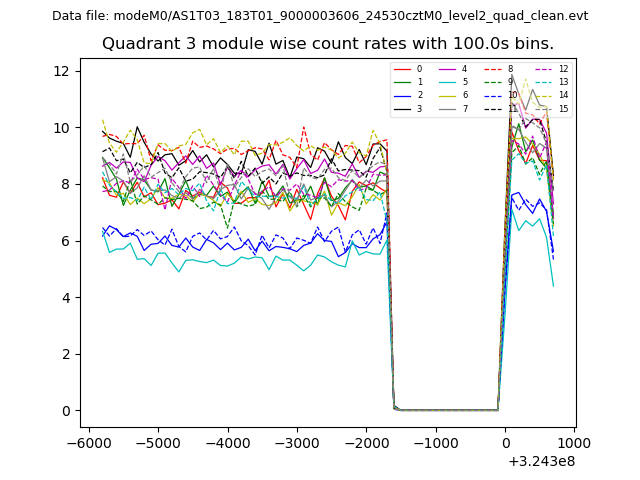
| Quadrant-wise count rates Data is divided into 100 sec bins |
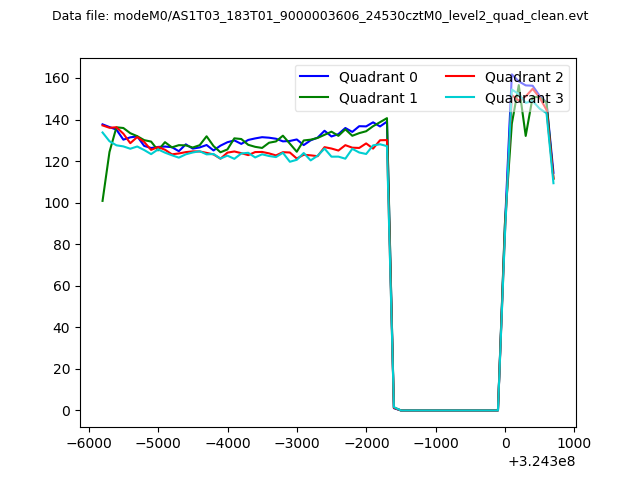 |
|
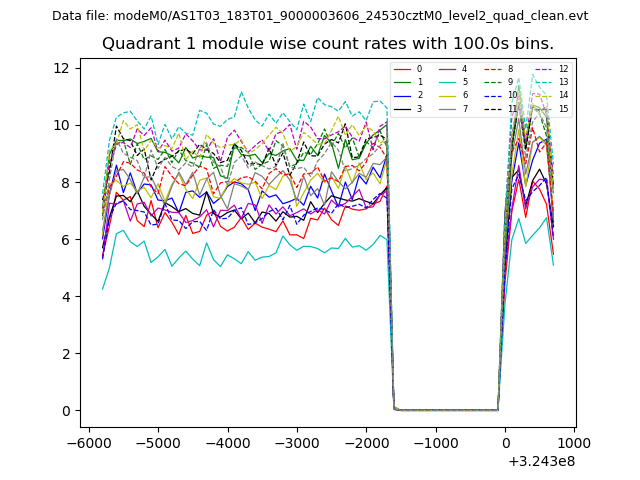
| Module-wise count rates for Quadrant A Data is divided into 100 sec bins |
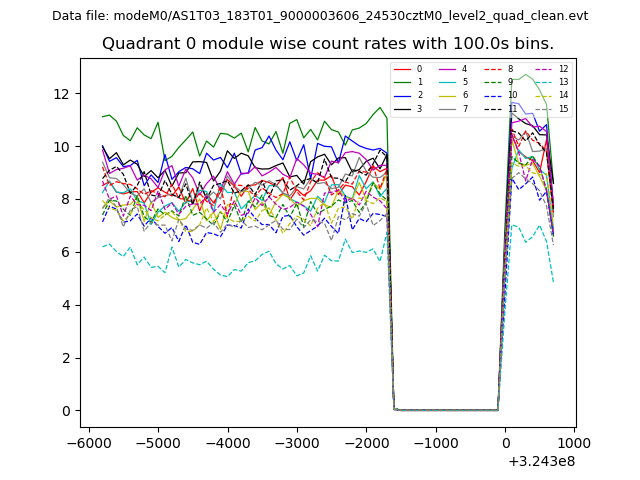 |
 |
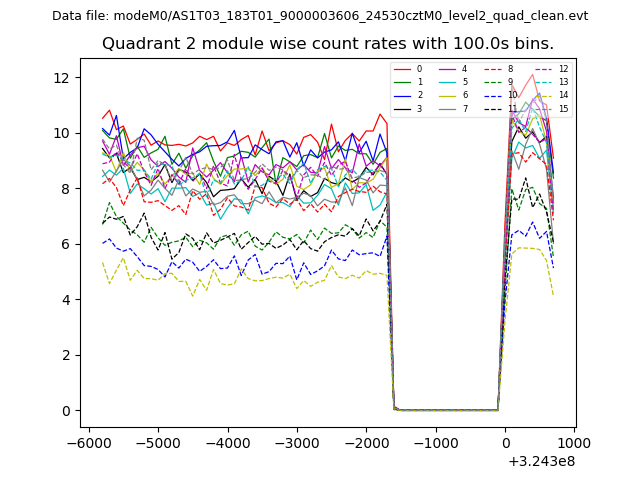
| Module-wise count rates for Quadrant B Data is divided into 100 sec bins |
 |
 |
| Module-wise count rates for Quadrant C Data is divided into 100 sec bins |
 |
 |
| Module-wise count rates for Quadrant D Data is divided into 100 sec bins |
 |
 |
| Parameter | Plot |
|---|---|
| CZT HV Monitor | 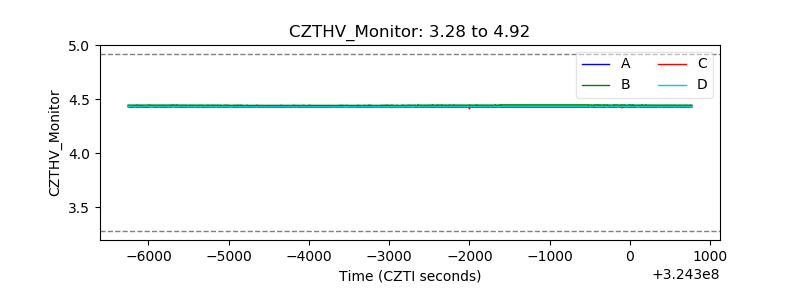 |
| D_VDD | 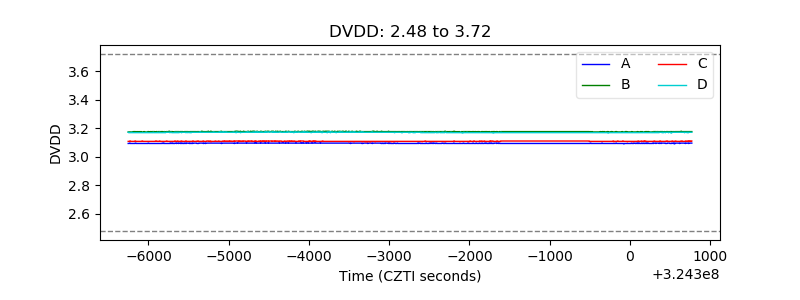 |
| Temperature 1 | 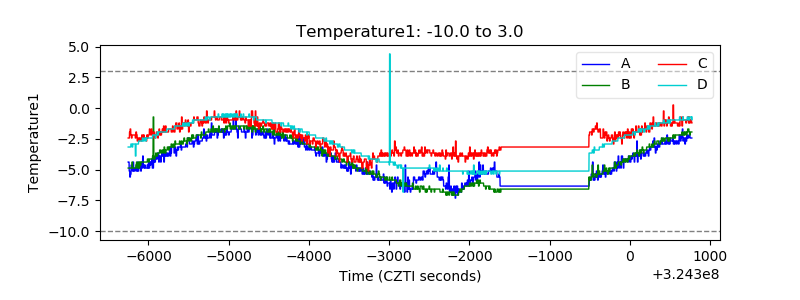 |
| Veto HV Monitor | 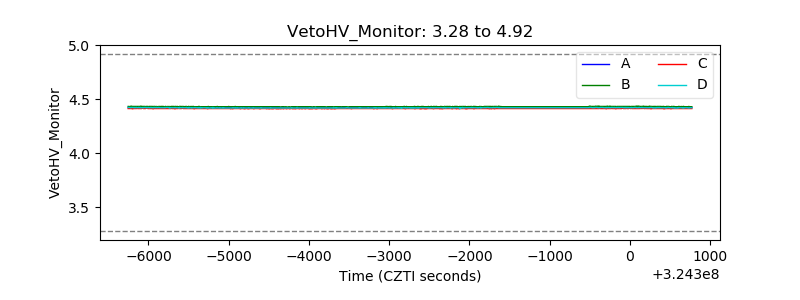 |
| Veto LLD | 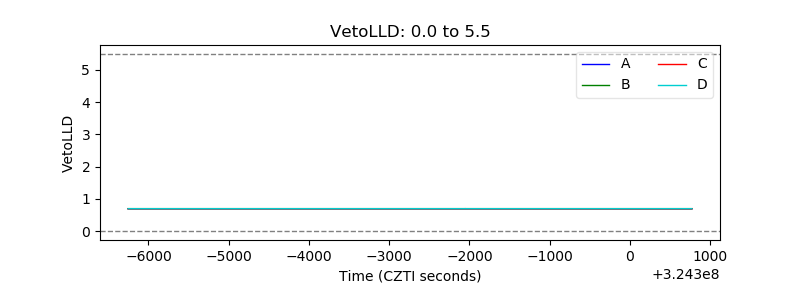 |
| Alpha Counter | 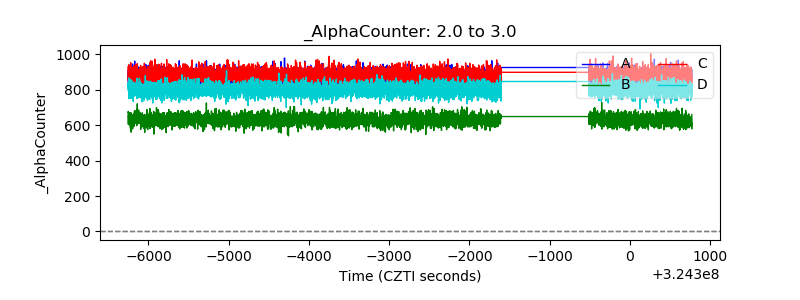 |
| _CPM_Rate | 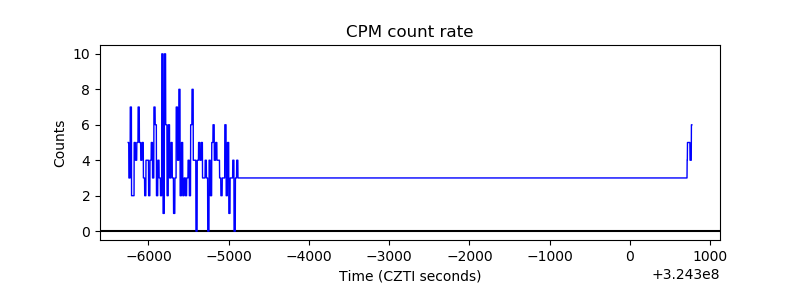 |
| CZT Counter | 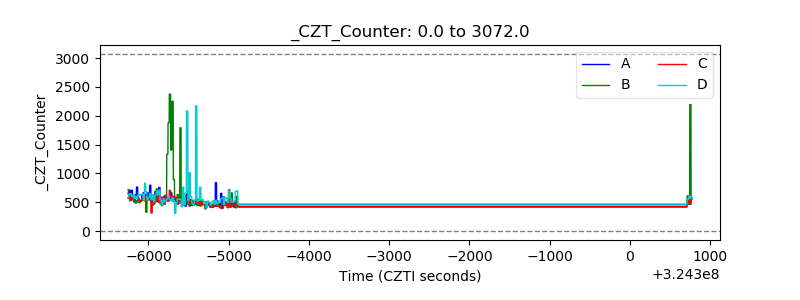 |
| +2.5 Volts monitor |  |
| +5 Volts monitor |  |
| _ROLL_ROT | 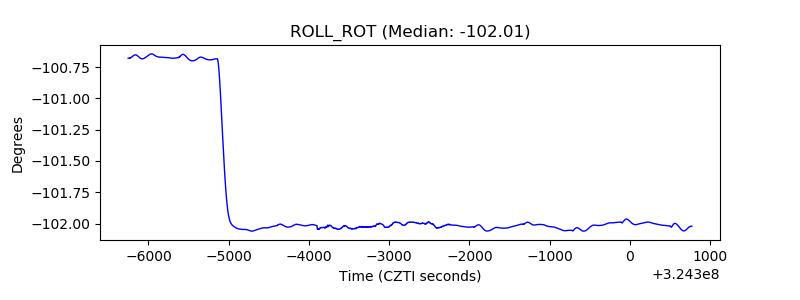 |
| _Roll_DEC | 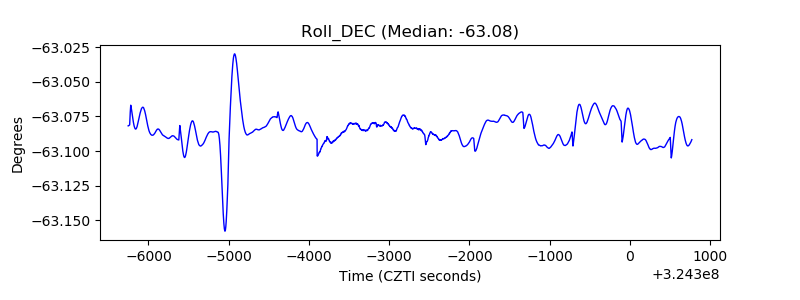 |
| _Roll_RA | 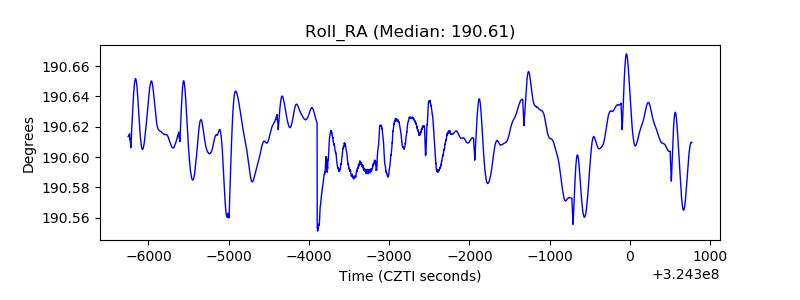 |
| Veto Counter | 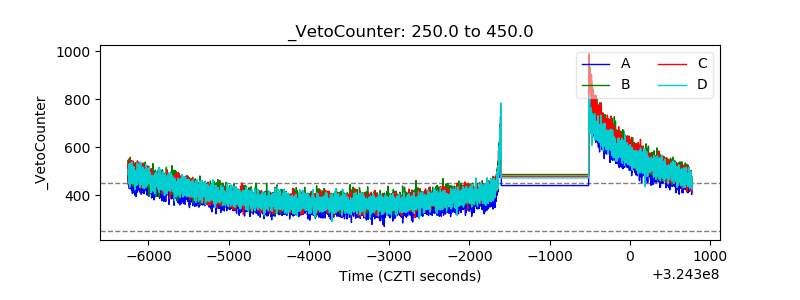 |