| Param | Original file | Final file |
|---|---|---|
| Filename | modeM0/AS1T03_183T01_9000003606_24532cztM0_level2.evt | modeM0/AS1T03_183T01_9000003606_24532cztM0_level2_quad_clean.evt |
| Size (bytes) | 596,609,280 | 126,480,960 |
| Size | 569.0 MB | 120.6 MB |
| Events in quadrant A | 4,414,575 | 876,037 |
| Events in quadrant B | 5,490,429 | 842,515 |
| Events in quadrant C | 3,391,494 | 848,077 |
| Events in quadrant D | 4,345,626 | 824,535 |
| Mode M0 | |||
|---|---|---|---|
| Quadrant | BADHDUFLAG | Total packets | Discarded packets |
| A | 0 | 17529 | 1 |
| B | 0 | 20489 | 1 |
| C | 0 | 14207 | 1 |
| D | 0 | 17265 | 1 |
| Mode SS | |||
|---|---|---|---|
| Quadrant | BADHDUFLAG | Total packets | Discarded packets |
| A | 0 | 128 | 0 |
| B | 0 | 128 | 0 |
| C | 0 | 128 | 0 |
| D | 0 | 128 | 0 |
| Mode M9 | |||
|---|---|---|---|
| Quadrant | BADHDUFLAG | Total packets | Discarded packets |
| A | 0 | 12 | 0 |
| B | 0 | 12 | 0 |
| C | 0 | 12 | 0 |
| D | 0 | 12 | 0 |
| Quadrant | Total seconds | Saturated seconds | Saturation percentage |
|---|---|---|---|
| A | 6295 | 267 | 4.241461% |
| B | 6296 | 858 | 13.627700% |
| C | 6296 | 111 | 1.763024% |
| D | 6296 | 288 | 4.574333% |
Noise dominated data is calculated using 1-second bins in cleaned event files. If a bin has >2000 counts, and if more than 50% of those come from <1% of pixels, then it is considered to be noise-dominated and hence unusable.
| Quadrant | # 1 sec bins | Bins with >0 counts | Bins with >2000 counts | High rate bins dominated by noise | Noise dominated (total time) | Noise dominated (detector-on time) | Marked lightcurve |
|---|---|---|---|---|---|---|---|
| A | 7490 | 6296 | 67 | 67 | 0.89% | 1.06% | 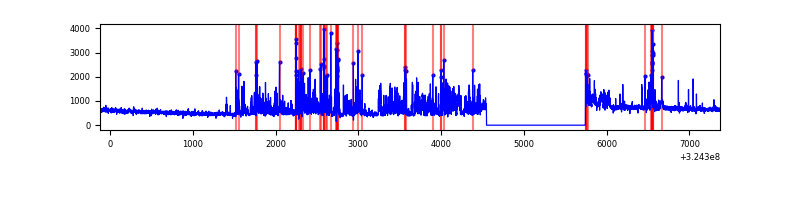 |
| B | 7491 | 6297 | 537 | 537 | 7.17% | 8.53% | 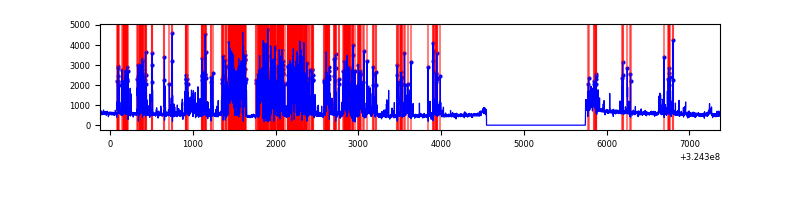 |
| C | 7491 | 6297 | 22 | 22 | 0.29% | 0.35% | 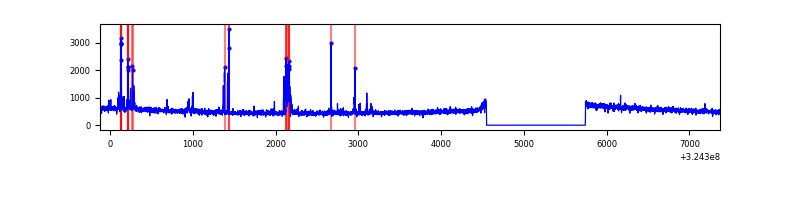 |
| D | 7491 | 6297 | 234 | 234 | 3.12% | 3.72% | 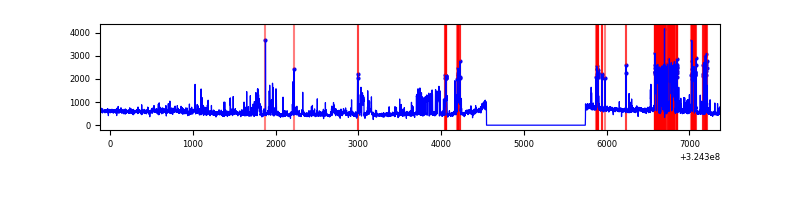 |
Top three noisy pixels from each quadrant. If the there are fewer than three noisy pixels in the level2.evt file, extra rows are filled as -1
| Pixel properties | Quadrant properties | ||||||
|---|---|---|---|---|---|---|---|
| Quadrant | DetID | PixID | Counts | Sigma | Mean | Median | Sigma |
| A | 14 | 111 | 1180966 | 7245.43 | 821 | 807 | 162.9 |
| A | 4 | 2 | 70866 | 430.12 | 821 | 807 | 162.9 |
| A | 13 | 254 | 10100 | 57.05 | 821 | 807 | 162.9 |
| B | 3 | 64 | 2411594 | 17036.5 | 777 | 761 | 141.5 |
| B | 0 | 190 | 27604 | 189.69 | 777 | 761 | 141.5 |
| B | 12 | 111 | 16648 | 112.27 | 777 | 761 | 141.5 |
| C | 2 | 16 | 202188 | 1137.86 | 779 | 785 | 177.0 |
| C | 14 | 238 | 127901 | 718.16 | 779 | 785 | 177.0 |
| C | 3 | 233 | 16024 | 86.1 | 779 | 785 | 177.0 |
| D | 1 | 52 | 1139535 | 5959.23 | 792 | 768 | 191.1 |
| D | 12 | 218 | 126496 | 657.94 | 792 | 768 | 191.1 |
| D | 8 | 195 | 72412 | 374.92 | 792 | 768 | 191.1 |
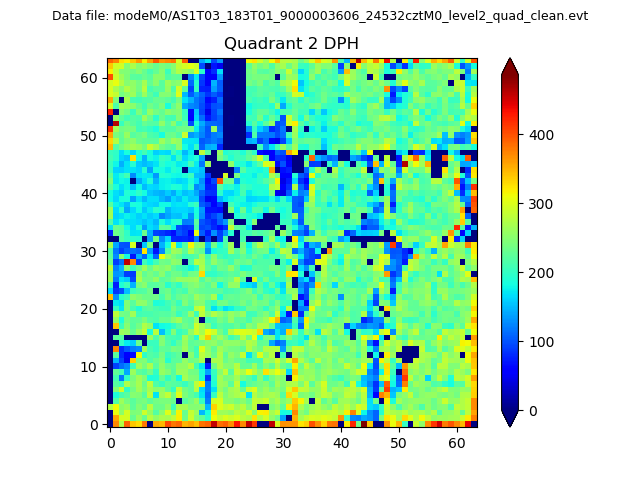
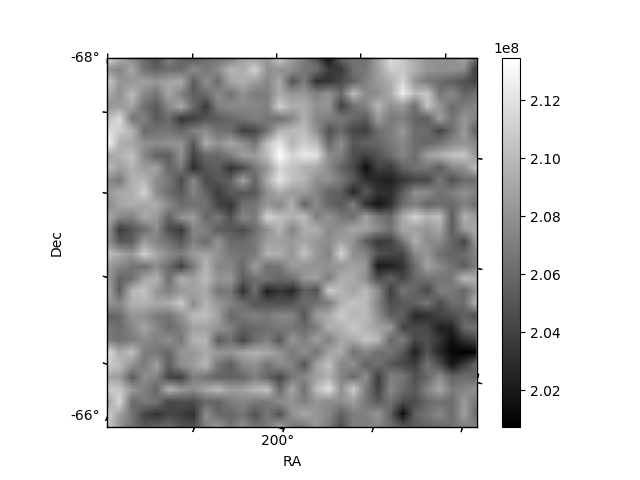
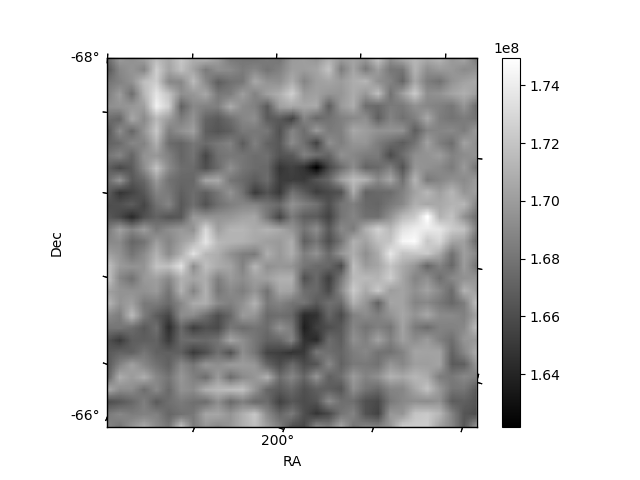
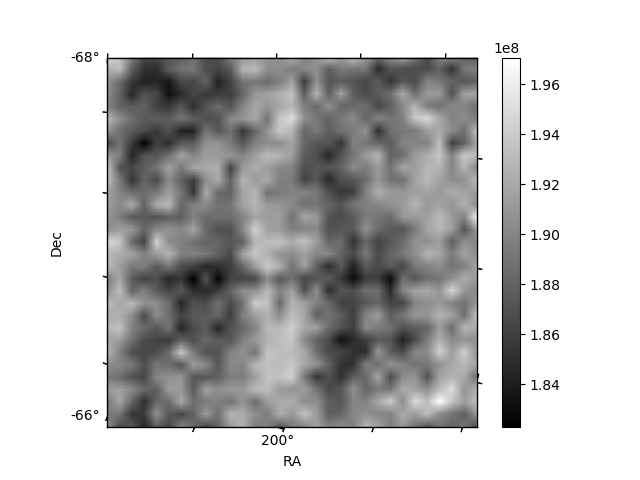
Histogram calculated using DETX and DETY for each event in the final _common_clean file
| Quadrant A | 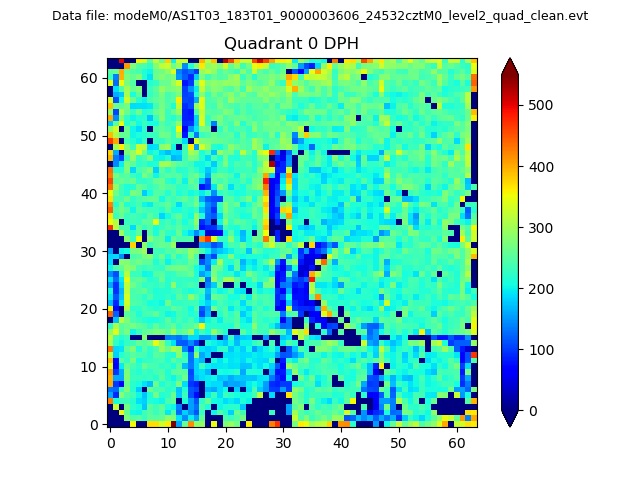 |
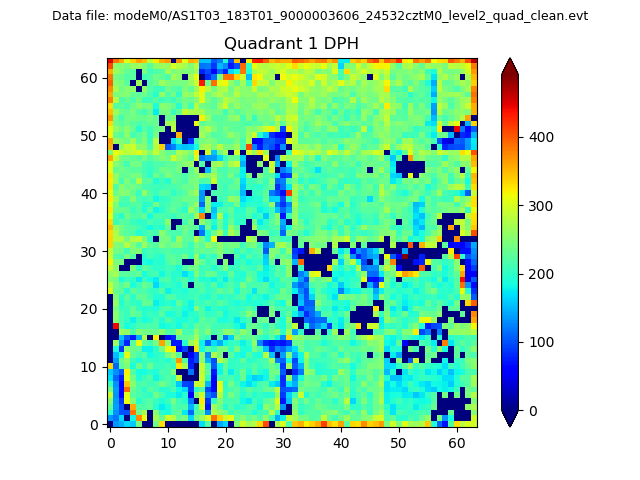 |
Quadrant B |
|---|---|---|---|
| Quadrant D | 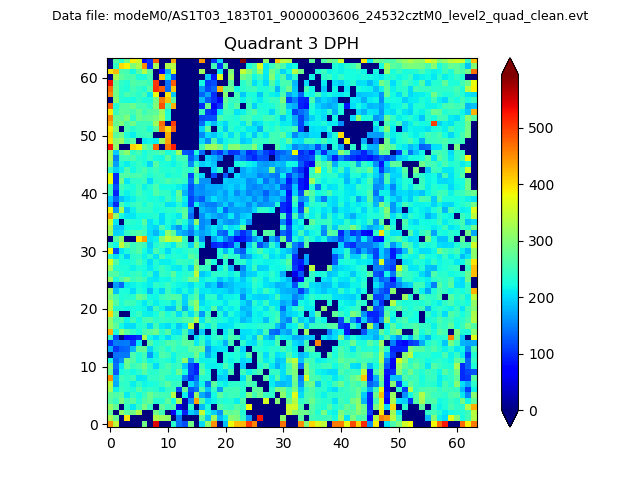 |
 |
Quadrant C |
| Plot type | Count rate plots | Images |
|---|---|---|
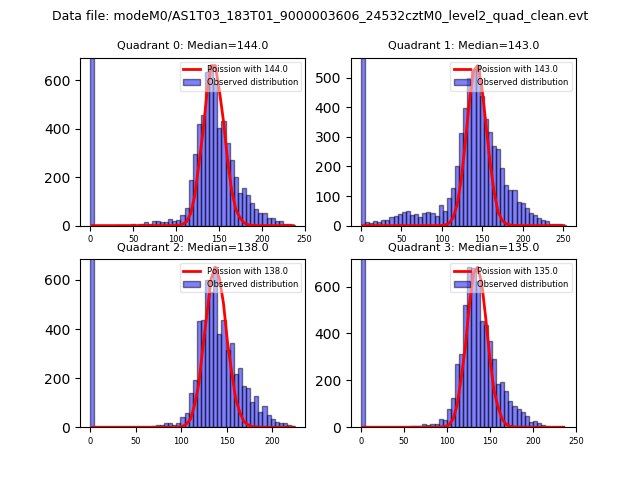
| Comparison with Poisson distribution Blue bars denote a histogram of data divided into 1 sec bins. Red curve is a Poisson curve with rate = median count rate of data. |
 |
 |
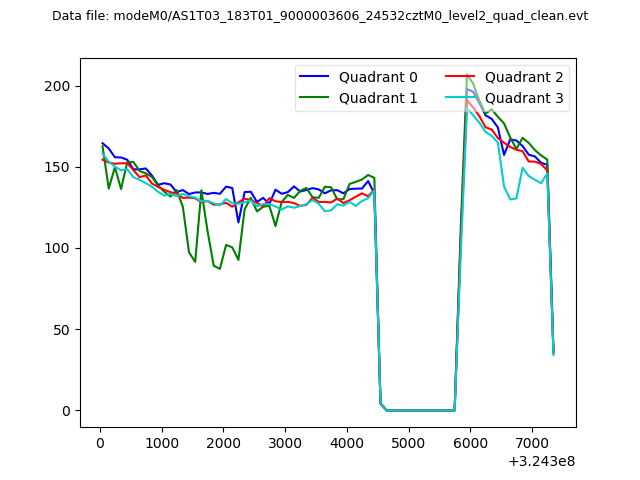
| Quadrant-wise count rates Data is divided into 100 sec bins |
 |
|
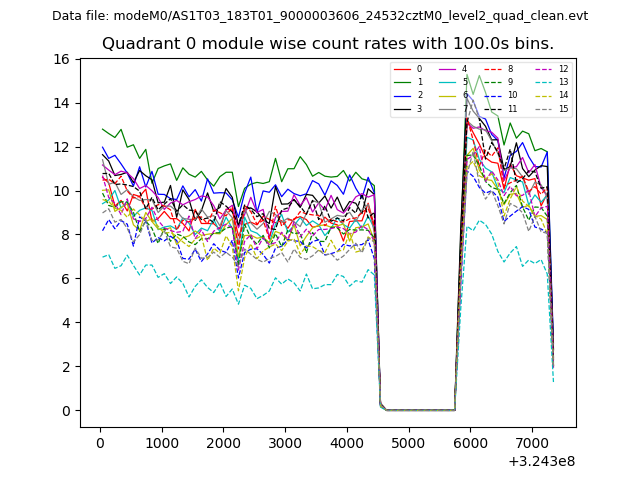
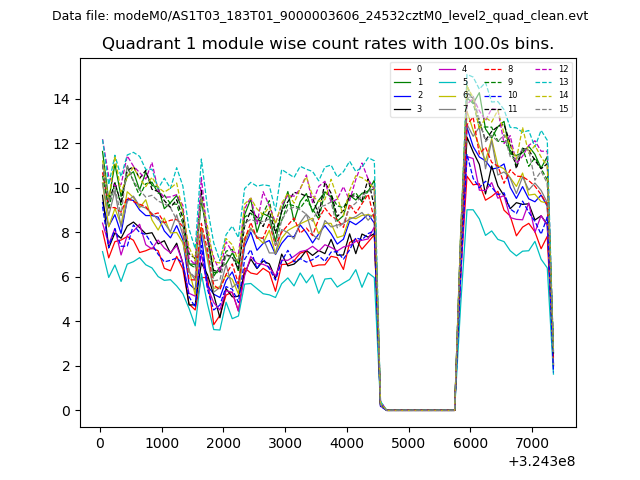
| Module-wise count rates for Quadrant A Data is divided into 100 sec bins |
 |
 |
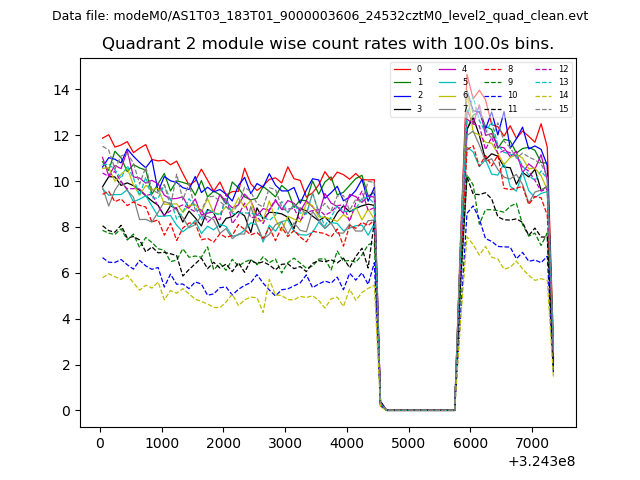
| Module-wise count rates for Quadrant B Data is divided into 100 sec bins |
 |
 |
| Module-wise count rates for Quadrant C Data is divided into 100 sec bins |
 |
 |
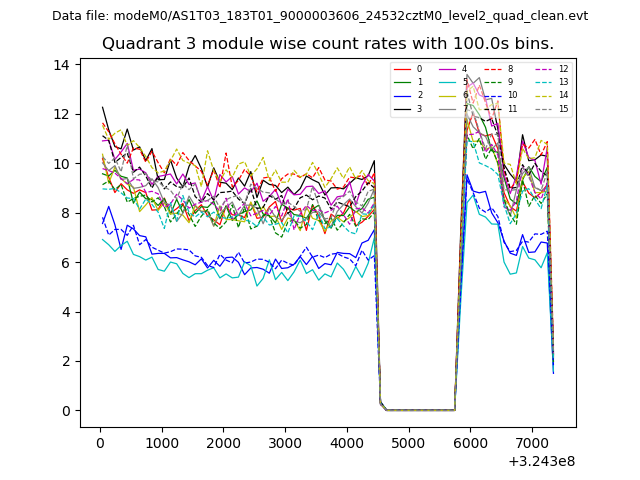
| Module-wise count rates for Quadrant D Data is divided into 100 sec bins |
 |
 |
| Parameter | Plot |
|---|---|
| CZT HV Monitor | 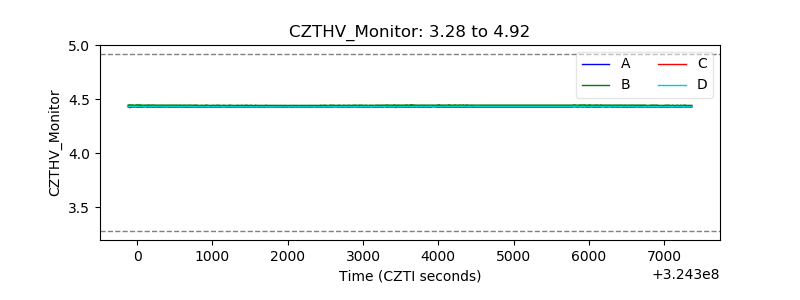 |
| D_VDD | 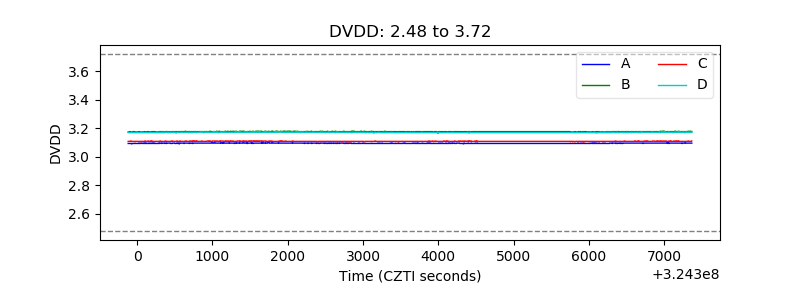 |
| Temperature 1 |  |
| Veto HV Monitor | 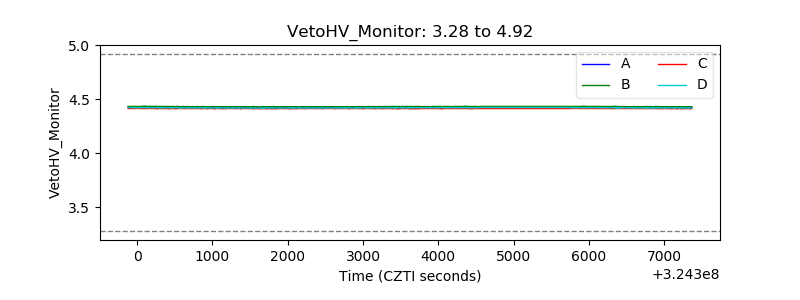 |
| Veto LLD | 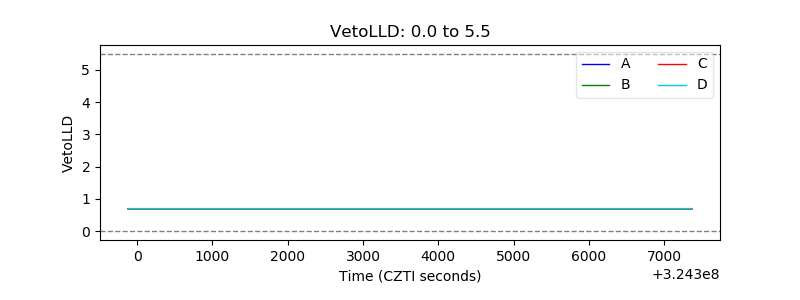 |
| Alpha Counter | 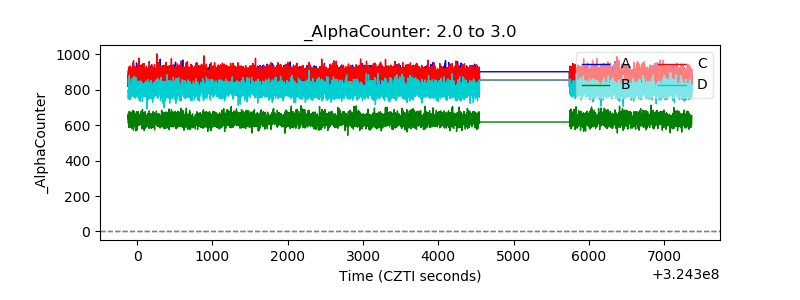 |
| _CPM_Rate | 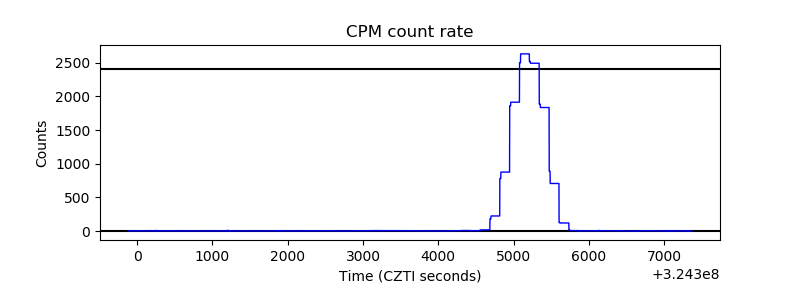 |
| CZT Counter |  |
| +2.5 Volts monitor |  |
| +5 Volts monitor |  |
| _ROLL_ROT | 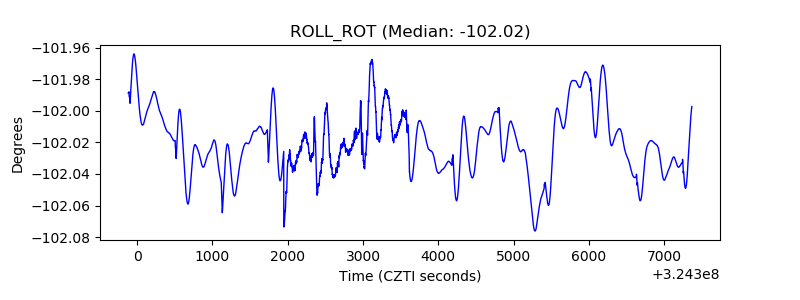 |
| _Roll_DEC | 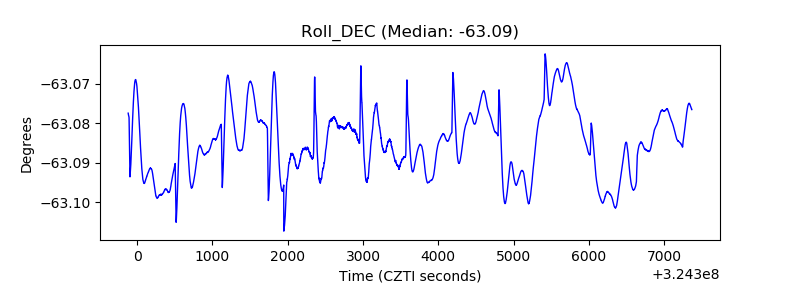 |
| _Roll_RA | 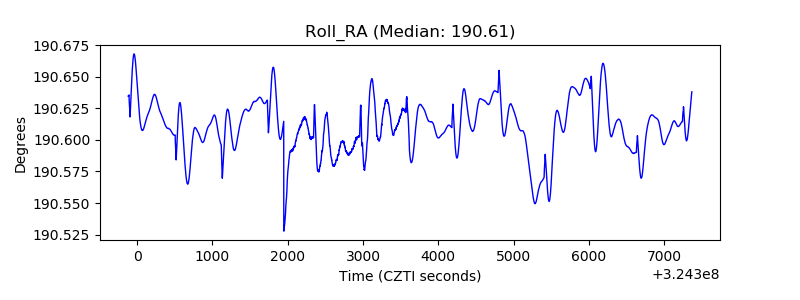 |
| Veto Counter | 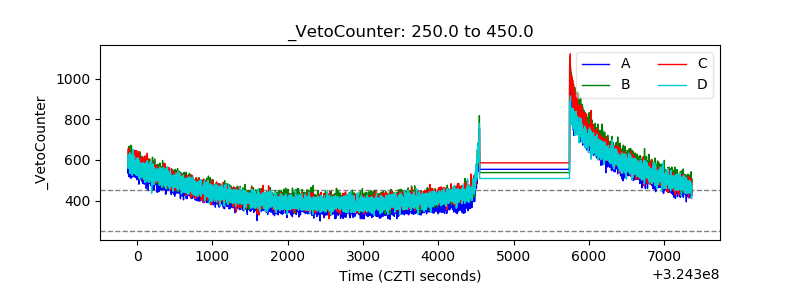 |