| Param | Original file | Final file |
|---|---|---|
| Filename | modeM0/AS1T03_183T01_9000003606_24533cztM0_level2.evt | modeM0/AS1T03_183T01_9000003606_24533cztM0_level2_quad_clean.evt |
| Size (bytes) | 495,365,760 | 125,254,080 |
| Size | 472.4 MB | 119.5 MB |
| Events in quadrant A | 3,445,874 | 883,967 |
| Events in quadrant B | 3,909,544 | 873,929 |
| Events in quadrant C | 2,886,070 | 839,056 |
| Events in quadrant D | 4,377,912 | 801,840 |
| Mode M0 | |||
|---|---|---|---|
| Quadrant | BADHDUFLAG | Total packets | Discarded packets |
| A | 0 | 13959 | 1 |
| B | 0 | 15296 | 1 |
| C | 0 | 12159 | 1 |
| D | 0 | 16881 | 1 |
| Mode SS | |||
|---|---|---|---|
| Quadrant | BADHDUFLAG | Total packets | Discarded packets |
| A | 0 | 114 | 0 |
| B | 0 | 114 | 0 |
| C | 0 | 114 | 0 |
| D | 0 | 114 | 0 |
| Mode M9 | |||
|---|---|---|---|
| Quadrant | BADHDUFLAG | Total packets | Discarded packets |
| A | 0 | 13 | 0 |
| B | 0 | 13 | 0 |
| C | 0 | 13 | 0 |
| D | 0 | 13 | 0 |
| Quadrant | Total seconds | Saturated seconds | Saturation percentage |
|---|---|---|---|
| A | 5647 | 100 | 1.770852% |
| B | 5647 | 404 | 7.154241% |
| C | 5647 | 91 | 1.611475% |
| D | 5648 | 401 | 7.099858% |
Noise dominated data is calculated using 1-second bins in cleaned event files. If a bin has >2000 counts, and if more than 50% of those come from <1% of pixels, then it is considered to be noise-dominated and hence unusable.
| Quadrant | # 1 sec bins | Bins with >0 counts | Bins with >2000 counts | High rate bins dominated by noise | Noise dominated (total time) | Noise dominated (detector-on time) | Marked lightcurve |
|---|---|---|---|---|---|---|---|
| A | 6922 | 5648 | 26 | 26 | 0.38% | 0.46% | 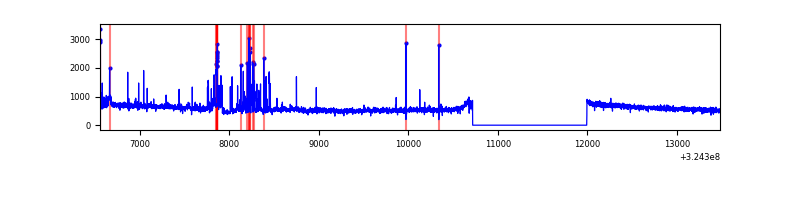 |
| B | 6922 | 5648 | 231 | 231 | 3.34% | 4.09% | 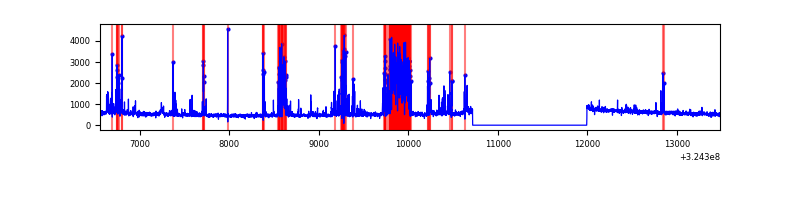 |
| C | 6922 | 5648 | 0 | 0 | 0.00% | 0.00% | 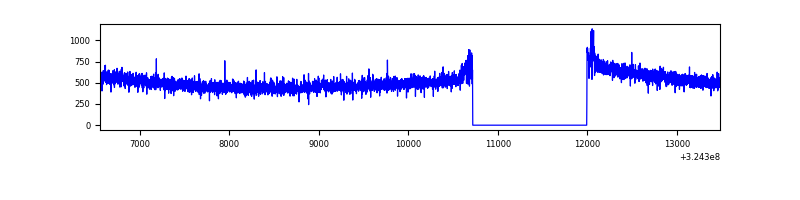 |
| D | 6923 | 5649 | 318 | 318 | 4.59% | 5.63% | 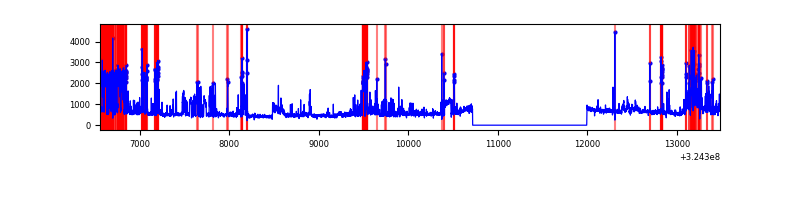 |
Top three noisy pixels from each quadrant. If the there are fewer than three noisy pixels in the level2.evt file, extra rows are filled as -1
| Pixel properties | Quadrant properties | ||||||
|---|---|---|---|---|---|---|---|
| Quadrant | DetID | PixID | Counts | Sigma | Mean | Median | Sigma |
| A | 14 | 111 | 527999 | 3561.52 | 753 | 740 | 148.0 |
| A | 4 | 2 | 15082 | 96.88 | 753 | 740 | 148.0 |
| A | 13 | 254 | 8902 | 55.13 | 753 | 740 | 148.0 |
| B | 3 | 64 | 1040248 | 7811.94 | 729 | 715 | 133.1 |
| B | 12 | 111 | 15364 | 110.09 | 729 | 715 | 133.1 |
| B | 0 | 190 | 14738 | 105.38 | 729 | 715 | 133.1 |
| C | 14 | 238 | 115736 | 713.06 | 706 | 713 | 161.3 |
| C | 2 | 16 | 9377 | 53.71 | 706 | 713 | 161.3 |
| C | 13 | 61 | 4924 | 26.11 | 706 | 713 | 161.3 |
| D | 1 | 52 | 1473345 | 8570.67 | 709 | 689 | 171.8 |
| D | 12 | 218 | 188305 | 1091.9 | 709 | 689 | 171.8 |
| D | 8 | 195 | 34923 | 199.24 | 709 | 689 | 171.8 |
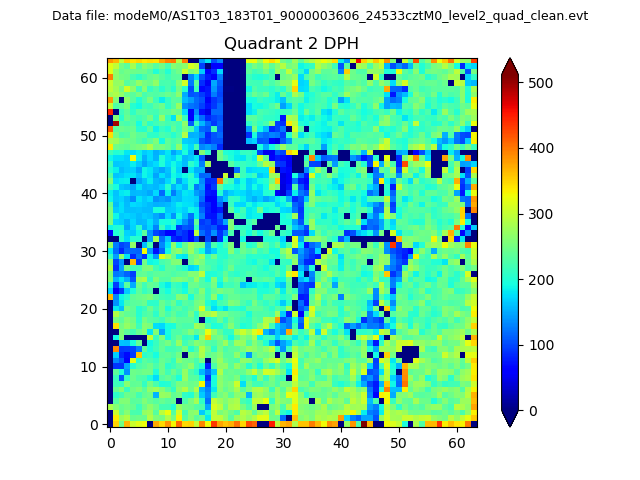
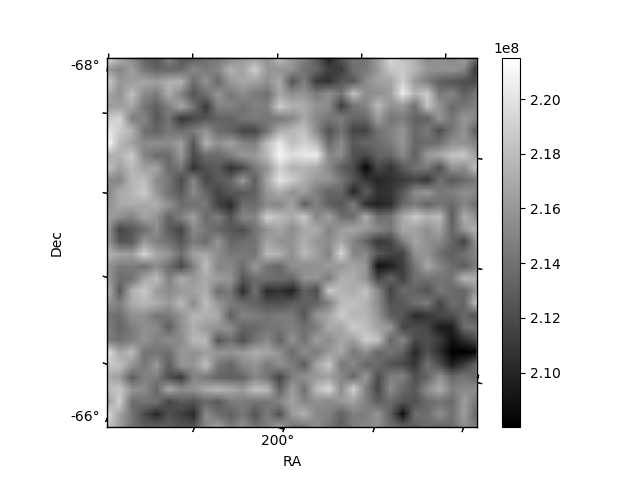
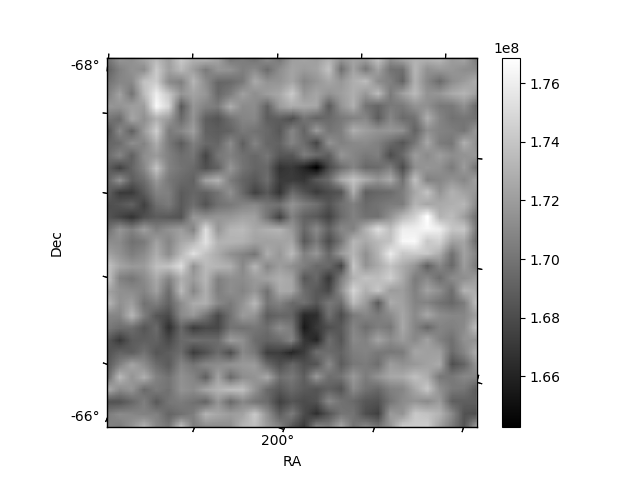
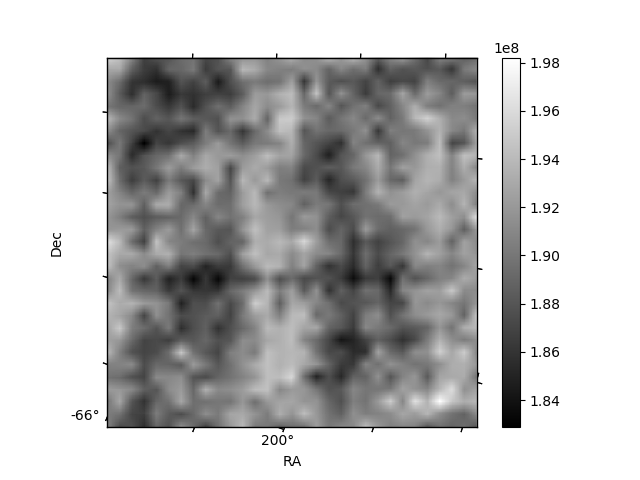
Histogram calculated using DETX and DETY for each event in the final _common_clean file
| Quadrant A | 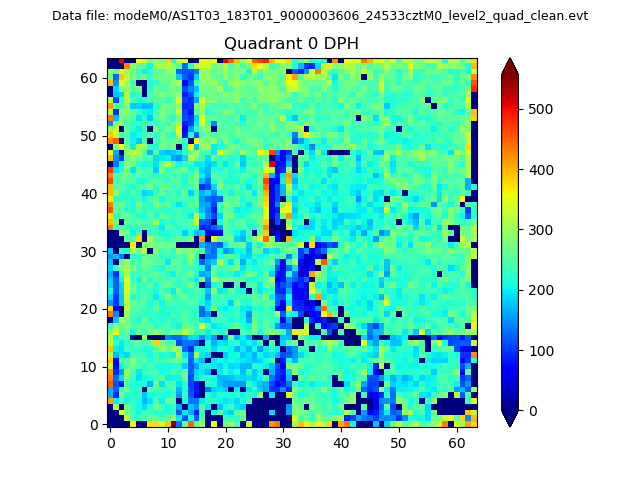 |
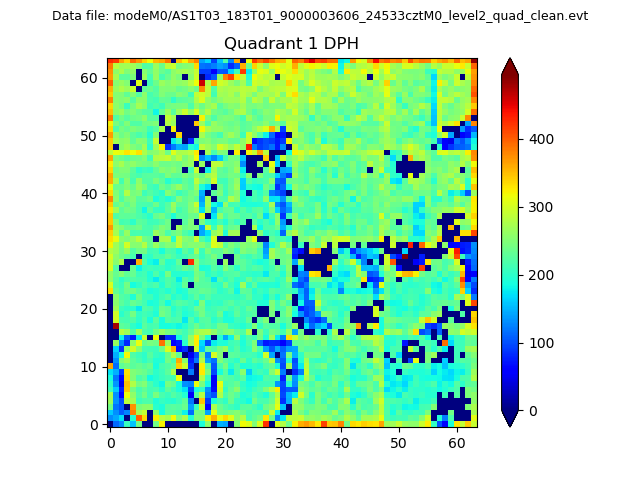 |
Quadrant B |
|---|---|---|---|
| Quadrant D | 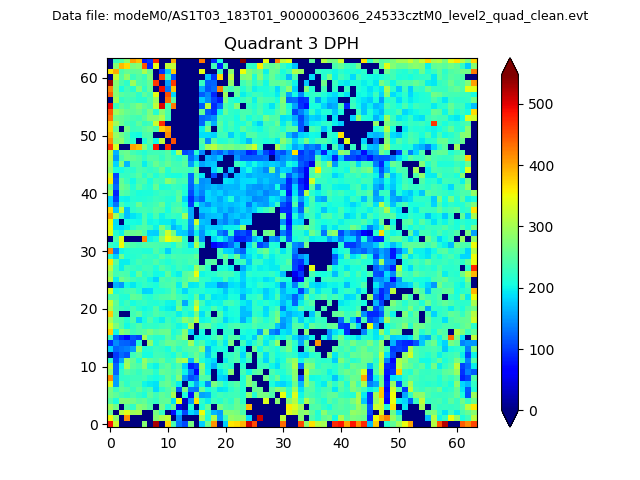 |
 |
Quadrant C |
| Plot type | Count rate plots | Images |
|---|---|---|
| Comparison with Poisson distribution Blue bars denote a histogram of data divided into 1 sec bins. Red curve is a Poisson curve with rate = median count rate of data. |
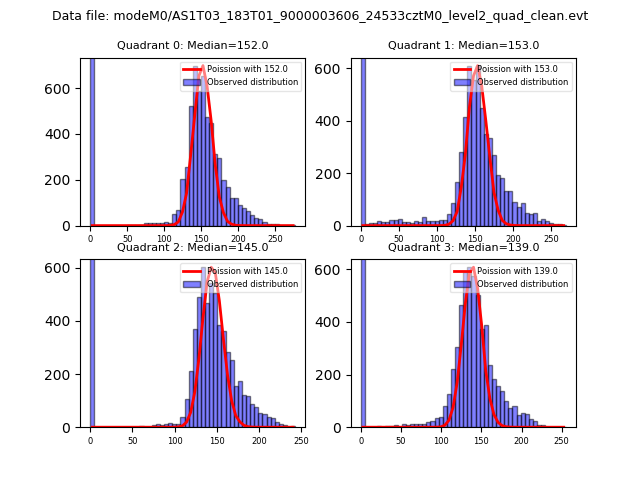 |
 |
| Quadrant-wise count rates Data is divided into 100 sec bins |
 |
|
| Module-wise count rates for Quadrant A Data is divided into 100 sec bins |
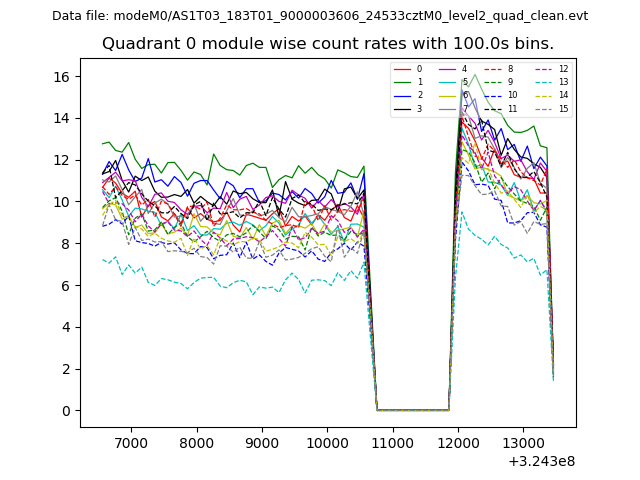 |
 |
| Module-wise count rates for Quadrant B Data is divided into 100 sec bins |
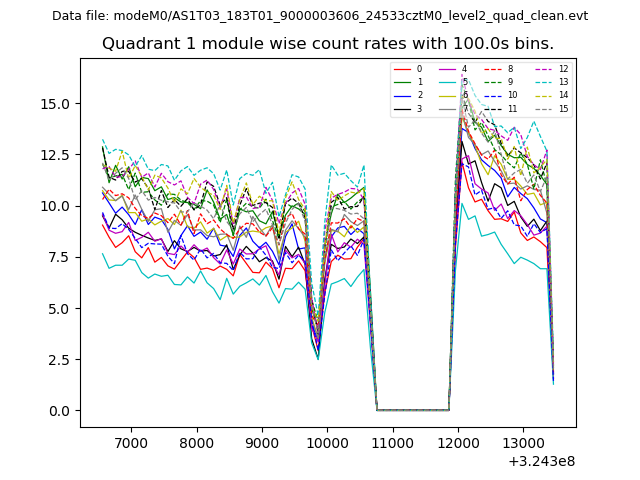 |
 |
| Module-wise count rates for Quadrant C Data is divided into 100 sec bins |
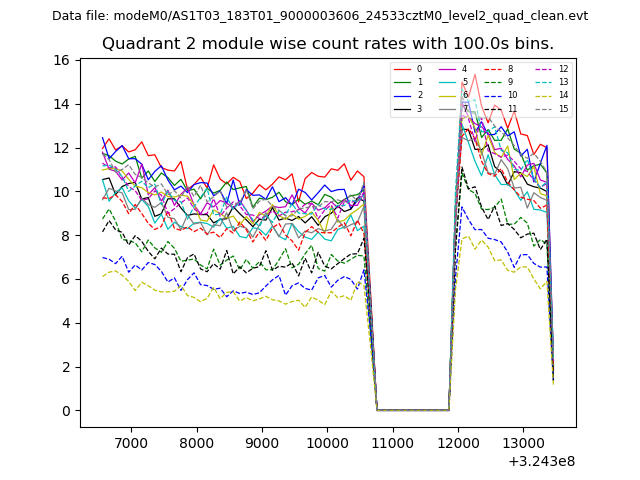 |
 |
| Module-wise count rates for Quadrant D Data is divided into 100 sec bins |
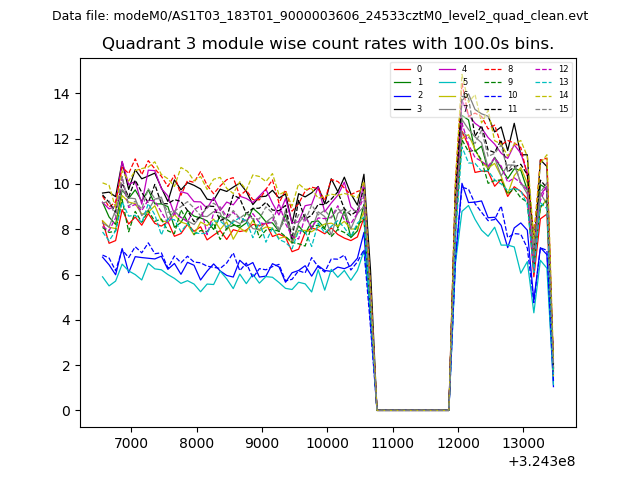 |
 |
| Parameter | Plot |
|---|---|
| CZT HV Monitor | 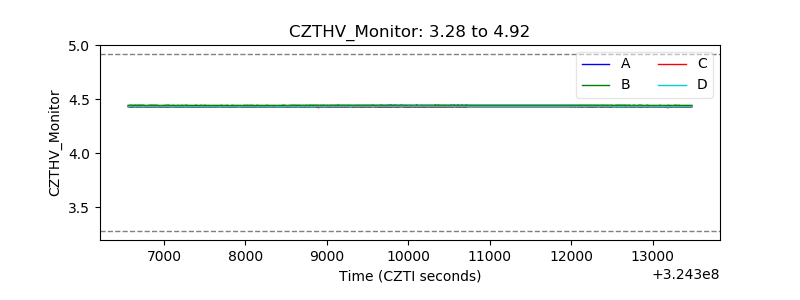 |
| D_VDD | 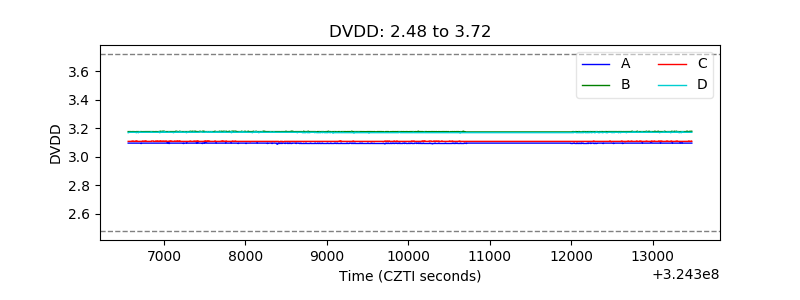 |
| Temperature 1 | 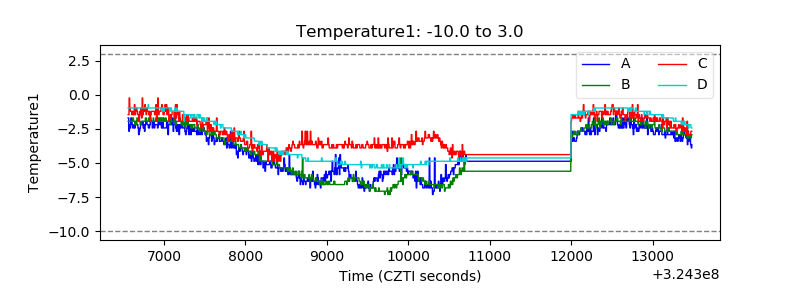 |
| Veto HV Monitor | 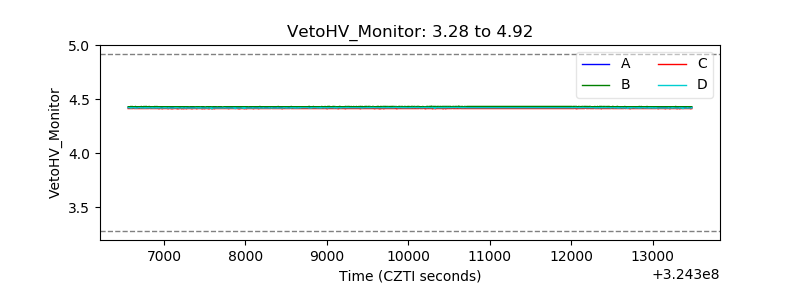 |
| Veto LLD | 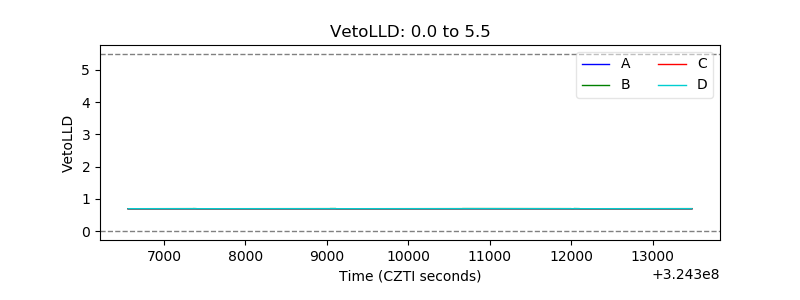 |
| Alpha Counter | 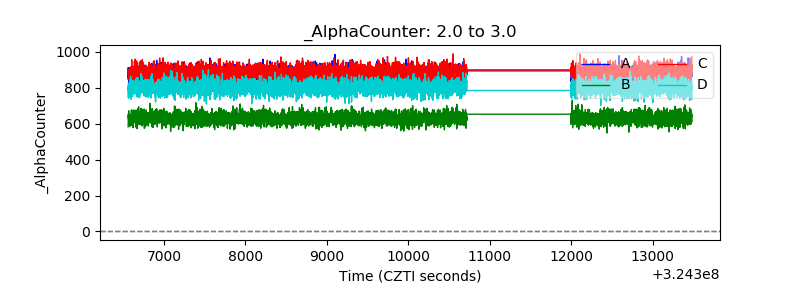 |
| _CPM_Rate | 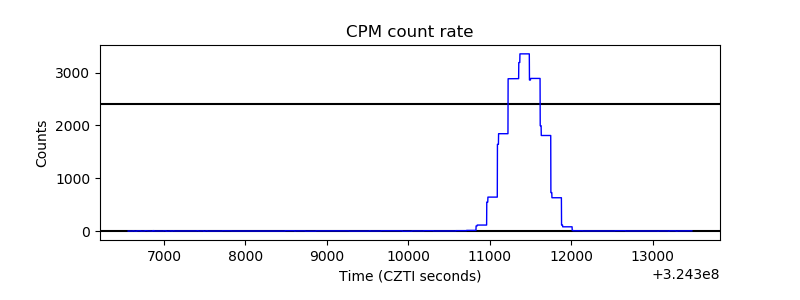 |
| CZT Counter |  |
| +2.5 Volts monitor |  |
| +5 Volts monitor |  |
| _ROLL_ROT | 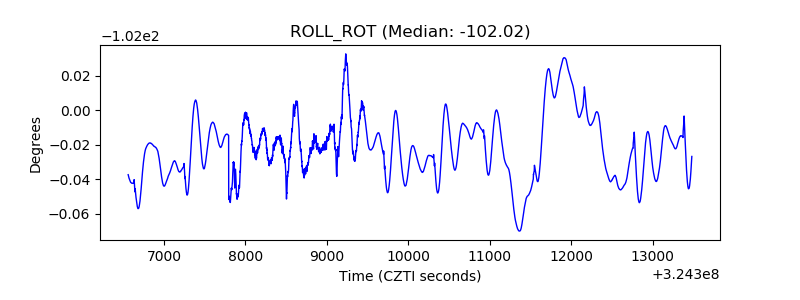 |
| _Roll_DEC | 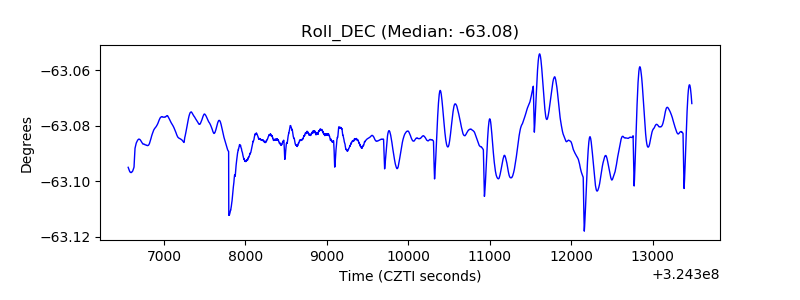 |
| _Roll_RA |  |
| Veto Counter | 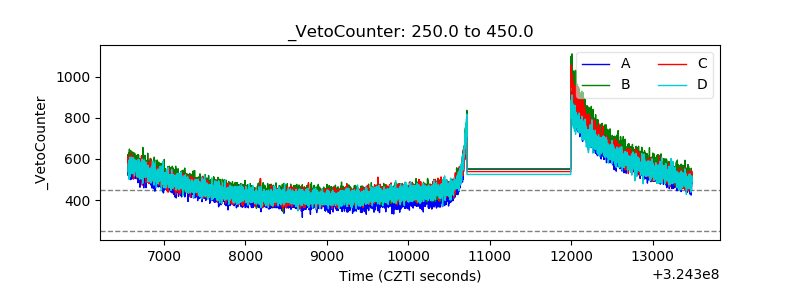 |