| Param | Original file | Final file |
|---|---|---|
| Filename | modeM0/AS1T03_183T01_9000003606_24534cztM0_level2.evt | modeM0/AS1T03_183T01_9000003606_24534cztM0_level2_quad_clean.evt |
| Size (bytes) | 496,319,040 | 127,523,520 |
| Size | 473.3 MB | 121.6 MB |
| Events in quadrant A | 2,974,041 | 912,565 |
| Events in quadrant B | 3,567,235 | 914,923 |
| Events in quadrant C | 2,920,448 | 854,049 |
| Events in quadrant D | 5,182,616 | 782,223 |
| Mode M0 | |||
|---|---|---|---|
| Quadrant | BADHDUFLAG | Total packets | Discarded packets |
| A | 0 | 12379 | 2 |
| B | 0 | 14157 | 1 |
| C | 0 | 12211 | 1 |
| D | 0 | 19333 | 1 |
| Mode SS | |||
|---|---|---|---|
| Quadrant | BADHDUFLAG | Total packets | Discarded packets |
| A | 0 | 116 | 0 |
| B | 0 | 116 | 0 |
| C | 0 | 116 | 0 |
| D | 0 | 116 | 0 |
| Mode M9 | |||
|---|---|---|---|
| Quadrant | BADHDUFLAG | Total packets | Discarded packets |
| A | 0 | 13 | 0 |
| B | 0 | 13 | 0 |
| C | 0 | 13 | 0 |
| D | 0 | 13 | 0 |
| Quadrant | Total seconds | Saturated seconds | Saturation percentage |
|---|---|---|---|
| A | 5700 | 77 | 1.350877% |
| B | 5701 | 274 | 4.806174% |
| C | 5701 | 106 | 1.859323% |
| D | 5701 | 566 | 9.928083% |
Noise dominated data is calculated using 1-second bins in cleaned event files. If a bin has >2000 counts, and if more than 50% of those come from <1% of pixels, then it is considered to be noise-dominated and hence unusable.
| Quadrant | # 1 sec bins | Bins with >0 counts | Bins with >2000 counts | High rate bins dominated by noise | Noise dominated (total time) | Noise dominated (detector-on time) | Marked lightcurve |
|---|---|---|---|---|---|---|---|
| A | 7010 | 5701 | 0 | 0 | 0.00% | 0.00% | 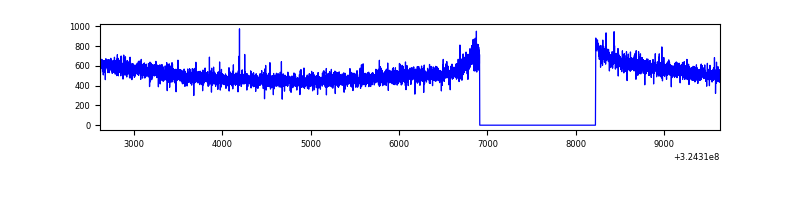 |
| B | 7011 | 5702 | 105 | 105 | 1.50% | 1.84% | 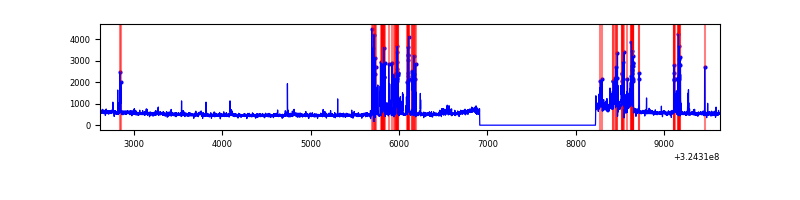 |
| C | 7011 | 5702 | 0 | 0 | 0.00% | 0.00% | 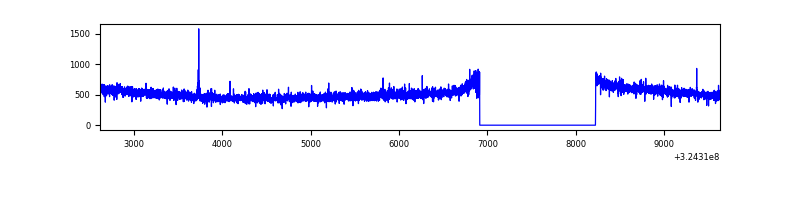 |
| D | 7011 | 5702 | 423 | 423 | 6.03% | 7.42% | 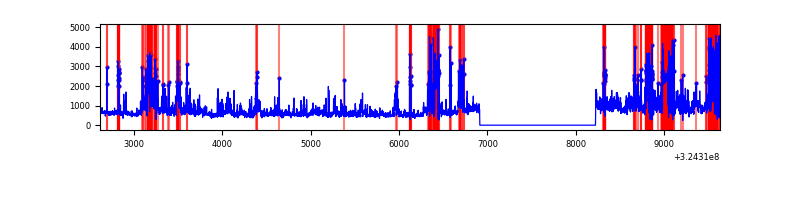 |
Top three noisy pixels from each quadrant. If the there are fewer than three noisy pixels in the level2.evt file, extra rows are filled as -1
| Pixel properties | Quadrant properties | ||||||
|---|---|---|---|---|---|---|---|
| Quadrant | DetID | PixID | Counts | Sigma | Mean | Median | Sigma |
| A | 14 | 111 | 15181 | 94.6 | 768 | 755 | 152.5 |
| A | 13 | 254 | 9012 | 54.15 | 768 | 755 | 152.5 |
| A | 0 | 226 | 6745 | 39.28 | 768 | 755 | 152.5 |
| B | 3 | 64 | 593193 | 4271.27 | 755 | 741 | 138.7 |
| B | 3 | 209 | 16469 | 113.39 | 755 | 741 | 138.7 |
| B | 12 | 111 | 15490 | 106.33 | 755 | 741 | 138.7 |
| C | 14 | 238 | 118145 | 723.52 | 713 | 721 | 162.3 |
| C | 2 | 16 | 14411 | 84.35 | 713 | 721 | 162.3 |
| C | 13 | 61 | 4994 | 26.33 | 713 | 721 | 162.3 |
| D | 1 | 52 | 2111031 | 12721.05 | 688 | 668 | 165.9 |
| D | 12 | 218 | 335880 | 2020.62 | 688 | 668 | 165.9 |
| D | 9 | 1 | 81088 | 484.76 | 688 | 668 | 165.9 |
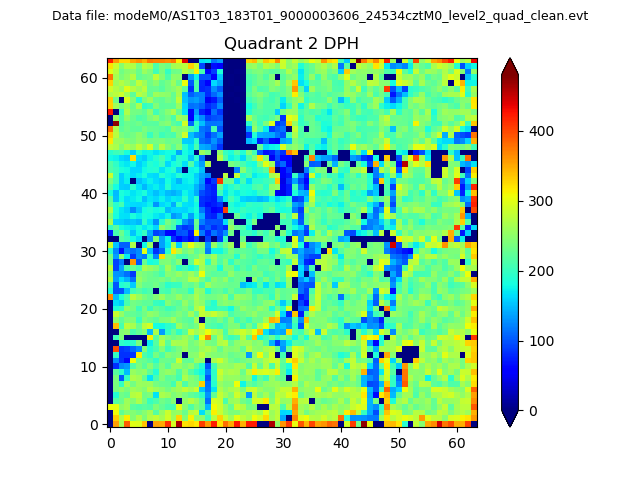
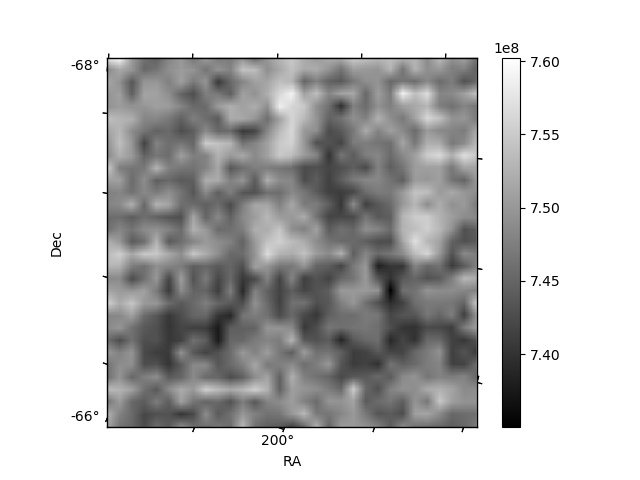
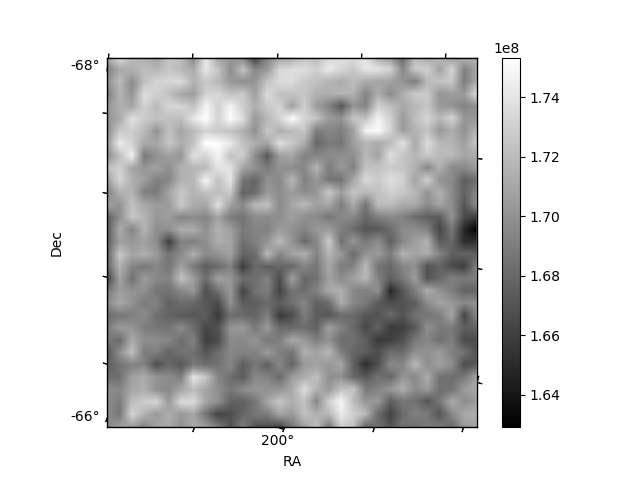
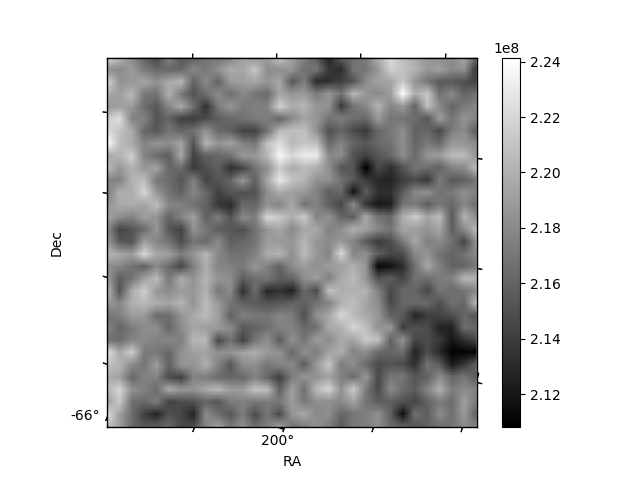
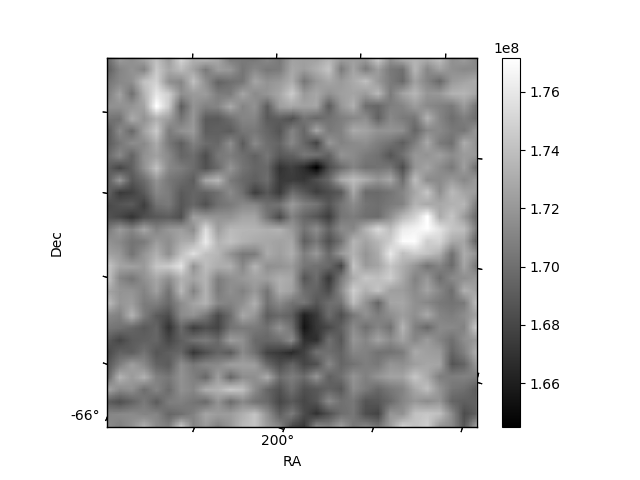
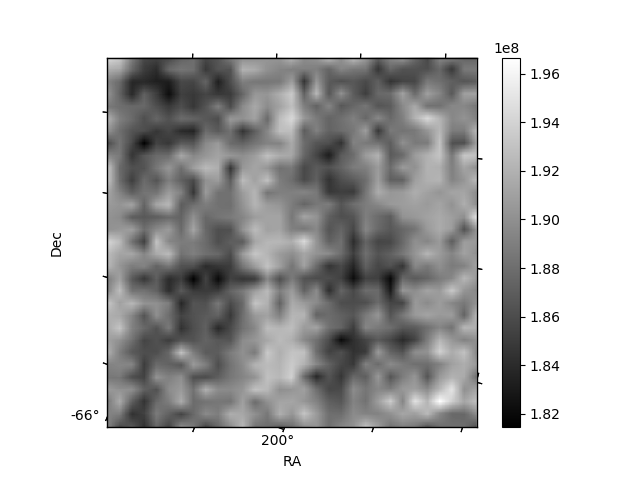
Histogram calculated using DETX and DETY for each event in the final _common_clean file
| Quadrant A | 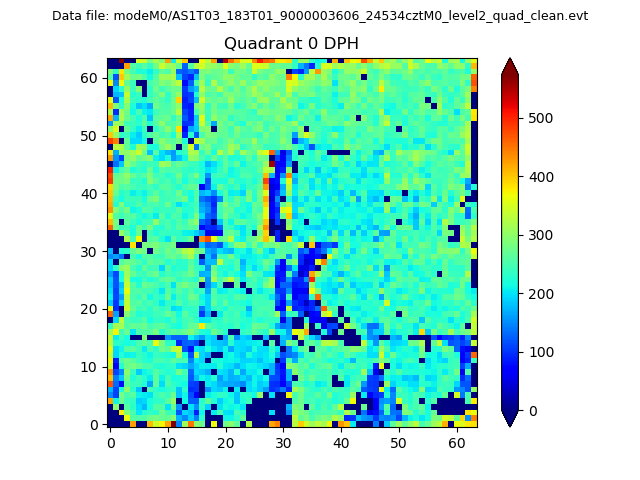 |
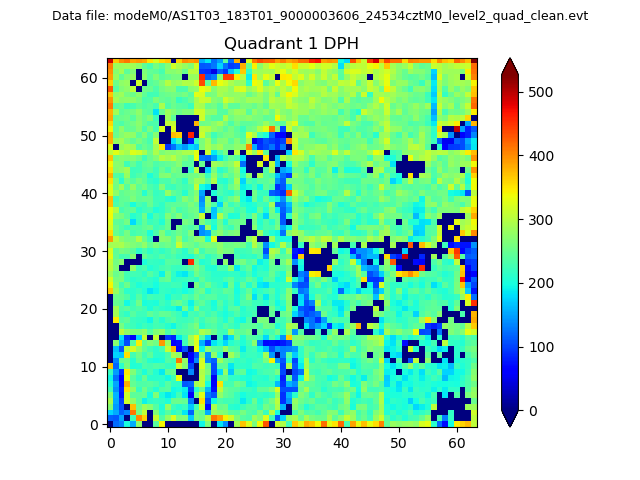 |
Quadrant B |
|---|---|---|---|
| Quadrant D | 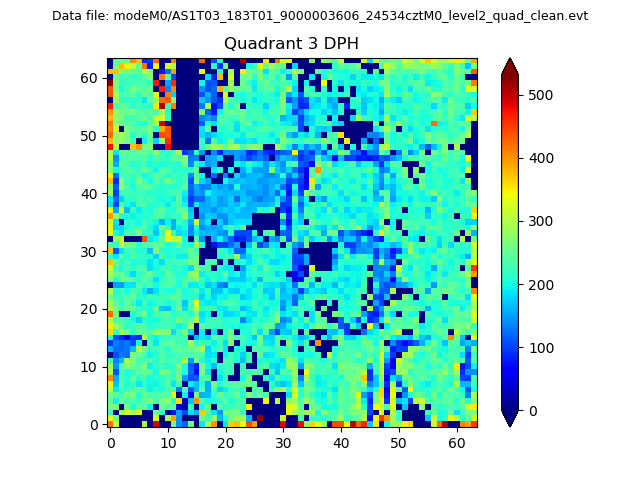 |
 |
Quadrant C |
| Plot type | Count rate plots | Images |
|---|---|---|
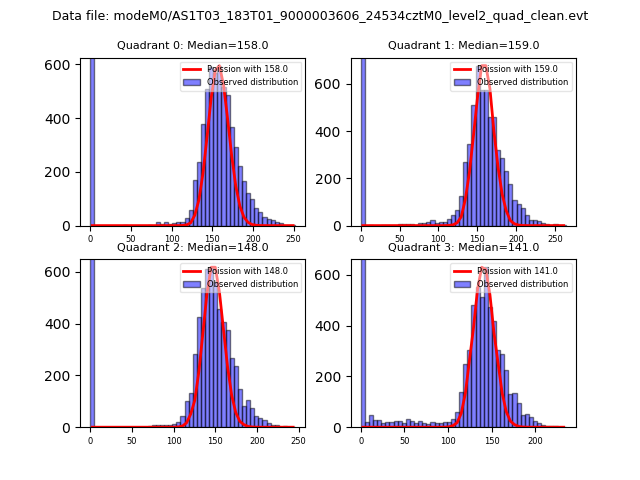
| Comparison with Poisson distribution Blue bars denote a histogram of data divided into 1 sec bins. Red curve is a Poisson curve with rate = median count rate of data. |
 |
 |
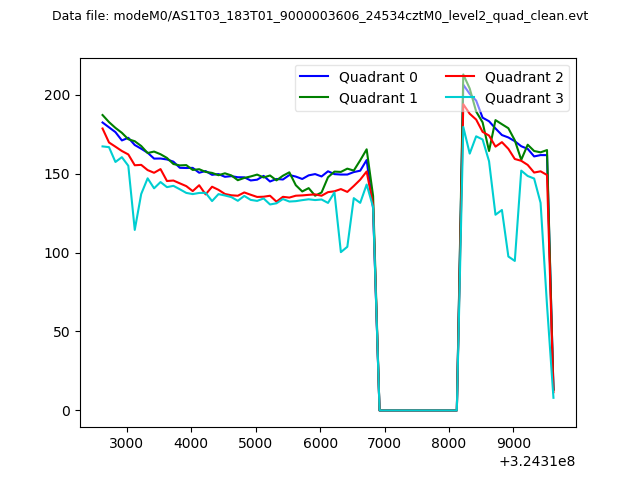
| Quadrant-wise count rates Data is divided into 100 sec bins |
 |
|
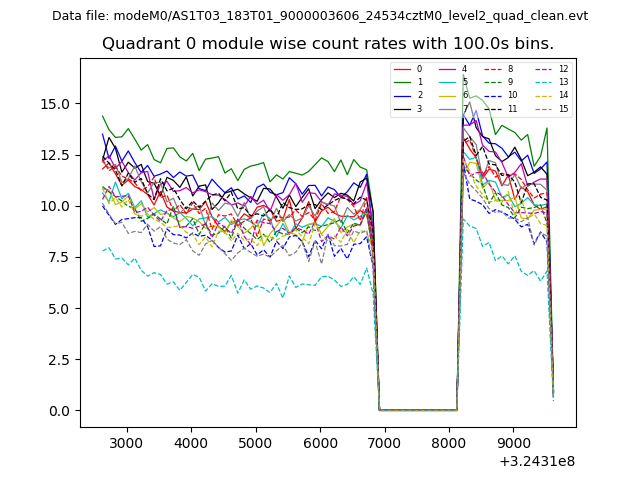
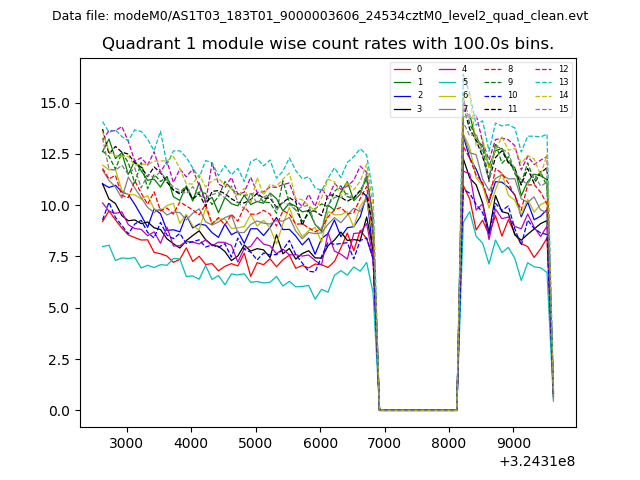
| Module-wise count rates for Quadrant A Data is divided into 100 sec bins |
 |
 |
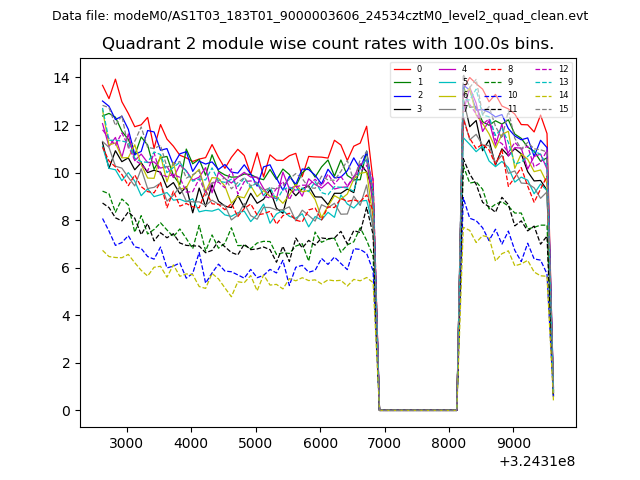
| Module-wise count rates for Quadrant B Data is divided into 100 sec bins |
 |
 |
| Module-wise count rates for Quadrant C Data is divided into 100 sec bins |
 |
 |
| Module-wise count rates for Quadrant D Data is divided into 100 sec bins |
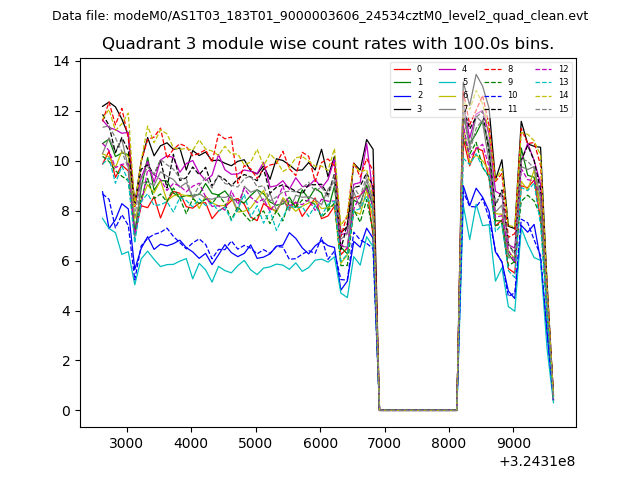 |
 |
| Parameter | Plot |
|---|---|
| CZT HV Monitor | 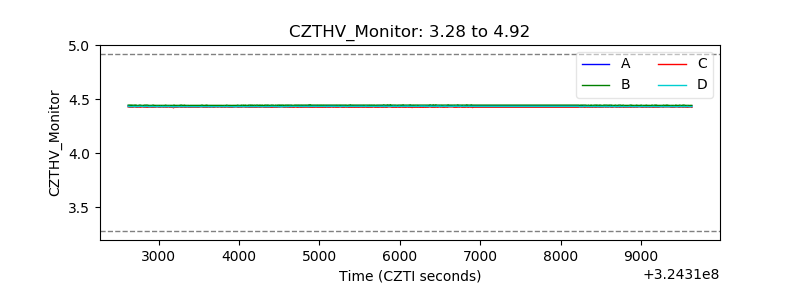 |
| D_VDD | 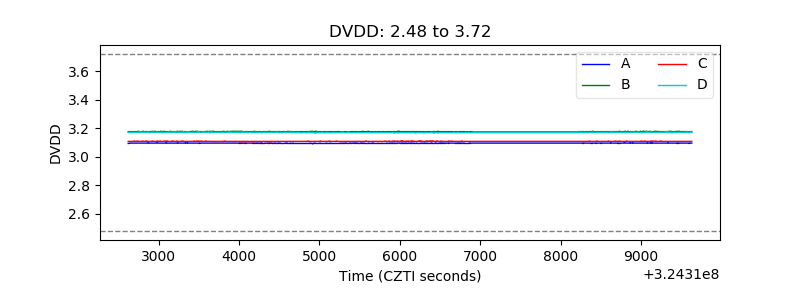 |
| Temperature 1 | 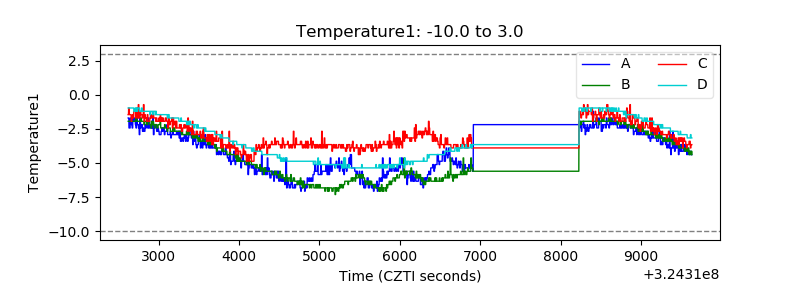 |
| Veto HV Monitor |  |
| Veto LLD | 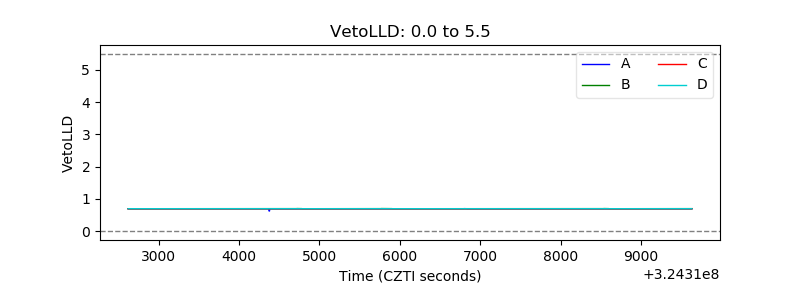 |
| Alpha Counter | 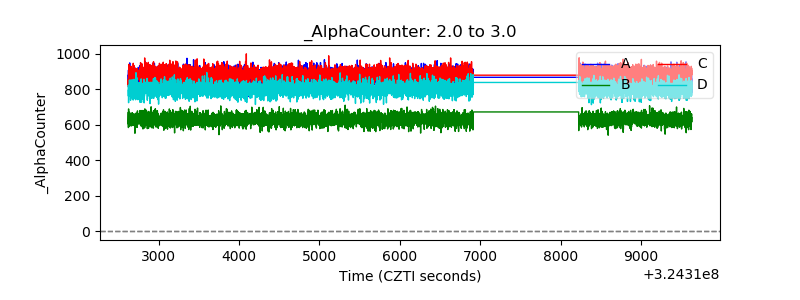 |
| _CPM_Rate | 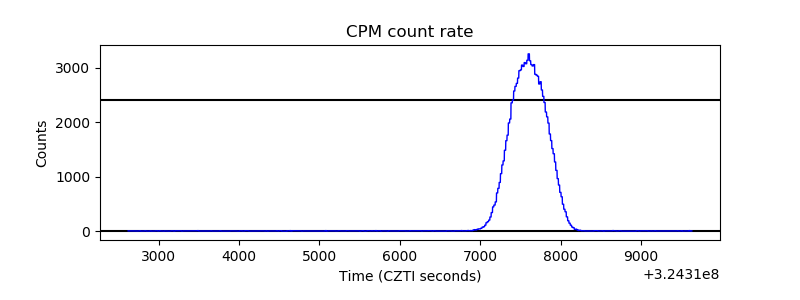 |
| CZT Counter | 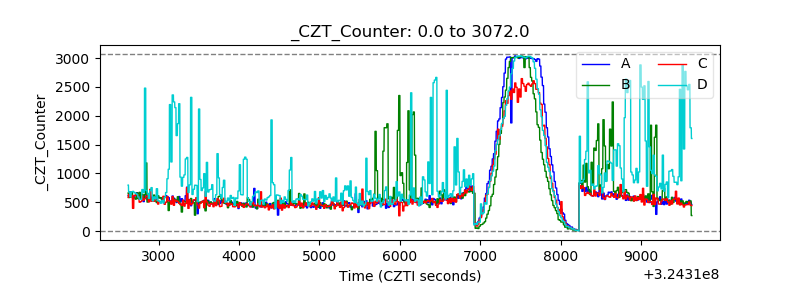 |
| +2.5 Volts monitor |  |
| +5 Volts monitor |  |
| _ROLL_ROT | 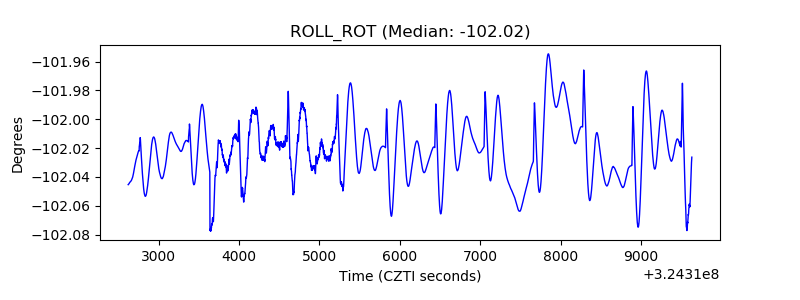 |
| _Roll_DEC | 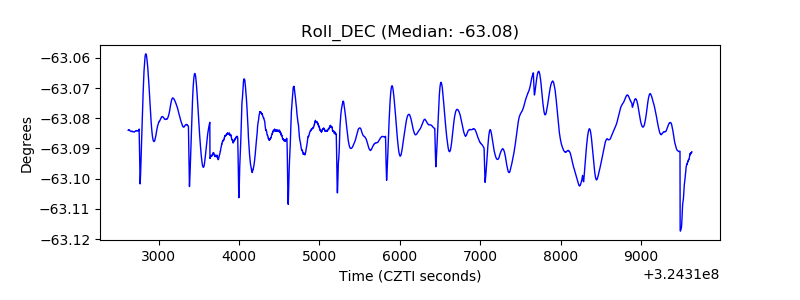 |
| _Roll_RA | 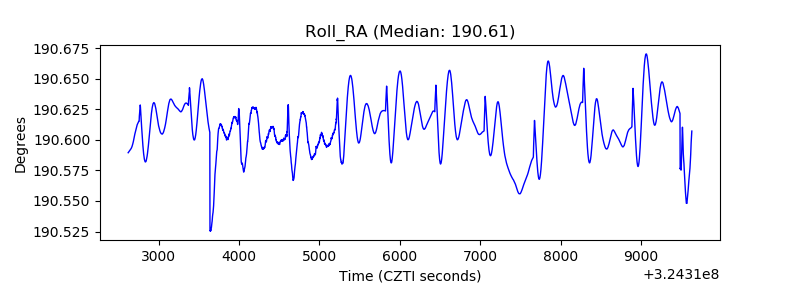 |
| Veto Counter | 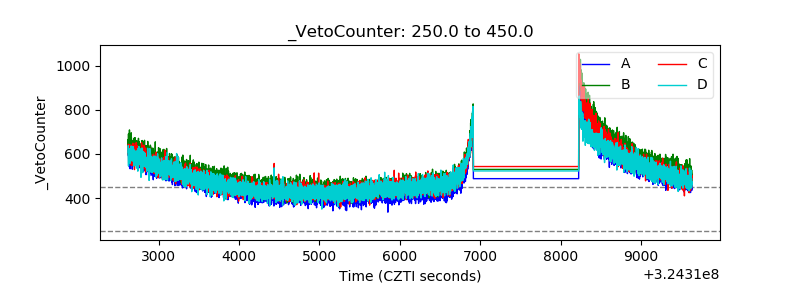 |