| Param | Original file | Final file |
|---|---|---|
| Filename | modeM0/AS1T03_183T01_9000003606_24535cztM0_level2.evt | modeM0/AS1T03_183T01_9000003606_24535cztM0_level2_quad_clean.evt |
| Size (bytes) | 584,311,680 | 131,590,080 |
| Size | 557.2 MB | 125.5 MB |
| Events in quadrant A | 3,251,183 | 941,609 |
| Events in quadrant B | 4,357,916 | 940,893 |
| Events in quadrant C | 3,268,585 | 884,664 |
| Events in quadrant D | 6,392,845 | 779,770 |
| Mode M0 | |||
|---|---|---|---|
| Quadrant | BADHDUFLAG | Total packets | Discarded packets |
| A | 0 | 13650 | 2 |
| B | 0 | 16973 | 2 |
| C | 0 | 13550 | 2 |
| D | 0 | 23522 | 3 |
| Mode SS | |||
|---|---|---|---|
| Quadrant | BADHDUFLAG | Total packets | Discarded packets |
| A | 0 | 128 | 0 |
| B | 0 | 128 | 0 |
| C | 0 | 128 | 0 |
| D | 0 | 128 | 0 |
| Mode M9 | |||
|---|---|---|---|
| Quadrant | BADHDUFLAG | Total packets | Discarded packets |
| A | 0 | 15 | 0 |
| B | 0 | 16 | 0 |
| C | 0 | 16 | 0 |
| D | 0 | 16 | 0 |
| Quadrant | Total seconds | Saturated seconds | Saturation percentage |
|---|---|---|---|
| A | 6281 | 50 | 0.796052% |
| B | 6281 | 328 | 5.222098% |
| C | 6281 | 74 | 1.178156% |
| D | 6280 | 743 | 11.831210% |
Noise dominated data is calculated using 1-second bins in cleaned event files. If a bin has >2000 counts, and if more than 50% of those come from <1% of pixels, then it is considered to be noise-dominated and hence unusable.
| Quadrant | # 1 sec bins | Bins with >0 counts | Bins with >2000 counts | High rate bins dominated by noise | Noise dominated (total time) | Noise dominated (detector-on time) | Marked lightcurve |
|---|---|---|---|---|---|---|---|
| A | 7636 | 6282 | 3 | 3 | 0.04% | 0.05% | 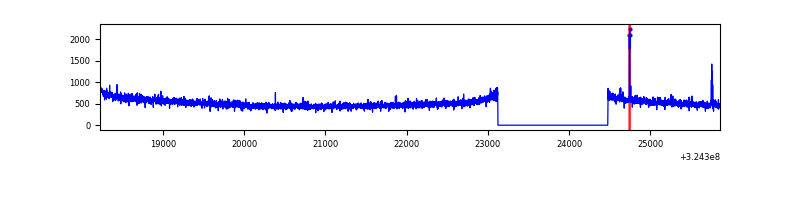 |
| B | 7636 | 6282 | 167 | 167 | 2.19% | 2.66% | 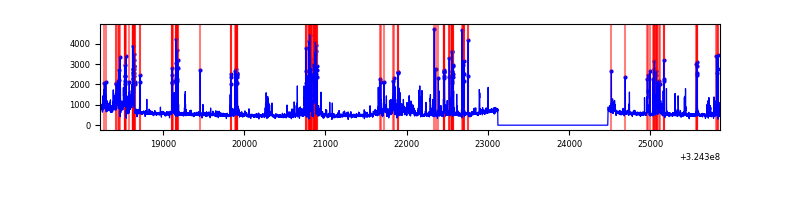 |
| C | 7636 | 6282 | 0 | 0 | 0.00% | 0.00% |  |
| D | 7635 | 6281 | 655 | 655 | 8.58% | 10.43% | 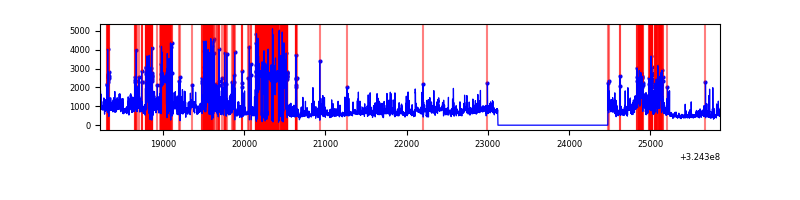 |
Top three noisy pixels from each quadrant. If the there are fewer than three noisy pixels in the level2.evt file, extra rows are filled as -1
| Pixel properties | Quadrant properties | ||||||
|---|---|---|---|---|---|---|---|
| Quadrant | DetID | PixID | Counts | Sigma | Mean | Median | Sigma |
| A | 4 | 2 | 27566 | 161.4 | 836 | 822 | 165.7 |
| A | 13 | 254 | 10058 | 55.74 | 836 | 822 | 165.7 |
| A | 0 | 226 | 7075 | 37.74 | 836 | 822 | 165.7 |
| B | 3 | 64 | 1026328 | 6750.79 | 823 | 807 | 151.9 |
| B | 5 | 172 | 79380 | 517.23 | 823 | 807 | 151.9 |
| B | 0 | 197 | 29360 | 187.96 | 823 | 807 | 151.9 |
| C | 14 | 238 | 129404 | 721.77 | 782 | 790 | 178.2 |
| C | 2 | 16 | 80551 | 447.61 | 782 | 790 | 178.2 |
| C | 13 | 61 | 5496 | 26.41 | 782 | 790 | 178.2 |
| D | 1 | 52 | 3139676 | 17645.57 | 734 | 714 | 177.9 |
| D | 12 | 218 | 394628 | 2214.37 | 734 | 714 | 177.9 |
| D | 8 | 195 | 31085 | 170.73 | 734 | 714 | 177.9 |
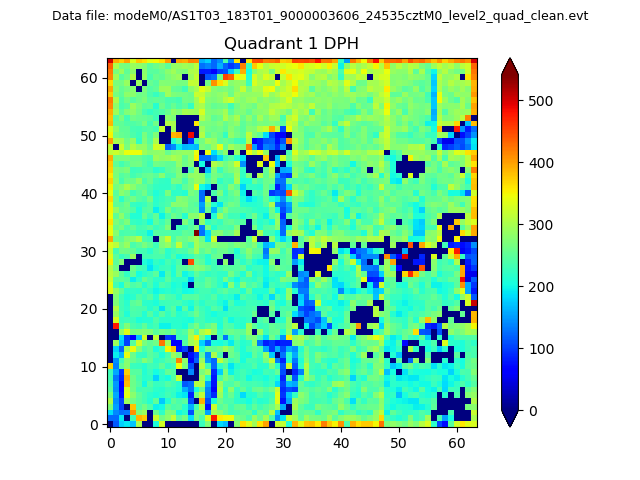
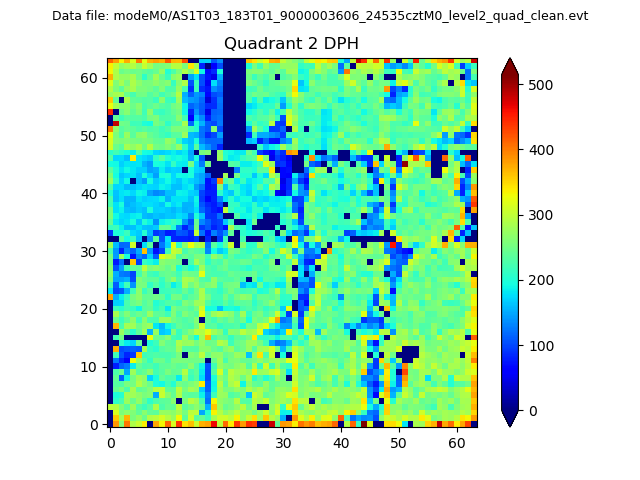
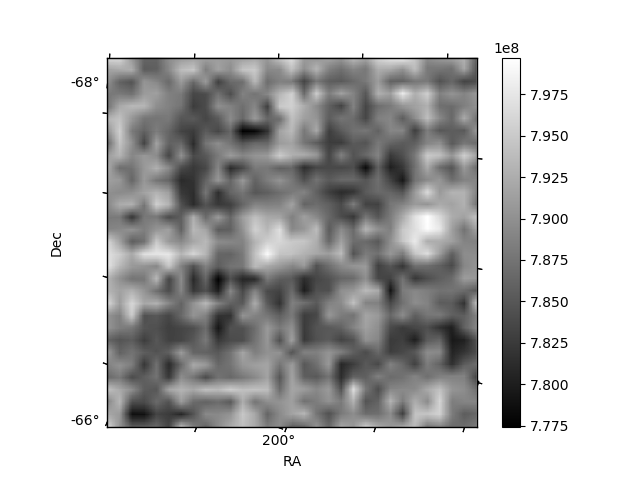
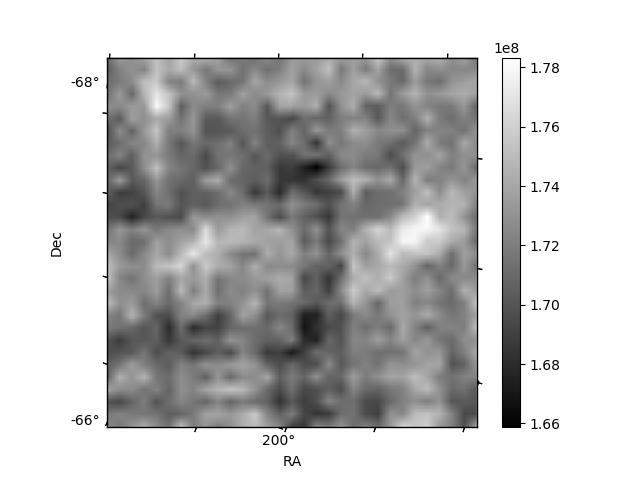
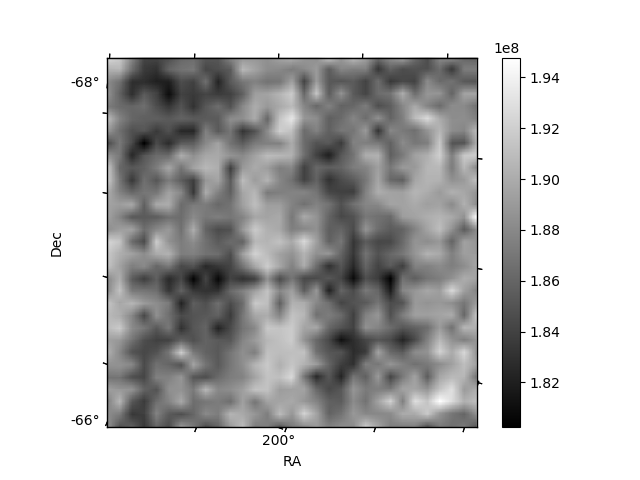
Histogram calculated using DETX and DETY for each event in the final _common_clean file
| Quadrant A | 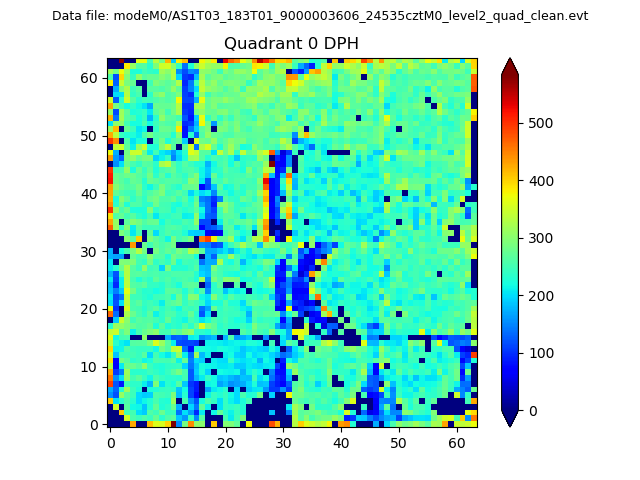 |
 |
Quadrant B |
|---|---|---|---|
| Quadrant D | 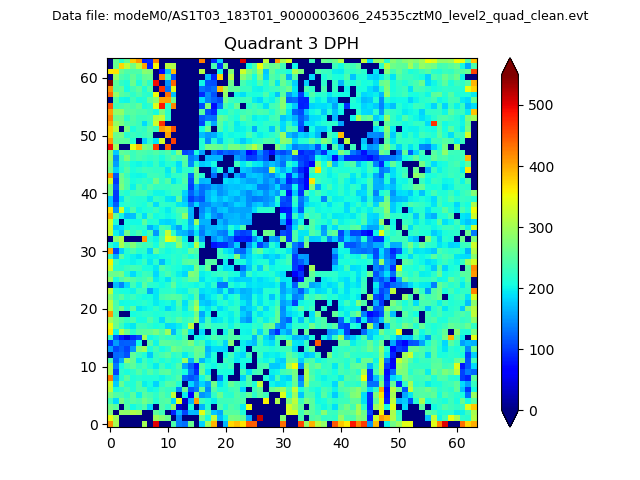 |
 |
Quadrant C |
| Plot type | Count rate plots | Images |
|---|---|---|
| Comparison with Poisson distribution Blue bars denote a histogram of data divided into 1 sec bins. Red curve is a Poisson curve with rate = median count rate of data. |
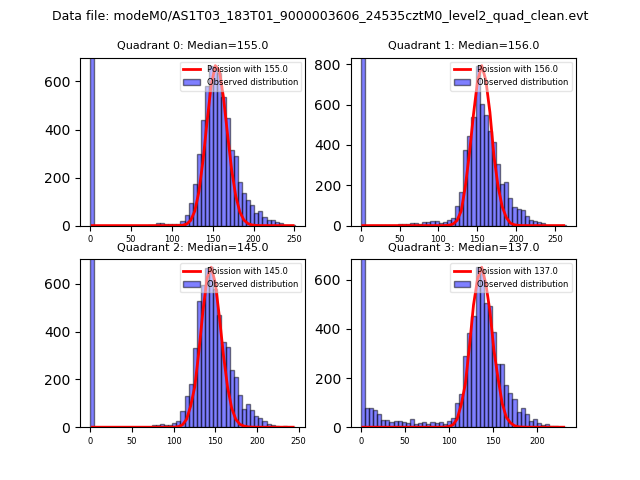 |
 |
| Quadrant-wise count rates Data is divided into 100 sec bins |
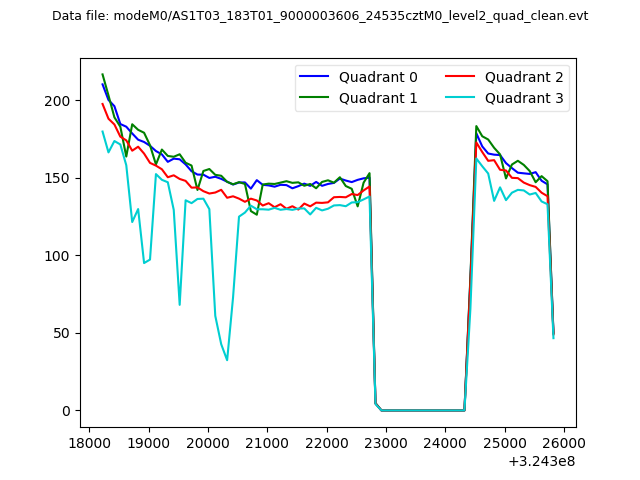 |
|
| Module-wise count rates for Quadrant A Data is divided into 100 sec bins |
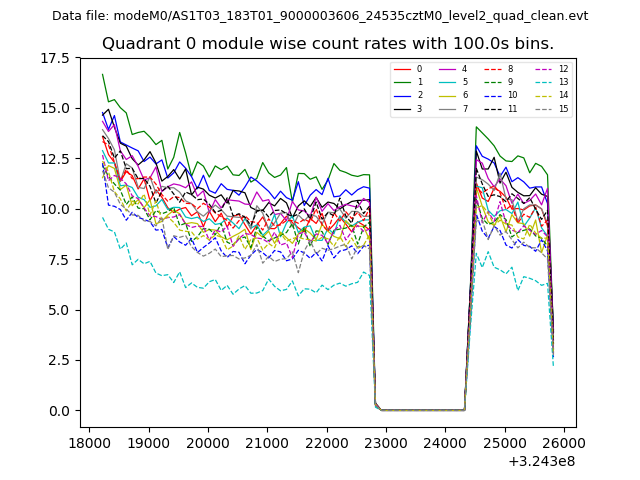 |
 |
| Module-wise count rates for Quadrant B Data is divided into 100 sec bins |
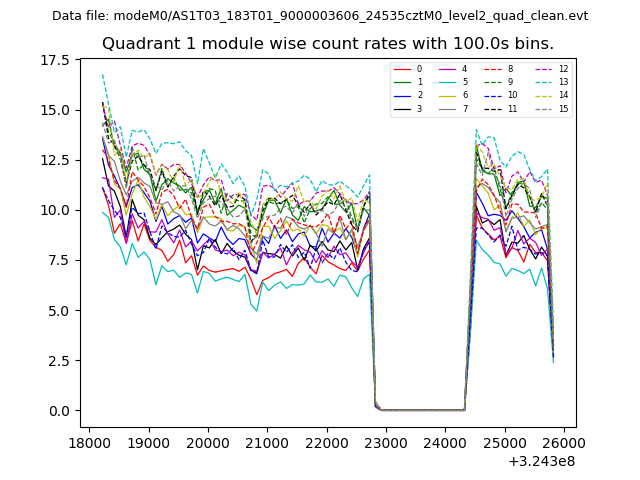 |
 |
| Module-wise count rates for Quadrant C Data is divided into 100 sec bins |
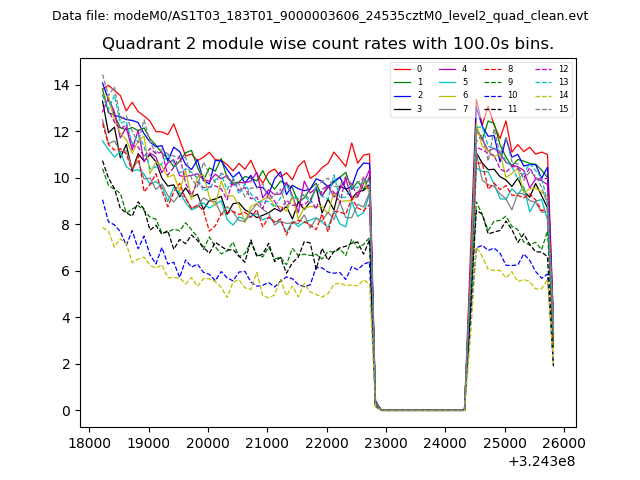 |
 |
| Module-wise count rates for Quadrant D Data is divided into 100 sec bins |
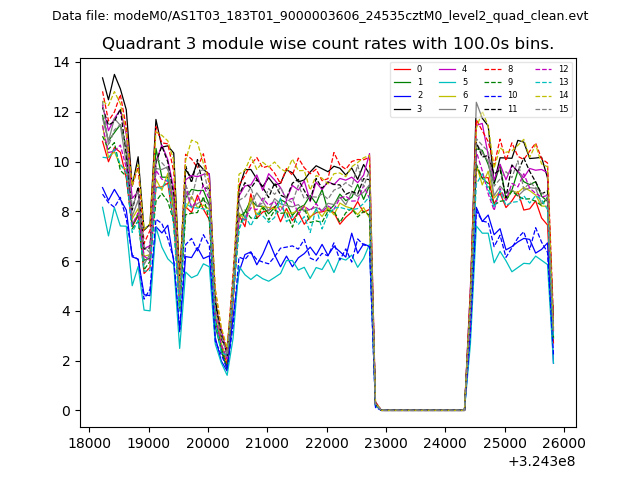 |
 |
| Parameter | Plot |
|---|---|
| CZT HV Monitor | 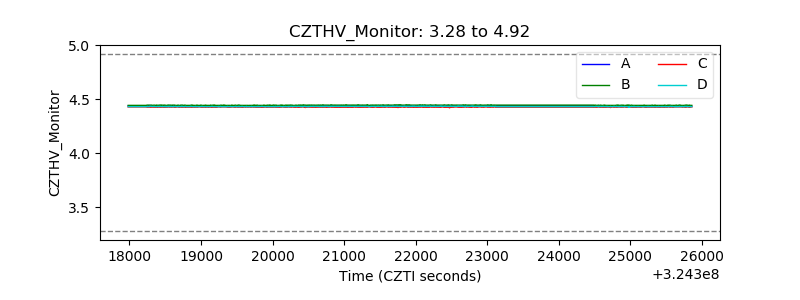 |
| D_VDD | 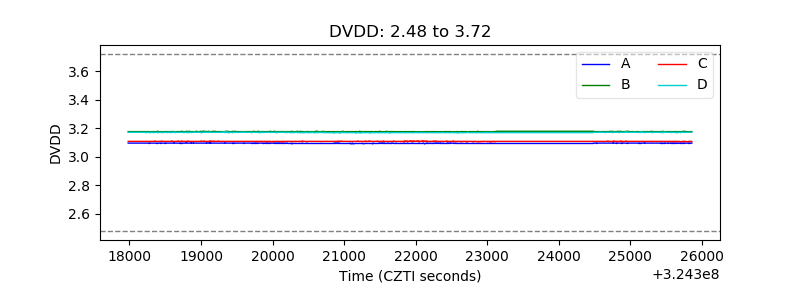 |
| Temperature 1 | 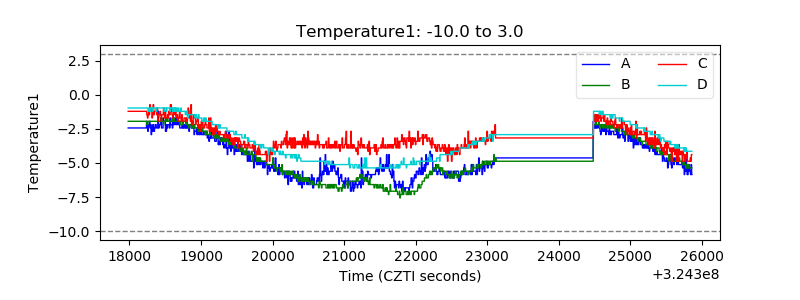 |
| Veto HV Monitor | 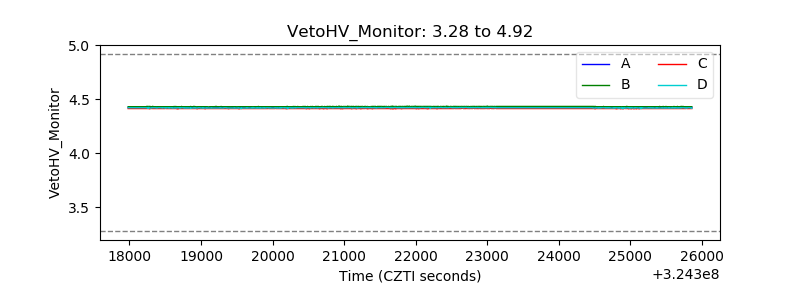 |
| Veto LLD | 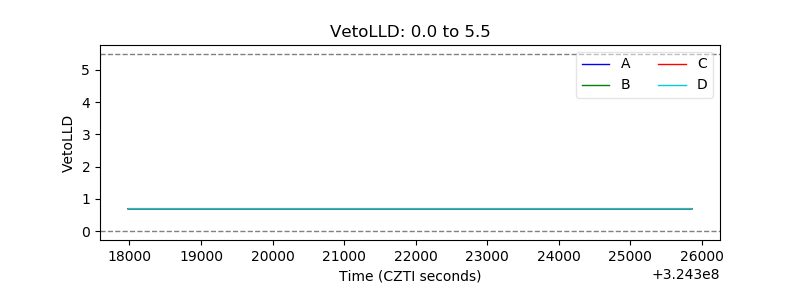 |
| Alpha Counter | 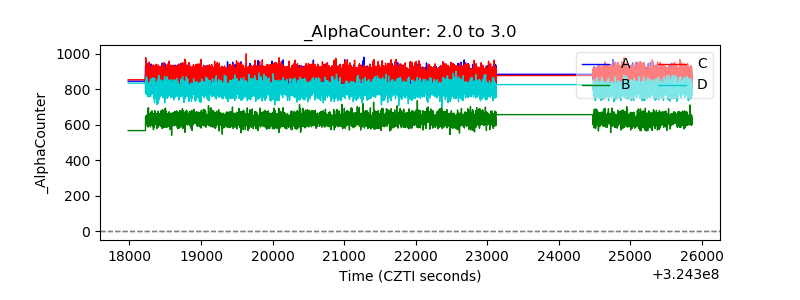 |
| _CPM_Rate | 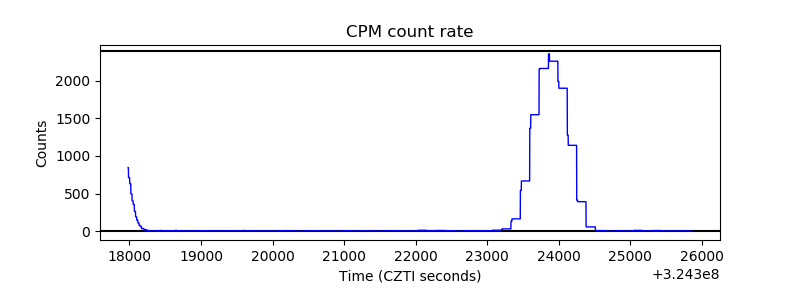 |
| CZT Counter | 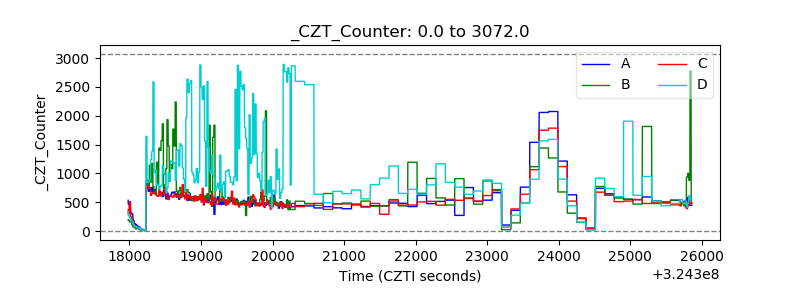 |
| +2.5 Volts monitor | 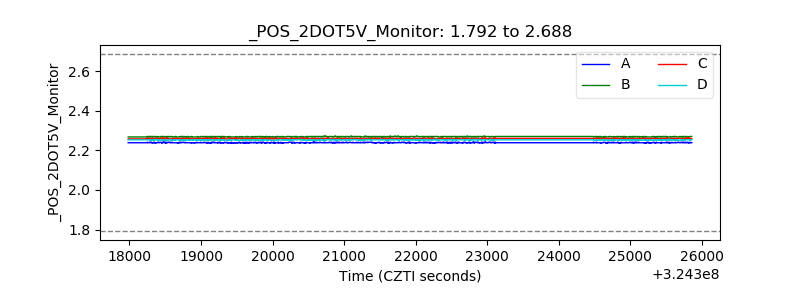 |
| +5 Volts monitor |  |
| _ROLL_ROT | 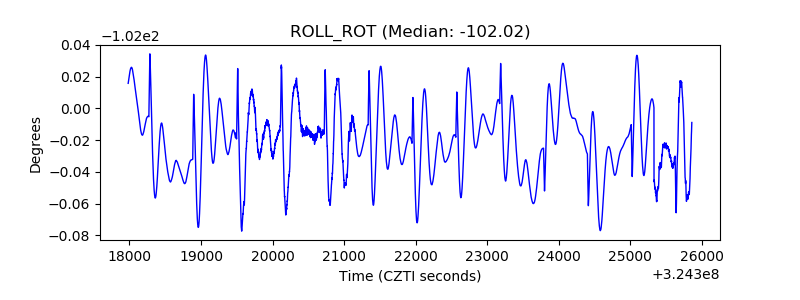 |
| _Roll_DEC | 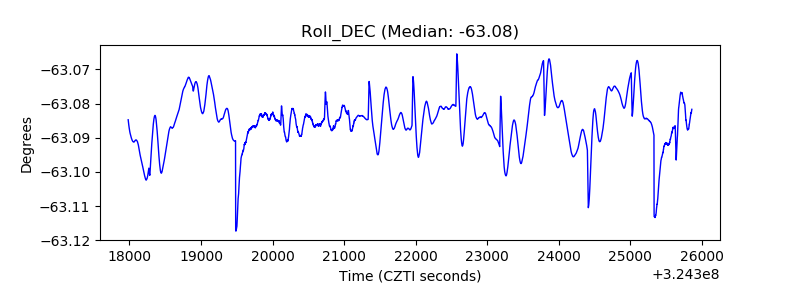 |
| _Roll_RA | 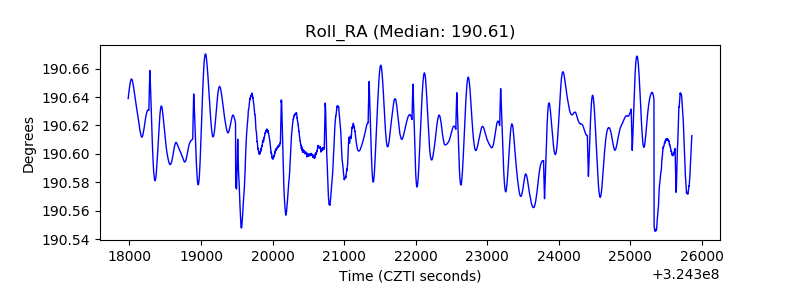 |
| Veto Counter | 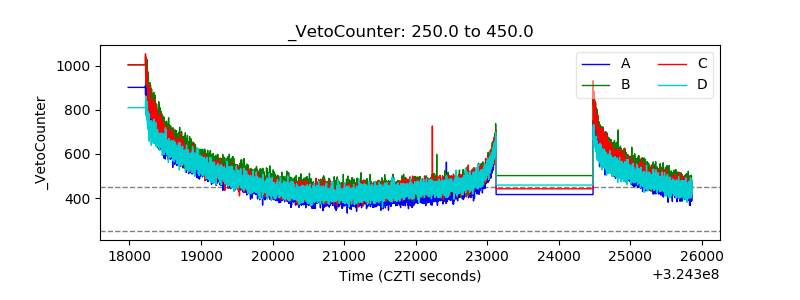 |