| Param | Original file | Final file |
|---|---|---|
| Filename | modeM0/AS1T03_183T01_9000003606_24536cztM0_level2.evt | modeM0/AS1T03_183T01_9000003606_24536cztM0_level2_quad_clean.evt |
| Size (bytes) | 540,771,840 | 121,417,920 |
| Size | 515.7 MB | 115.8 MB |
| Events in quadrant A | 3,145,912 | 845,530 |
| Events in quadrant B | 4,708,771 | 821,790 |
| Events in quadrant C | 3,124,743 | 803,018 |
| Events in quadrant D | 4,965,793 | 762,019 |
| Mode M0 | |||
|---|---|---|---|
| Quadrant | BADHDUFLAG | Total packets | Discarded packets |
| A | 0 | 13464 | 2 |
| B | 0 | 18018 | 2 |
| C | 0 | 13334 | 2 |
| D | 0 | 19266 | 2 |
| Mode SS | |||
|---|---|---|---|
| Quadrant | BADHDUFLAG | Total packets | Discarded packets |
| A | 0 | 130 | 0 |
| B | 0 | 130 | 0 |
| C | 0 | 130 | 0 |
| D | 0 | 130 | 0 |
| Mode M9 | |||
|---|---|---|---|
| Quadrant | BADHDUFLAG | Total packets | Discarded packets |
| A | 0 | 17 | 0 |
| B | 0 | 18 | 0 |
| C | 0 | 18 | 0 |
| D | 0 | 18 | 0 |
| Quadrant | Total seconds | Saturated seconds | Saturation percentage |
|---|---|---|---|
| A | 6373 | 59 | 0.925781% |
| B | 6373 | 573 | 8.991056% |
| C | 6373 | 65 | 1.019928% |
| D | 6373 | 221 | 3.467755% |
Noise dominated data is calculated using 1-second bins in cleaned event files. If a bin has >2000 counts, and if more than 50% of those come from <1% of pixels, then it is considered to be noise-dominated and hence unusable.
| Quadrant | # 1 sec bins | Bins with >0 counts | Bins with >2000 counts | High rate bins dominated by noise | Noise dominated (total time) | Noise dominated (detector-on time) | Marked lightcurve |
|---|---|---|---|---|---|---|---|
| A | 7583 | 6374 | 3 | 3 | 0.04% | 0.05% | 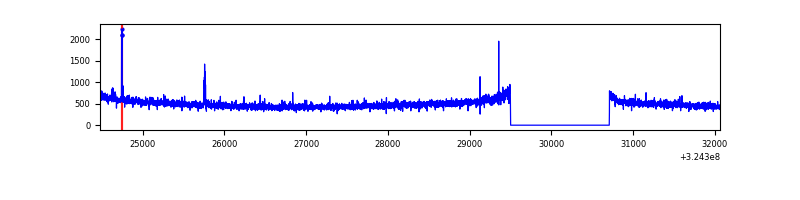 |
| B | 7583 | 6374 | 336 | 336 | 4.43% | 5.27% | 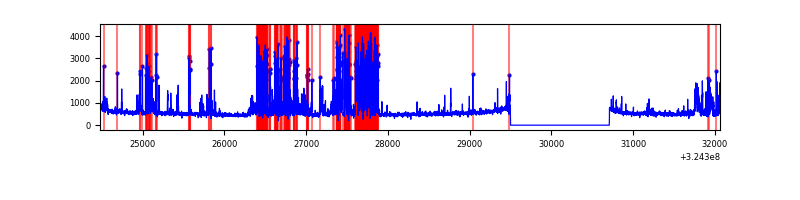 |
| C | 7583 | 6374 | 1 | 1 | 0.01% | 0.02% | 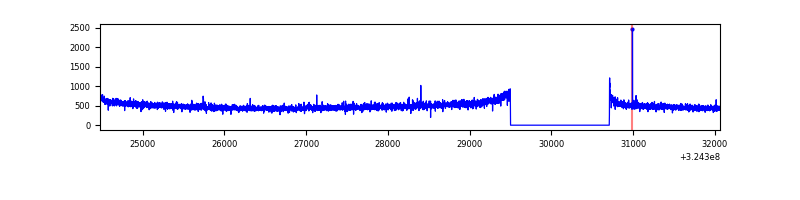 |
| D | 7583 | 6374 | 150 | 150 | 1.98% | 2.35% | 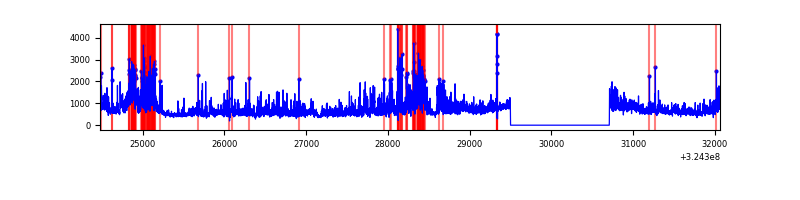 |
Top three noisy pixels from each quadrant. If the there are fewer than three noisy pixels in the level2.evt file, extra rows are filled as -1
| Pixel properties | Quadrant properties | ||||||
|---|---|---|---|---|---|---|---|
| Quadrant | DetID | PixID | Counts | Sigma | Mean | Median | Sigma |
| A | 4 | 2 | 29103 | 175.91 | 808 | 793 | 160.9 |
| A | 13 | 254 | 10530 | 60.5 | 808 | 793 | 160.9 |
| A | 3 | 137 | 7136 | 39.41 | 808 | 793 | 160.9 |
| B | 3 | 64 | 1453333 | 9994.76 | 781 | 762 | 145.3 |
| B | 5 | 172 | 188687 | 1293.06 | 781 | 762 | 145.3 |
| B | 12 | 111 | 17212 | 113.19 | 781 | 762 | 145.3 |
| C | 14 | 238 | 124935 | 709.4 | 763 | 772 | 175.0 |
| C | 2 | 16 | 15612 | 84.79 | 763 | 772 | 175.0 |
| C | 13 | 61 | 5464 | 26.81 | 763 | 772 | 175.0 |
| D | 1 | 52 | 1563446 | 8485.77 | 758 | 735 | 184.2 |
| D | 12 | 218 | 332207 | 1799.95 | 758 | 735 | 184.2 |
| D | 8 | 195 | 174901 | 945.75 | 758 | 735 | 184.2 |
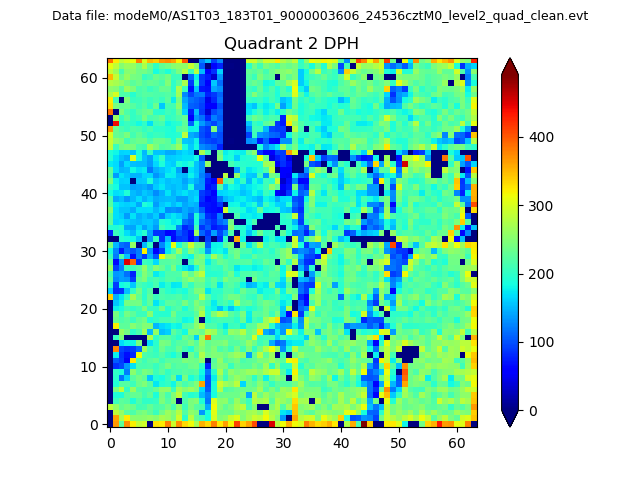
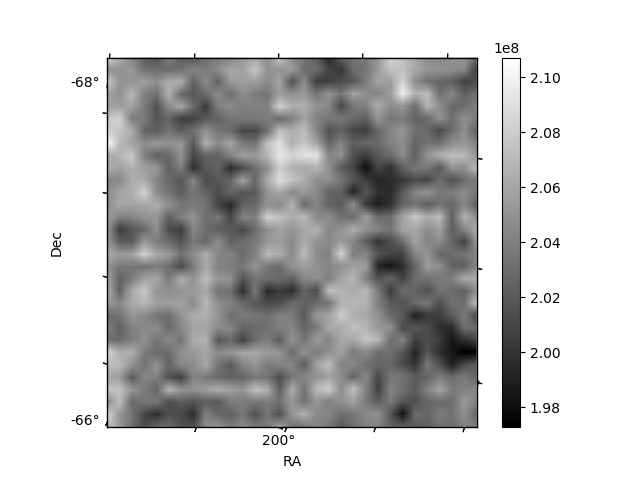
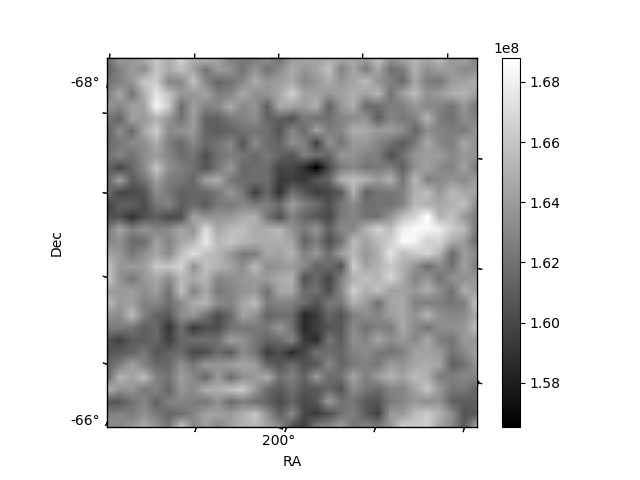
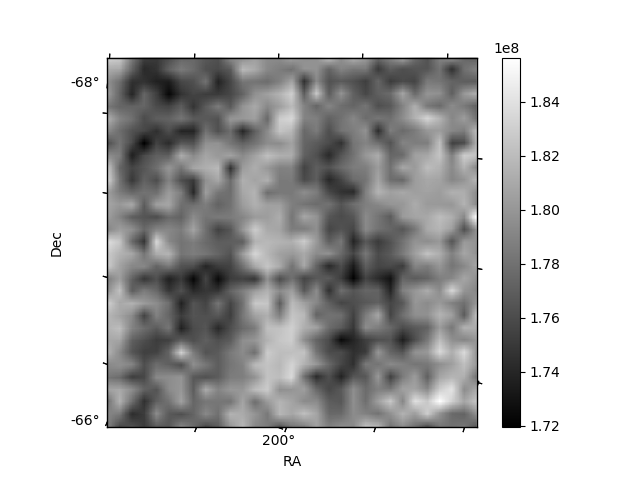
Histogram calculated using DETX and DETY for each event in the final _common_clean file
| Quadrant A | 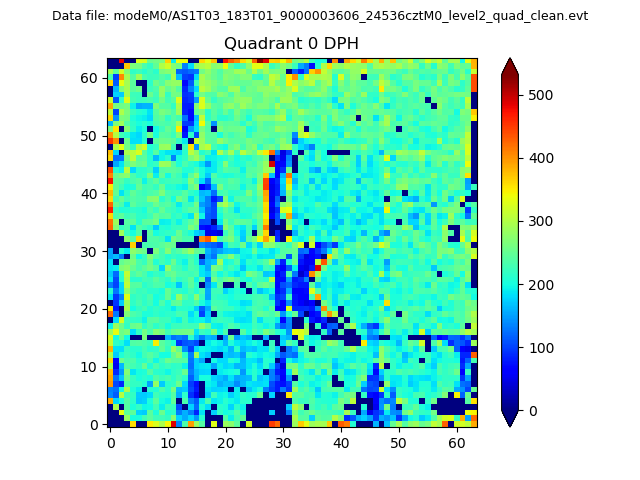 |
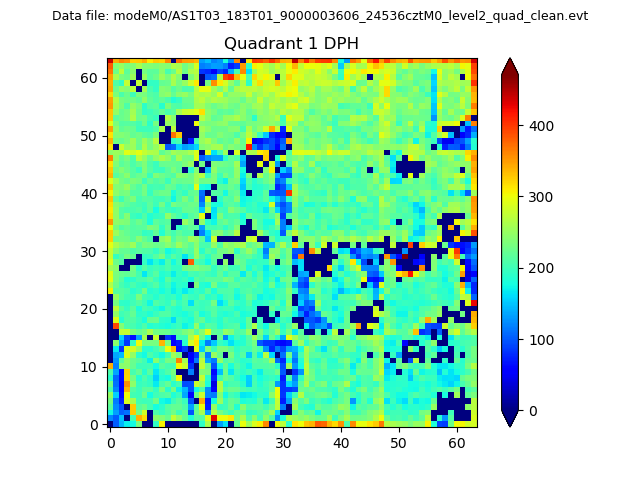 |
Quadrant B |
|---|---|---|---|
| Quadrant D | 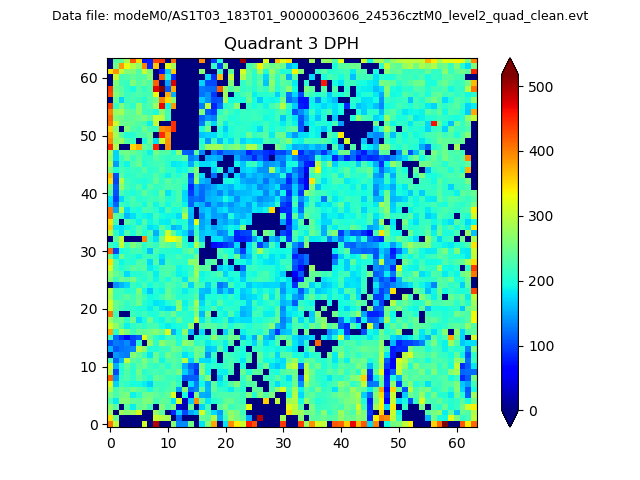 |
 |
Quadrant C |
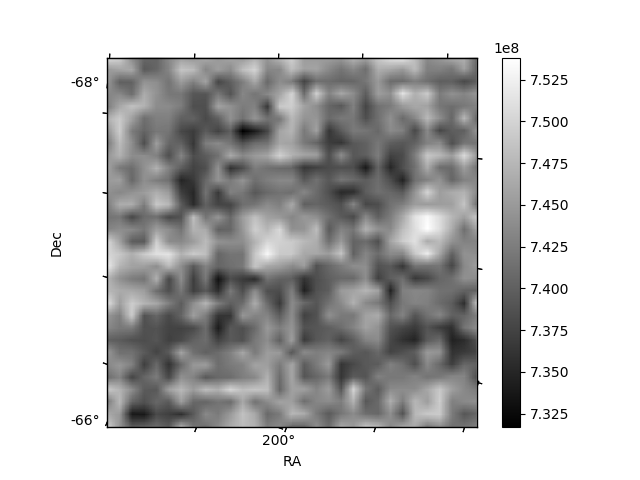
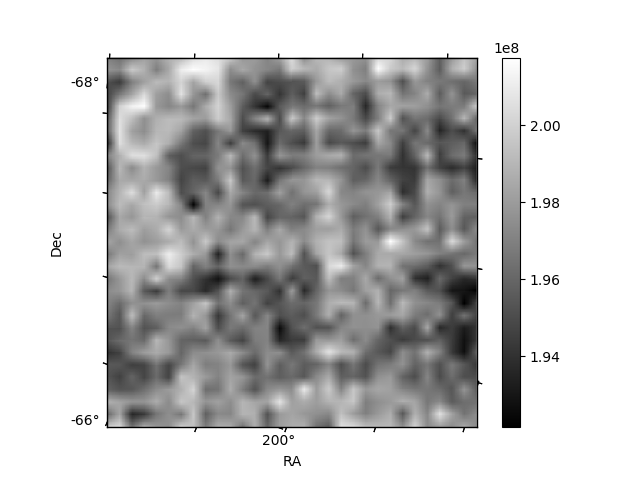
| Plot type | Count rate plots | Images |
|---|---|---|
| Comparison with Poisson distribution Blue bars denote a histogram of data divided into 1 sec bins. Red curve is a Poisson curve with rate = median count rate of data. |
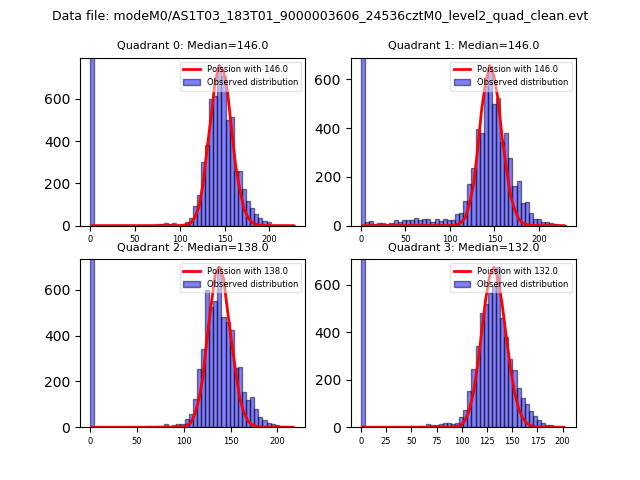 |
 |
| Quadrant-wise count rates Data is divided into 100 sec bins |
 |
|
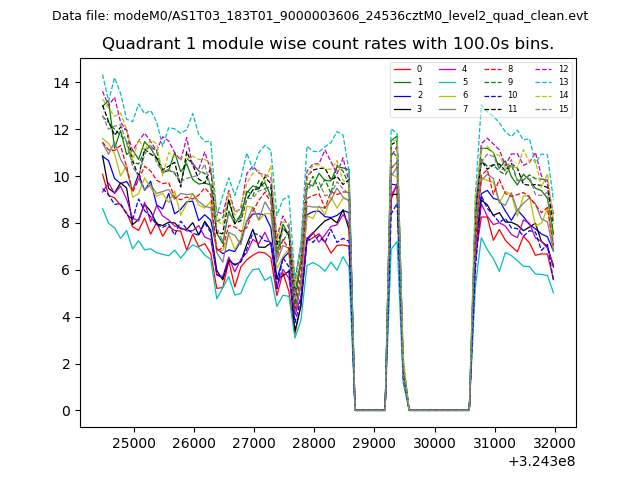
| Module-wise count rates for Quadrant A Data is divided into 100 sec bins |
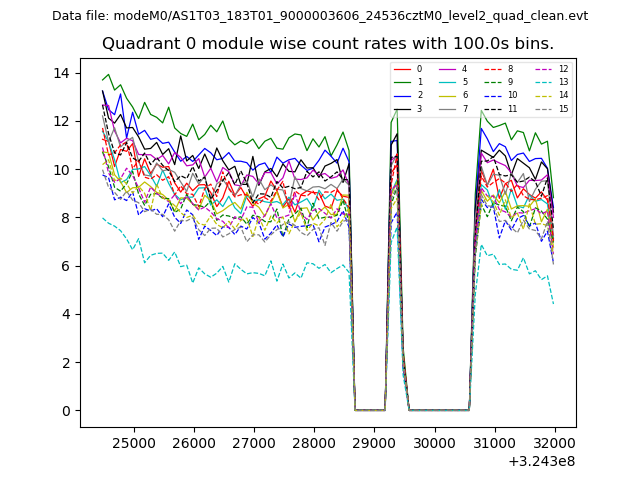 |
 |
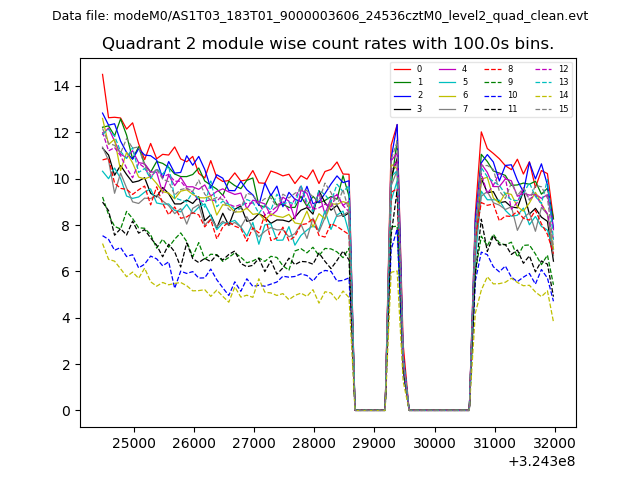
| Module-wise count rates for Quadrant B Data is divided into 100 sec bins |
 |
 |
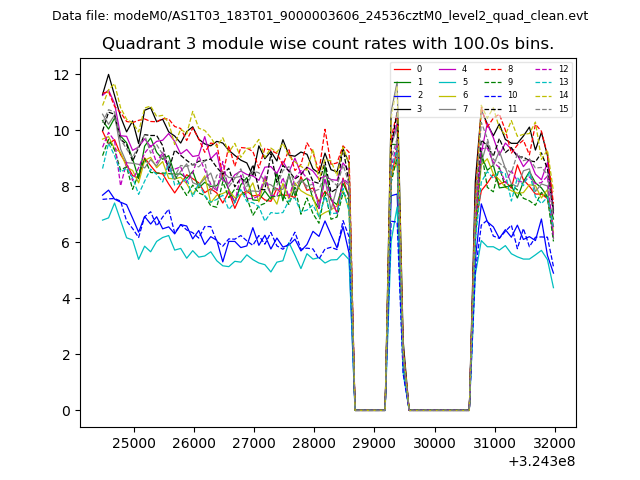
| Module-wise count rates for Quadrant C Data is divided into 100 sec bins |
 |
 |
| Module-wise count rates for Quadrant D Data is divided into 100 sec bins |
 |
 |
| Parameter | Plot |
|---|---|
| CZT HV Monitor | 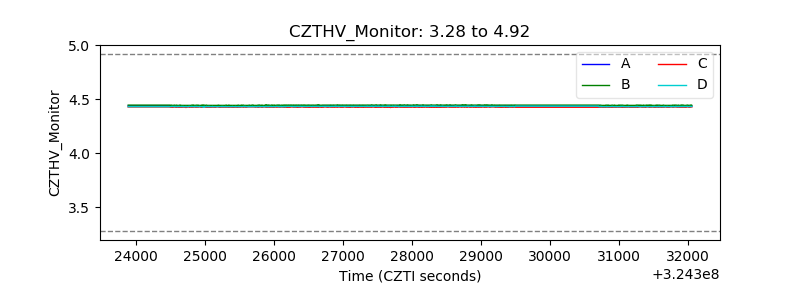 |
| D_VDD | 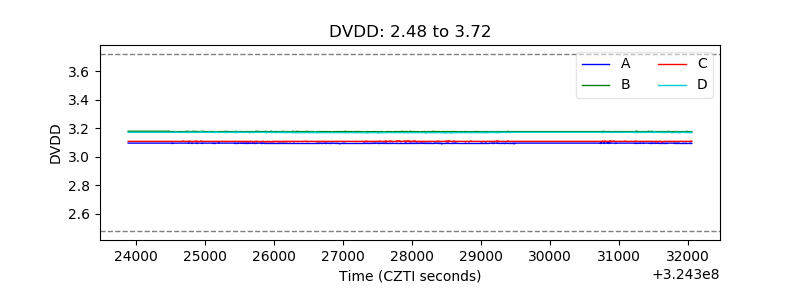 |
| Temperature 1 | 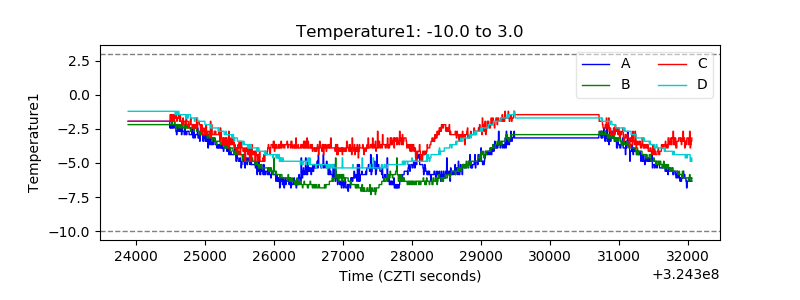 |
| Veto HV Monitor | 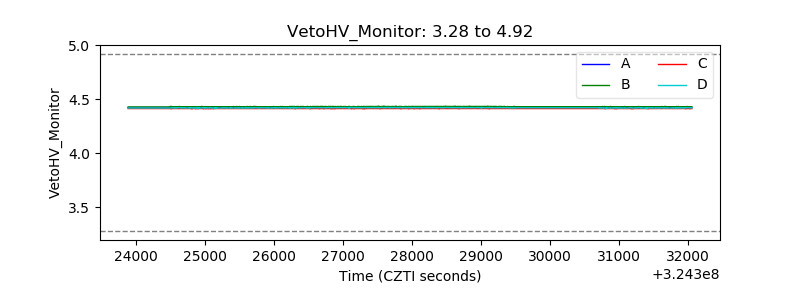 |
| Veto LLD | 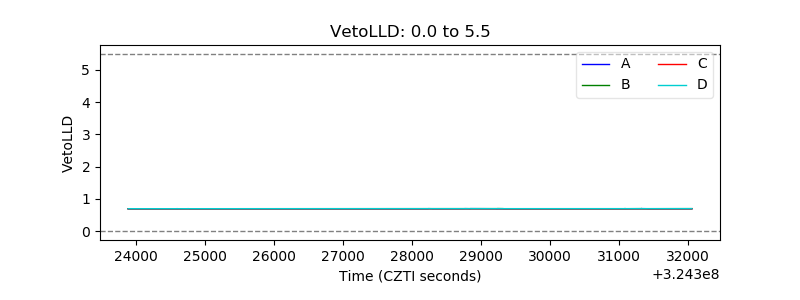 |
| Alpha Counter |  |
| _CPM_Rate |  |
| CZT Counter | 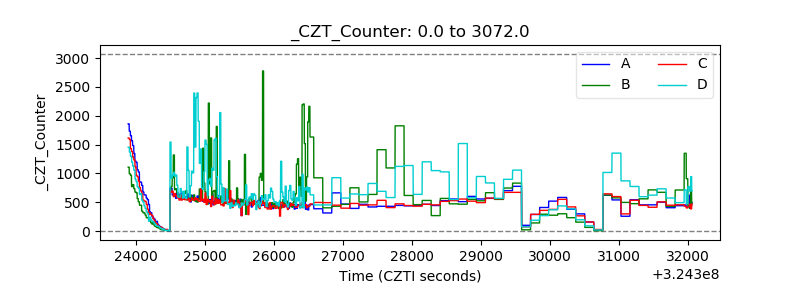 |
| +2.5 Volts monitor |  |
| +5 Volts monitor |  |
| _ROLL_ROT | 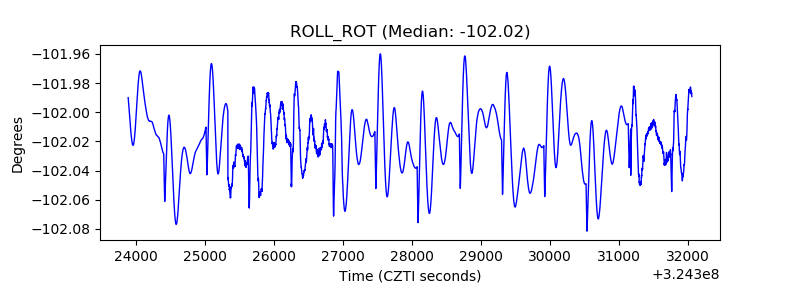 |
| _Roll_DEC | 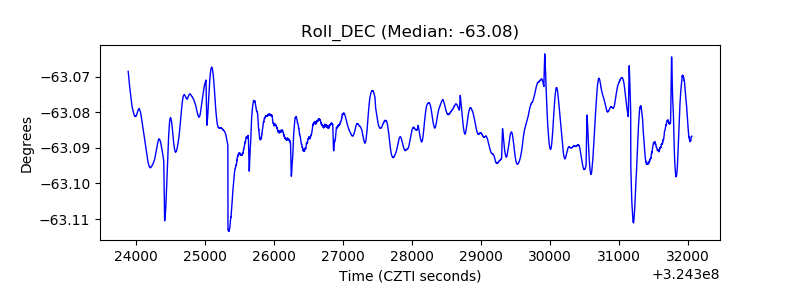 |
| _Roll_RA | 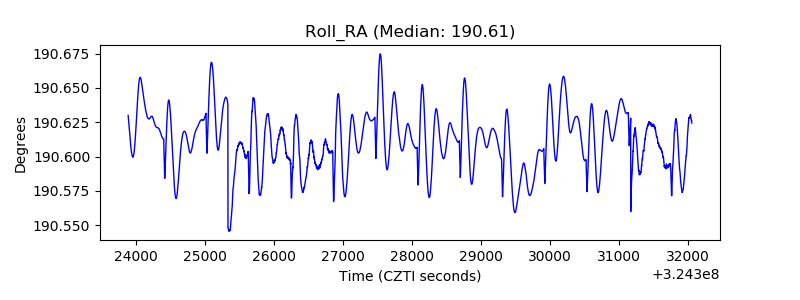 |
| Veto Counter | 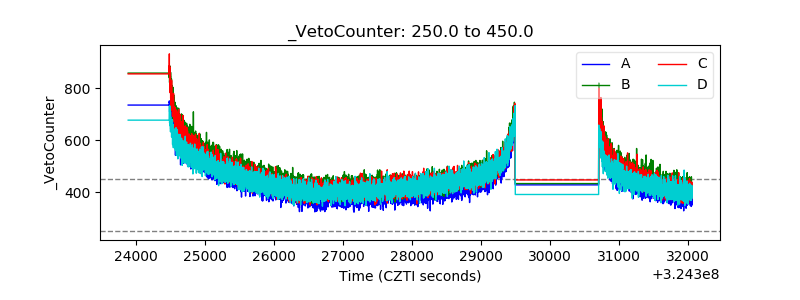 |